ETHUSDT – Trade Recap & Daily Bias for June 21Trade Recap (June 20):
I. First thing I did was mark out a DOL on the daily — price was hovering near a swing low, and I started noticing trend-side liquidity building up on the lower timeframes.
So my directional bias for today was short.
II. I marked the daily open.
III. With a short bias in mind, I waited for a Turtle Soup setup right above the daily open.
IV. The equal highs above were clean and obvious — textbook liquidity.
V. Once that liquidity was swept, I dropped to the M15 to watch how price reacted — waited for a clean displacement away from that zone before getting involved.
Daily Bias (June 21):
Still leaning short. We’re pretty close to a weekly FVG, which might act as a magnet.
If price forms liquidity during the day and takes it out in-session, I’ll look to short again.
Bread and Butter & Turtle Soup
Candlestick Analysis

Long trade
1min TF entry
🟢 Trade Journal Entry – Buyside Trade
📍 Pair: BTCUSDT
📅 Date: Saturday, June 21, 2025
🕒 Time: 11:45 AM (NY Session AM)
⏱ Time Frame: 1 Minute
📈 Direction: Buyside
📊 Trade Breakdown:
Entry Price 103,468.8
Profit Level 103,639.8 (+0.17%)
Stop Loss 103,420.3 (−0.05%)
Risk-Reward
Ratio 3.53: 1
🧠 Context / Trade Notes:
1-Minute TF Scalping Setup:
Trade executed on ultra-low time frame during late NY AM volatility window — ideal for short bursts of movement and precision entries.
Liquidity Sweep Below Minor Low:
Entry taken after price dipped below a small intra-session low, triggering a liquidity grab before a quick reversal.

Long trade
15
min overview
🟢 Trade Journal Entry – Buyside Trade
📍 Pair: ETHUSDT
📅 Date: Saturday, June 21, 2025
🕒 Time: 2:00 AM (Asian Session AM)
⏱ Time Frame: 15 Minutes
📈 Direction: Buyside
📊 Trade Breakdown:
Entry Price 2422.81
Profit Level 2474.60 (+2.14%)
Stop Loss 2415.04 (−0.32%)
Risk-Reward
Ratio 6.67 1
🧠 Context / Trade Notes:
BOS 5th June – 4HR Low Wick:
Break of structure observed on June 5th from a 4-hour low wick.
Observing the current NY session sweep of the liquidity from the London low wick signalled Sellside exhaustion.
Order Block & Retest:
A bullish OB formed on a prior swing, with a clean mitigation of price (Fri, 20th price range) and BOS, confirming buy-side interest.
5min TF Observation - entry:
Narrative:
Utilising DRT levels (coined by Ali Khan) to navigate the range and unfolding price action.
Target imbalance zone 1Hr.

Great recovery by Nifty to end the week. Nifty has shown a great recovery to end the week at 25112 despite persisting global uncertainties. This again shows imminent strength of Indian markets and confidence on the local factors by Bulls.
Nifty however is now entering a tough resistance zone which starts exactly from 25113 and extends till 25251. Once we get a closing above 25251 the Bulls will try to control the market with more strength. Till that happens it can still go in any direction. The supports for Nifty remain at 24869, 24713, 24480 (Mother line support), 24175 and finally 23838 (Father line support).
If any major further global escalation happens during the weekend and we get a closing below 23838 then Bears can become more powerful and they might have potential to push market further down towards 23047 or below.
Things hang in balance despite a strong closing on Friday as the shadow of the candle is still neutral.
Disclaimer: The above information is provided for educational purpose, analysis and paper trading only. Please don't treat this as a buy or sell recommendation for the stock or index. The Techno-Funda analysis is based on data that is more than 3 months old. Supports and Resistances are determined by historic past peaks and Valley in the chart. Many other indicators and patterns like EMA, RSI, MACD, Volumes, Fibonacci, parallel channel etc. use historic data which is 3 months or older cyclical points. There is no guarantee they will work in future as markets are highly volatile and swings in prices are also due to macro and micro factors based on actions taken by the company as well as region and global events. Equity investment is subject to risks. I or my clients or family members might have positions in the stocks that we mention in our educational posts. We will not be responsible for any Profit or loss that may occur due to any financial decision taken based on any data provided in this message. Do consult your investment advisor before taking any financial decisions. Stop losses should be an important part of any investment in equity.

NASDAQ Bread and Butter & Turtle Soup Example XIIaight, so im gonna break down a trade i took on nasdaq today using a setup i picked out myself from the ict concepts. just my own flavor of it, ya know
before i knock out at night, i open up the charts real quick — just tryna see if there's any clean liquidity chillin’ nearby. if there aint, i shut it down and catch some solid sleep. but if there is... bingo baby
this basically means i might just wake up rich tomorrow, bro. on the daily, im seeing two strong green days back to back, and right above that boom some equal highs just sitting there, begging to get run. they are even cleaner on the 1h. bias locked in. im waking up tomorrow and hunting longs, simple as that.
i mark up the daily open first thing. if im lookin for longs, i wanna see some turtle soup under the open. if im hunting shorts, i need that setup above the open. thats just how i roll.
if there is a swing low, trend liquidity, or some equal lows carryin over from yesterday, im locked in on those levels for turtle soup. if not, im just chillin, waitin for price to build some fresh liquidity during the day and then snatch it.
in this setup, i got some leftover liquidity from yesterday plus a clean 4h fvg sittin there like a neon sign.
next, i check the time. liquidity grabs usually hit during one of the killzones depends on the pair, but im watchin asia, london, or new york sessions.
then i scope out if there is any news droppin around that time, especially stuff that could move the pair. no point in getting blindsided.
and yeah, i always peep correlated pairs too sometimes they snitch before your chart even says a word.
when all the stars and planets line up just right, that is when I drop down to the 15m and wait for a clean csd to show up. but here is the thing i dont jump in the second i see it. i wanna see price actually leave the liquidity zone.
yeah, it might lower my rr a bit, but the win rate goes way up. It keeps me outta those fake-ass turtle soups that look good at first but just wanna wreck your stop.
once im in the trade, i usually try to close out half the position the same day take profits where the chance of price reversing is damn near zero. then i let the other half ride toward my target liquidity. just lettin it breathe, do its thing.
thats it, peace out

ETHUSD Potential long ideaThe market made an all time high at 4095.4 following the November bull run. Street money flooded premium prices trying to buy above all time highs. Once price inevitably dropped from that premium level all of the bulls who bought above premium provided not only exit liquidity for longer term traders, but also "resistance" or "supply" levels that are easily recognizable for anyone who wants to double down on their position once the market forms what appears to be a short term low. Seeing this kind of trading occur in the way that it is occurring and at the prices that it is occurring at gives me insight that the market is now going to enter ranging conditions pairing liquidity from both sides of the range.
the market goes right to 01.23.24 low at 2165 and sweeps that level eventually making its way right back to 4097.4 only $2 higher than the all time high. These 3 levels being used in this way to send the market to both sides of a trapped range is done to allow for time to pass and orders to build up.
Since the overall trend of the crypto markets and ETH in general is upward, I am assigning this behavior to institutional accumulation of discount prices. Under this assumption I will look to see a new short term low set in the market. I will see that signature begin when a short term high leads to taking out a htf discount level with an aggressive displacement lower.
I can expect to see these sweeps just above or just below key lows
Key prices to watch
- Sunday 05.18.25 low; 2325
- Friday 05.09.25 H4 +ob; 2350.9
- Daily dealing range C.E; 2271.5
- Daily + Breaker open 2081.5
- M0A_. 1732.5

The rebound is weak, is it expected to continue to decline? 📰 Impact of news:
1. Geopolitical situation
2. Pay attention to the impact of short-term trends of the US dollar and silver on gold
📈 Market analysis:
The weekly level large range sweep is still going on, with a focus on the space defense dividing line area of the 10-day moving average and the 3315-3310 area. After falling back to the lifeline in four hours, it continued to bend downward under pressure. During the sweeping decline, the suppression became more obvious. Whether there will be a wave of large-volume market, the pattern is expected to further open and guide the direction. In this process, note that the lifeline 3375 is also the resistance point determined by the last rebound last night. Use this as suppression to sweep the range below. On the whole, for the future gold, if it can maintain the rhythm of defending highs and breaking lows, and successfully closes at a low level today, then next week it is expected to further switch downwards to sweep space. Therefore, we will continue to focus on two support areas, one is 3345-3335, and the other is 3315-3310 after breaking
🏅 Trading strategies:
BUY 3345-3335
TP 3355-3365
SELL 3365-3375
TP 3345-3335-3315
If you agree with this view, or have a better idea, please leave a message in the comment area. I look forward to hearing different voices.
TVC:GOLD FXOPEN:XAUUSD FOREXCOM:XAUUSD FX:XAUUSD OANDA:XAUUSD

HYPE/USDT: Analyzing Major Buying Levels & Current RetracementPrice Action and Trend:
Since late 2024, HYPE/USDT has exhibited a volatile but generally upward-biased trend, particularly from April 2025 onwards. The initial period in late 2024 and early 2025 showed significant volatility with rapid pumps and dumps, characteristic of a nascent or highly speculative asset. A notable downtrend occurred from late February to mid-April 2025, reaching a low around the $12-$13 range. Following this, there's been a strong uptrend, with price breaking out of previous resistance levels and establishing new highs in May and June 2025, peaking near $40-$42. Currently, the price is undergoing a significant retracement from its recent highs.
Major Buying Levels (Yellow Zones):
The yellow zones on the chart clearly delineate significant demand (buying) levels:
Lowest Zone ($14.658 - $16.849) : This zone served as a strong accumulation area in late April and early May 2025. Price found substantial support here after the preceding downtrend, indicating a strong influx of buyers. This zone represents a foundational demand level where strong buying interest emerged, leading to the subsequent upward impulse.
Middle Zone ($22.303 - $25.927) : After the initial rally from the lowest zone, price consolidated and then retested this middle zone in late May 2025. The swift bounce from this area confirms its role as a significant demand zone, where buyers stepped in to prevent further declines and propel the price higher. This zone likely represents a point where early buyers took profits, and new demand entered, or previous buyers added to their positions.
Highest Zone ($30.596 - $34.316) : This most recent yellow zone became active in June 2025. After breaking through earlier resistance, price retraced into this area following its peak. The current price is hovering around the upper boundary of this zone ($34.316), indicating that buyers are attempting to defend this level. This zone signifies a crucial area where previous resistance may have flipped into support, attracting new buying interest. Its ability to hold will be critical for the continuation of the uptrend.
Supply Zones:
While not explicitly highlighted in yellow, several supply zones are evident where selling pressure intensified:
Around $27-$28 (Late 2024/Early 2025): Multiple wicks and rejections around this price range in late 2024 and early 2025 suggest a strong supply area. Price struggled to sustain above this level on several occasions, leading to pullbacks.
Around $30-$31 (Early 2025): Similar to the above, this area acted as resistance, causing price to reverse downwards after attempts to break higher.
The recent peak around $40-$42 (June 2025): This is the most significant recent supply zone. The sharp rejection from this area, marked by the long upper wick and subsequent bearish candles, indicates strong selling pressure at these elevated prices. This suggests profit-taking by earlier buyers and/or new shorting interest.
Current Price Position:
The current price of HYPE/USDT is approximately $34.345, which is at the upper boundary of the highest major buying level (yellow zone: $30.596 - $34.316). This indicates that the price has retraced significantly from its recent peak and is currently testing a crucial demand zone. The reaction at this level will be paramount in determining the immediate future direction.
Potential Future Scenarios:
Bullish Scenario: If the highest yellow zone ($30.596 - $34.316) holds as strong support, and buying pressure re-emerges, HYPE/USDT could consolidate within this zone before attempting another rally towards the recent highs ($40-$42) and potentially breaking above them. A strong bounce from this level would confirm renewed buyer confidence.
Bearish Scenario: If the current demand zone ($30.596 - $34.316) fails to hold, indicating a lack of buying interest at these levels, HYPE/USDT could see further downside. The next potential support levels would then be the middle yellow zone ($22.303 - $25.927). A break below the current zone would signal a shift in market sentiment and potentially the beginning of a deeper correction.
Key Observations:
Clear Demand Zone Effectiveness: The yellow zones have historically served as effective demand zones, leading to significant bounces and upward movements. This reinforces their importance as areas where institutional or significant retail buying has occurred.
Volatility and Wicks: The presence of long wicks (both upper and lower) indicates periods of significant price discovery and battle between buyers and sellers, especially around key levels.
Breakout and Retest Pattern: The price has shown a tendency to break out of resistance, then retest those levels (which often flip to support) before continuing its move, as seen with the middle yellow zone.
Recent Pullback: The current pullback from the highs around $40-$42 suggests profit-taking and the encounter of a strong supply zone. The ability of buyers to absorb this selling pressure at the current demand level will be a key determinant of future price action.
In summary, HYPE/USDT is at a critical juncture, testing a major buying level. The market's reaction to this demand zone will dictate whether the recent bullish momentum can be sustained or if a deeper correction is on the horizon.

GJ longGJ is heading towards the weak highs but momentum is slowing down.
Therefore I'm expecting to grab some liquidity first before breaking the highs.
After breaking the highs I would expect a deeper mitigation before the continuation towards the newly created higher highs.

UJ longUJ is making HH's / HL's and is heading towards the next weak high.
Upcoming weak has a lot of high impact news, so I would expect a deep mitigation first before the continuation towards new higher highs.

Nasdaq longThe last bullish structure never did a deep mitigation, reach an demand and trade up to higher highs. Price is in a HTF consolidation, bears and bulls are pushing price between a large range at the moment.
Upcoming week will show a lot of high impact news events, I'm expecting price to continue bullish. It's a matter of time.

Stick to shorting gold and holding itAlthough gold has risen sharply to around 3375 in the short term due to the dovish remarks of Fed officials, it has not made an effective breakthrough. Therefore, gold has not reversed its trend due to the short-term rebound. Gold is still in an obvious short trend. In the short term, gold is obviously under pressure in the 3365-3375 area. If gold fails to break through this resistance area, then after gold consumes a certain amount of long energy, gold shorts will counterattack again and are expected to retreat to the 3350-3340 area again.
In the case that good news cannot support the continued rebound of gold, the market's bullish confidence will be hit again, and the short confidence will be further strengthened, stimulating gold to accelerate its decline, and it is even expected to fall below the 3350-3340 area. Therefore, in short-term trading, I still advocate shorting gold, and I am currently holding a short position in gold, and I look forward to the accelerated decline of gold as expected!

Long trade
🟢 Trade Journal Entry – Buyside Trade
📍 Pair: NZDUSD
📅 Date: Tuesday, June 17, 2025
🕒 Time: 3:00 PM (NY Session PM)
⏱ Time Frame: 1 Hour
📈 Direction: Buyside
📊 Trade Breakdown:
Entry Price 0.60143
Profit Level 0.60749 (+1.01%)
Stop Loss 0.60052 (−0.15%)
Risk-Reward
Ratio 6:66 1
🧠 Context / Trade Notes:
1HR OB Entry Zone:
Long trade taken off a bullish order block zone following prior mitigation and consolidation buildup.
Sweep of Internal Liquidity:
Entry positioned after a sweep of a short-term low and rejection off internal demand.

Perhaps 3300 or even 3280 is foreseeable!Obviously, gold is currently fluctuating downward, and in the short term, there is a certain support in the 3340-3330 area, so gold will not fall below this support area in one fell swoop, and it is still possible to rebound to the 3360-3370 area with the support of this area. If gold encounters resistance and retreats again after touching the 3360-3370 area, if there is no major good news, gold is likely to fall below the 3340-3330 area. After gold falls below this support area, the 3300 and 3280 areas are foreseeable.
So according to the above logic, I still hold a long position executed near 3345, and I am very much looking forward to gold reaching the 3360-3365 area;
If gold continues to rebound to the 3365-3375 area, I will try to short gold again; and look forward to the accelerated downward movement of gold!
The above is a preview of the performance of gold. There may be some deviations in the specific execution of transactions, because in short-term transactions, it is necessary to judge the true breakthrough and false breakthrough in advance, but I will still roughly follow the above preview process to execute the transaction! I also hope that this can provide some reference for everyone!

Nifty Analysis EOD – June 20, 2025 – Friday🟢 Nifty Analysis EOD – June 20, 2025 – Friday 🔴
🚀 Bull Run Out of the Blue 🚀 – A Masterclass in Price Action
Nifty kicked off the session with a +56-point gap-up — surprising many, especially since Gift Nifty hinted flat to negative and yesterday’s close was weak. The real jolt came when, in the very first minute, price broke above the Previous Day High (PDH) and opened directly above the CPR zone — a rare occurrence when geopolitical tensions are peaking.
As I often say:
📌 “Market rarely follows the obvious. It thrives in the unexpected.”
Today was a textbook example of that.
Luckily, we were prepped. In yesterday’s note, I mentioned the bullish trigger above 24,862 — and right from the open, Nifty respected every level, offering "hope-on" and "hope-off" trades. What seemed like a 25K test turned into a blast to 25,136, with 100 points added in the last 30 minutes, leaving even seasoned traders awestruck.
The intraday close at 25,079.75 and the adjusted close at 25,112.40 — both above the 15th May closing levels — give a bullish vibe heading into the weekend. 🤞
💬 Personal Note:
Today was special — I sat with my elder daughter, helping her understand real-time market behavior. And what a day it was! From trend reversals, cup & handle, head & shoulders, wedges, shallow pullbacks, to aggressive one-way rallies — everything aligned perfectly to make this a live-action lesson in intraday trading.
🕯 5 Min Time Frame Chart with Levels
🕯 Daily Time Frame Chart
🕯 Daily Candle Breakdown
Open: 24,787.65
High: 25,136.20
Low: 24,783.65
Close: 25,112.40
Change: +319.15 (+1.29%)
📊 Candle Structure Breakdown
Real Body: 324.75 pts → ✅ Strong Green Candle
Upper Wick: 23.80 pts
Lower Wick: 4.00 pts
🔍 Interpretation
Opened flat and never looked back.
Minimal wicks = clear directional strength.
Buyers in full control from open to close.
🕯 Candle Type
📈 Bullish Marubozu-like — One of the strongest bullish signals. A powerful sign of trend continuation or breakout momentum.
📌 Key Insight
Today’s candle reinforces bullish strength.
Holding above 25,100 is key going forward.
A move above 25,136 could invite fresh upside targets — possibly 25,180+ and beyond.
🛡 5 Min Intraday Chart
⚔️ Gladiator Strategy Update
ATR: 251.32
IB Range: 116.6 → Medium IB
Market Structure: 📈 ImBalanced
Trades Triggered:
🔹 9:41 AM – Long Trade → Target Achieved (Trailing Exit, R:R 1:4.79)
🔹 12:18 PM – Short Contra Trade → Target Achieved (R:R 1:2)
🔹 1:07 PM – Long Trade → Target Achieved (Trailing Exit, R:R 1:2.62)
📌 Support & Resistance Zones
Resistance Levels
25,125 ~ 25,150
25,180 ~ 25,212
25,285
Support Levels
25,080 ~ 25,060
25,000 ~ 24,980
24,965
24,894 ~ 24,882
💭 Final Thoughts
The market surprised today — not just in movement but in clarity.The clean break, follow-through strength, and intraday structure hint at momentum continuation — but weekends can bring surprise news.
📌 Watch 25,100 as line in the sand on Monday.
🧠 “Markets are teachers. Today’s lesson? Expect the unexpected, but prepare like it’s already here.”
✏️ Disclaimer
This is just my personal viewpoint. Always consult your financial advisor before taking any action.

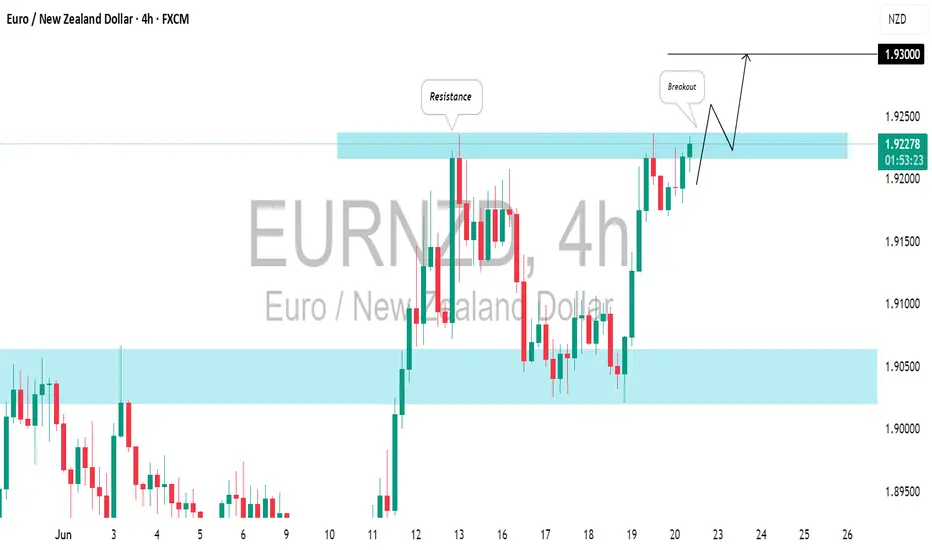
EURNZD: Waiting For Another BreakoutBased on the current trend, I believe you would concur that ⚠️EURNZD is likely to keep rising.
A bullish breakout above the highlighted blue resistance and a 4H candle closing above 1.9240 would
serve as a key confirmation, potentially driving prices up to 1.9300.
A glimmer of hope for bullish lovers!Gold is currently dominated by bears, but thanks to the support of risk aversion caused by geopolitical conflicts, gold has shown a certain degree of resistance to decline while falling. Therefore, the current market direction is very clear, with weak and volatile downward movement. But under this market situation, we cannot short gold excessively. We can only wait for it to rebound to the pressure level and then short gold, or try to go long on gold with strong support.
At present, gold has touched the 3350 area again, which has a certain support effect. If gold cannot effectively fall below 3350, then gold may still rebound to the 3370-3380 area again; but once gold effectively breaks the support near 3350, gold is expected to continue to fall to the 3340-3330 area.
In terms of short-term trading, I think it is possible to consider starting to try to go long on gold in batches in the 3350-3330 area, TP: 3365-3375

BTC/USDT Technical Analysis, 2025-06-18 09:45 UTC📘 BTC/USDT Scalping Setup – Whale-Assisted Dip Buy
This strategy is designed for high-precision, short-term long trades on BTC/USDT using the 15-minute chart. It targets oversold conditions with signs of reversal, confirmed by whale activity, volume spikes, and key support levels.
The edge comes from combining retail technicals (RSI, Stoch, MACD, candlestick patterns) with institutional confirmation (order flow, OBV, and large bids from whales).
✅ Key Strategy Components:
Oversold Technicals: RSI and Stochastic suggest price exhaustion.
Support Zone Alignment: Price is dipping near major support (pivot S1 or local low).
Reversal Candlestick: Clean bullish signals like Hammer or Engulfing show shift in sentiment.
Smart Money Confirmation:
Whale buyers (>5 BTC bids)
Bid dominance (>3%)
OBV rising = silent accumulation
Timing is Critical: Trades are only taken in the first 2 minutes of the 5-min candle with a volume burst.
🎯 Trade Management
Entry: On close of confirming candle (when all criteria align)
Take Profit: +1.2% (or ~1200 pts)
Stop Loss: -0.6% (or ~600 pts)
Risk/Reward: 1:2
📈 Why This Works
This is not just a basic RSI/Stochastic play — it’s a multi-confirmation strategy tuned for whale detection, volume acceleration, and institutional footprints. It’s ideal for high-volatility sessions and works best in range or retracement phases of a broader uptrend.
⚠️ Pro Tips
Avoid entries during extreme news volatility
Be disciplined – all filters must align (this is a precision setup)

Long trade
🟢 Trade Journal Entry – Buyside Trade
📍 Pair: AUDUSD
📅 Date: Tuesday, June 17, 2025
🕒 Time: 3:00 PM (NY Session PM)
⏱ Time Frame: 1 Hour
📈 Direction: Buyside
📊 Trade Breakdown:
Entry Price 0.64738
Profit Level 0.65380 (+0.99%)
Stop Loss 0.64639 (−0.15%)
Risk-Reward
Ratio 6.48 : 1
🧠 Context / Trade Notes:
1HR TF Execution:
Entry aligned with bullish OB on the 1hr chart following a clean mitigation and rejection candle.
Stacked Confluences:
Liquidity sweep, OB retest, and session timing aligned for a high-conviction buyside setup.

Long trade
📍 Pair: EURUSD
📅 Date: Tuesday, June 17, 2025
🕒 Time: 3:00 PM (NY Session PM)
⏱ Time Frame: 1 Hour
📈 Direction: Buyside
📊 Trade Breakdown:
Entry Price 1.14816
Profit Level 1.15696 (+0.77%)
Stop Loss 1.14640 (−0.15%)
Risk-Reward
Ratio 5:1
🧠 Context / Trade Notes:
1H Structure Entry:
Trade initiated at a key bullish order block on the 1hr timeframe, following higher-timeframe trend alignment.

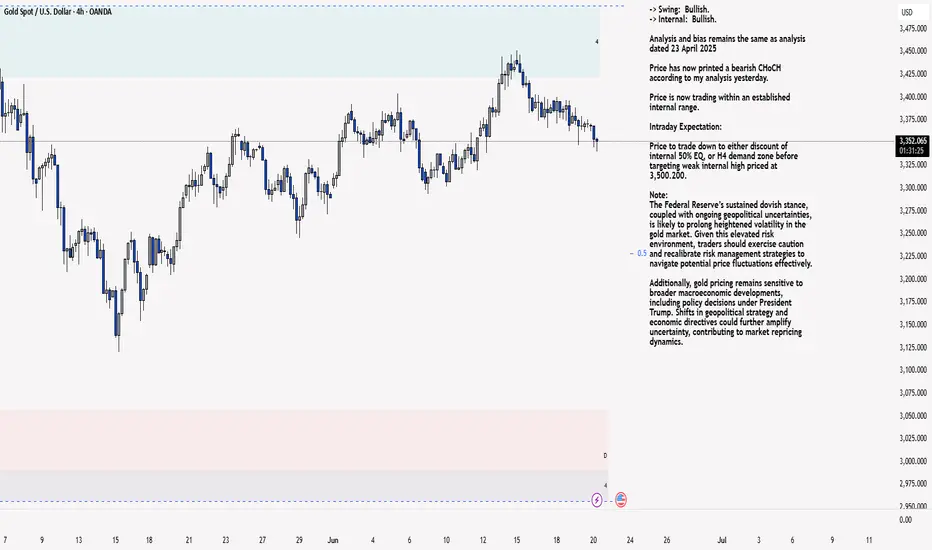
XAU/USD 20 June 2025 Intraday AnalysisH4 Analysis:
-> Swing: Bullish.
-> Internal: Bullish.
Analysis and bias remains the same as analysis dated 23 April 2025
Price has now printed a bearish CHoCH according to my analysis yesterday.
Price is now trading within an established internal range.
Intraday Expectation:
Price to trade down to either discount of internal 50% EQ, or H4 demand zone before targeting weak internal high priced at 3,500.200.
Note:
The Federal Reserve’s sustained dovish stance, coupled with ongoing geopolitical uncertainties, is likely to prolong heightened volatility in the gold market. Given this elevated risk environment, traders should exercise caution and recalibrate risk management strategies to navigate potential price fluctuations effectively.
Additionally, gold pricing remains sensitive to broader macroeconomic developments, including policy decisions under President Trump. Shifts in geopolitical strategy and economic directives could further amplify uncertainty, contributing to market repricing dynamics.
H4 Chart:
M15 Analysis:
-> Swing: Bullish.
-> Internal: Bullish.
Following previous high, and printing of bearish CHoCH, price has pulled back to an M15 supply zone, where we are currently seeing a reaction. Therefore, I shall now confirm internal high.
Price is now trading within an established internal range.
The remainder of my analysis shall remain the same as analysis dated 13 June 2025, apart from target price.
As per my analysis dated 22 May 2025 whereby I mentioned price can be seen to be reacting at discount of 50% EQ on H4 timeframe, therefore, it is a viable alternative that price could potentially print a bullish iBOS on M15 timeframe despite internal structure being bearish.
Price has printed a bullish iBOS followed by a bearish CHoCH, which indicates, but does not confirm, bearish pullback phase initiation. I will however continue to monitor, with respect to depth of pullback.
Intraday Expectation:
Price to continue bearish, react at either M15 supply zone, or discount of 50% internal EQ before targeting weak internal high priced at 3,451.375.
Note:
Gold remains highly volatile amid the Federal Reserve's continued dovish stance, persistent and escalating geopolitical uncertainties. Traders should implement robust risk management strategies and remain vigilant, as price swings may become more pronounced in this elevated volatility environment.
Additionally, President Trump’s recent tariff announcements are expected to further amplify market turbulence, potentially triggering sharp price fluctuations and whipsaws.
M15 Chart:
The bear market is over? Short at high and long at low📰 Impact of news:
1. The interest rate remains unchanged and leads to new lows in the short term
2. Geopolitical tensions provide support for risk aversion
📈 Market analysis:
Due to the early closing yesterday, the volatility of the US market was limited and the market seemed relatively flat. From a technical perspective and the current trend, 3340 is a key defensive support level. If it retreats to this level, you can consider going long. If the gold price continues to rise and reaches 3375, from the perspective of trading strategy, you can choose to place a short order here. Focus on the resistance line of 3370-3375 during the day, and pay attention to the support of 3345-3335 below.
🏅 Trading strategies:
SELL 3370-3375
TP 3360-3355-3345
BUY 3345-3335
TP 3360-3370
If you agree with this view, or have a better idea, please leave a message in the comment area. I look forward to hearing different voices.
OANDA:XAUUSD FX:XAUUSD FOREXCOM:XAUUSD FXOPEN:XAUUSD TVC:GOLD

EURUSD: Deciding Point for Bearish BiasCurrent Price at Critical Resistance : The price action is currently challenging a significant downward-sloping resistance channel (highlighted in red). This zone has historically acted as a ceiling for price movements, and the current location is explicitly labeled as a "Decider for Breakdown," indicating a pivotal point for future direction.
Implied Bearish Bias : The overall sentiment indicated by the chart's title "At deciding Level, Mostly Bearish" suggests a lean towards downside continuation, although the price is currently pushing against resistance.
Identified Support Confluence : Below the current price, a layered support structure is identified. This includes an upward-sloping "Trend Line Support" channel (green) and a prominent horizontal "POC" (Point of Control), likely derived from volume profile analysis, both residing within a broader "Support Area" (green shaded zone).
Potential Future Pathways : Two immediate potential scenarios: a bearish continuation (red dotted path) if the current resistance holds and lower support levels are broken, or a bullish reversal (green dotted path) if the price successfully breaks above the descending resistance channel.
Swing Structure Visibility : Its kind of Flag and Pole pattern on larger picture, but there is also downward trending line. Purple line indicates the overall market structure interpretation.
Disclaimer:
The information provided in this chart is for educational and informational purposes only and should not be considered as investment advice. Trading and investing involve substantial risk and are not suitable for every investor. You should carefully consider your financial situation and consult with a financial advisor before making any investment decisions. The creator of this chart does not guarantee any specific outcome or profit and is not responsible for any losses incurred as a result of using this information. Past performance is not indicative of future results. Use this information at your own risk. This chart has been created for my own improvement in Trading and Investment Analysis. Please do your own analysis before any investments.
