The market is closed today. How to arrange gold in the evening?📰 Impact of news:
1. The interest rate remains unchanged and leads to new lows in the short term
2. Geopolitical tensions provide support for risk aversion
📈 Market analysis:
The market is expected to not fluctuate much today. Generally speaking, it is difficult to stand on one foot to form a short-term bottom. There should be a second wave of bottom exploration, a secondary low point, and then the bottom is explored and pulled up to break through the previous high point. Only then can the turning point be officially established and the decline end. Moreover, the 1H moving average is spreading downward. Therefore, in the short term, we still pay attention to the 3375-3385 line of resistance and the 3360-3355 line of support below.
🏅 Trading strategies:
SELL 3375-3385
TP 3365-3360-3355
BUY 3360-3355
TP 3370-3380-3405-3420
If you agree with this view, or have a better idea, please leave a message in the comment area. I look forward to hearing different voices.
TVC:GOLD FXOPEN:XAUUSD FOREXCOM:XAUUSD FX:XAUUSD OANDA:XAUUSD
Candlestick Analysis

Continue to short gold after the reboundGold has currently hit a low of around 3347, and rebounded after slightly breaking through 3350. It has now rebounded to around 3370. Will gold continue to rebound and hit 3400 again?
I think it is unlikely that gold will continue to rebound and hit 3400 in the short term. From a fundamental perspective, many of the news leaked out about the situation in the Middle East are untrue, and the conflict has not escalated further, so gold has not reacted much to this; and as market expectations for interest rate cuts decrease, the impact of news supporting gold's upward trend is gradually weakening;
From the current structure, since gold fell below 3370, bears have completely taken the upper hand. Although gold has rebounded from around 3347, it is only a short-term technical repair and oversold rebound from a structural perspective, and it cannot be said that it is a restart of bulls. So I think gold still has the risk of a second decline after the rebound, and once gold falls again, it may trigger a large number of profit-taking orders and a large number of short-sellers to enter the market.
As the center of gravity of gold shifts downward, the short-term resistance area moves down to 3380-3390; the current support area below is near 3350, followed by 3335. So for short-term trading, I still prefer gold short trading, and we can continue to short gold with this short-term resistance area.

AUDNZD: Intraday Bearish Move Ahead?! 🇦🇺🇳🇿
AUDNZD nicely reacted to a key horizontal resistance level.
The price formed a bearish CHoCH on an hourly time frame
after its test.
I expect a retracement to 1.086 level.
❤️Please, support my work with like, thank you!❤️
I am part of Trade Nation's Influencer program and receive a monthly fee for using their TradingView charts in my analysis.

Nifty Analysis EOD – June 19, 2025 – Thursday🟢 Nifty Analysis EOD – June 19, 2025 – Thursday 🔴
📉 Bookish Spinning Top Doji – Another Day of Indecision on Expiry
Nifty opened with a mild +16-point gap-up and immediately dipped to test the Previous Day Low (PDL), marking the day low at 24,738.10. A quick reversal took the index 125 points higher, reaching a high of 24,863, only to settle back into theta-eating mode around VWAP.
Just as things looked ready to turn, a 13:50 breakout attempt fizzled as the price faced rejection above the CPR zone, leading to a final dip below the previous low, touching a new intraday low at 24,733.
Though the intraday close was at 24,744.70, the settlement close was 24,793.25 — a 47.65-point difference that’s not trivial, especially on expiry day.
The entire day remained a narrow-range, rollercoaster ride — clearly showing neither bulls nor bears could take charge. The total range was just 130 points, forming a textbook Spinning Top, which reflects market contraction.
📌 Now what?
Keep a close eye on the range:
🟢Bullish Breakout ➤ above 24,862 (CDH)
🔴Bearish Breakdown ➤ below 24,733 (CDL)
The squeeze is on. Expansion is near.
🕯 5 Min Time Frame Chart with Levels
🕯 Daily Time Frame Chart
🕯 Daily Candle Breakdown
Open: 24,803.25
High: 24,863.10
Low: 24,733.40
Close: 24,793.25
Change: −18.80 (−0.08%)
📊 Candle Structure Breakdown
Real Body: 10.00 pts → 🔻 Small Red Candle
Upper Wick: 59.85 pts
Lower Wick: 59.85 pts
🔍 Interpretation
Equal wicks show balanced buying and selling.
Small real body signals strong indecision.
Intraday volatility was neutral despite expiry impact.
🕯 Candle Type
⚖️ Perfect Spinning Top / Doji-like Candle – Indicates market contraction, waiting for directional resolution.
📌 Key Insight
The market continues its tight range-bound structure.
Any breakout beyond 24,865 or breakdown below 24,730 could trigger directional moves.
Till then: “Wait and watch mode.”
🛡 5 Min Intraday Chart
⚔️ Gladiator Strategy Update
ATR: 240.08
IB Range: 125.00 → Medium IB
Market Structure: ⚖️ Balanced
Trades:🚫 No Trade Triggered by System
📌 Support & Resistance Zones
Resistance Levels
24,894 ~ 24,882
24,972 ~ 25,000
25,060 ~ 25,080
25,102 ~ 25,125
Support Levels
24,825 ~ 24,847
24,725 ~ 24,735
24,660
24,590
💭 Final Thoughts
The market is compressing like a coiled spring.Spinning tops near resistance often signal upcoming volatility.Let the breakout come to you — don’t pre-empt, participate.
🧠 “When the market sleeps in narrow ranges, it dreams of big moves.”
✏️ Disclaimer
This is just my personal viewpoint. Always consult your financial advisor before taking any action.

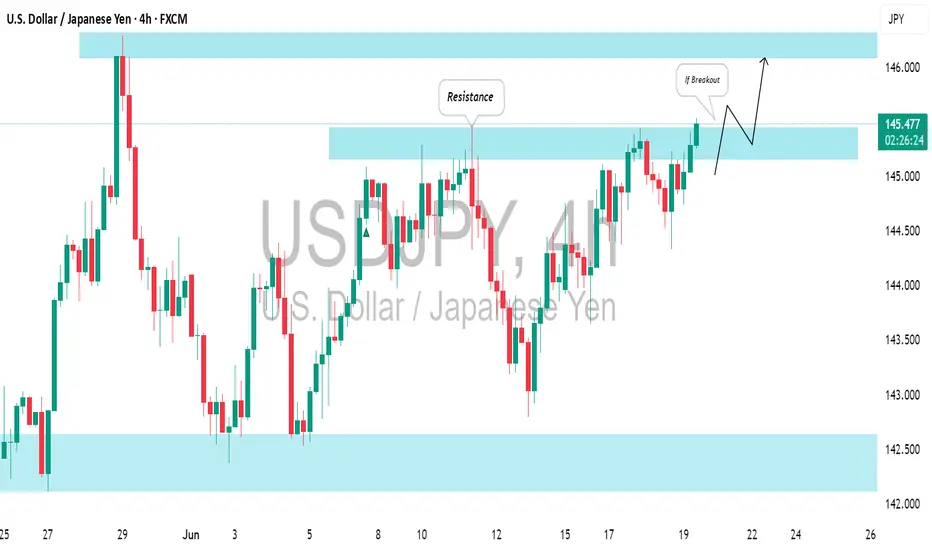
USDJPY: Waiting For a Breakout to Buy⚠️USDJPY is in a strong bullish trend on an intraday chart and is currently testing a significant horizontal resistance.
I'm looking for a breakout, specifically a 4-hour candle closing above it, to enter a buy position.
A bullish break of the highlighted blue area will provide a strong signal, potentially driving prices up to the 146.10 resistance level.
GBPCAD SHORTMarket structure bearish on HTFS DH
entry at Daily AOi
Weekly Rejection at AOi
Daily Rejection at AOi
Daily EMA retest
Previous Structure point Daily
Around Psychological Level 1.85000
H4 EMA retest
H4 Candlestick rejection
Rejection from Previous structure
Levels 3.77
Entry 95%
REMEMBER : Trading is a Game Of Probability
: Manage Your Risk
: Be Patient
: Every Moment Is Unique
: Rinse, Wash, Repeat!
: Christ is King.

GBPCHF SHORTMarket structure bearish on HTFs 3
Entry at both Weekly and Daily AOi
Weekly Rejection At AOi
Daily Rejection at AOi
Previous Structure point Daily
Around Psychological Level 1.10500
H4 EMA retest
H4 Candlestick rejection
Rejection from Previous structure
Levels 4.17
Entry 110%
REMEMBER : Trading is a Game Of Probability
: Manage Your Risk
: Be Patient
: Every Moment Is Unique
: Rinse, Wash, Repeat!
: Christ is King.

Ethereum Daily Chart = Coiled SpringSitting on the 200 EMA.
3x liquidity sweeps below — no breakdown.
Red dots stacking above = pressure cooker.
📉 Break $2.45K → dump
🚀 Break $2.7K → $3K squeeze
Big move coming. Don’t blink.

Accurately grasp the interest rate trend, today's gold layout📰 Impact of news:
1. The interest rate remains unchanged and leads to new lows in the short term
2. Geopolitical tensions provide support for risk aversion
📈 Market analysis:
I told you yesterday that 3363 is not the recent low. Today's lowest point has reached around 3347. The current day's K-line closed with a medium-sized negative line with balanced upper and lower shadows. The shape shows that gold will fluctuate in the short term and be bearish. Therefore, it is not suitable to blindly guess the bottom in the short term. As geopolitical tensions still exist, it is expected that the lowest level may reach 3330. During the day, focus on the upper resistance range of 3380-3390. If the rebound is blocked, try to intervene with short orders. The lower support is at the key level of 3330-3320. Pay attention to the defense of the support area.
🏅 Trading strategies:
BUY 3335-3325
TP 3360-3380-3390-3400
SELL 3375-3385
TP 3365-3355-3345-3300
OANDA:XAUUSD FX:XAUUSD FOREXCOM:XAUUSD FXOPEN:XAUUSD TVC:GOLD

XAUUSD EXPECTATIONS UPSIDE MOVES🔍 Key Observations:
1. Current Price: 3353
2. Previous Demand Zone / Order Block:
The area between 3347–3354 is a clear H4 order block/demand zone, which price has tapped multiple times and is currently reacting from.
3. Support Confirmation:
This zone has acted as a support multiple times in the past.
Price wicked below it but immediately pushed back above → indicating buyer interest.
4. Market Structure:
Price made a higher high near 3445.
Now it's making a retracement or pullback into the order block zone.
If this zone holds, we could see a reversal to the upside.
---
🔮 Expectations:
If 3347–3354 holds:
Expect a bounce back up toward 3375, 3400, and possibly 3440+.

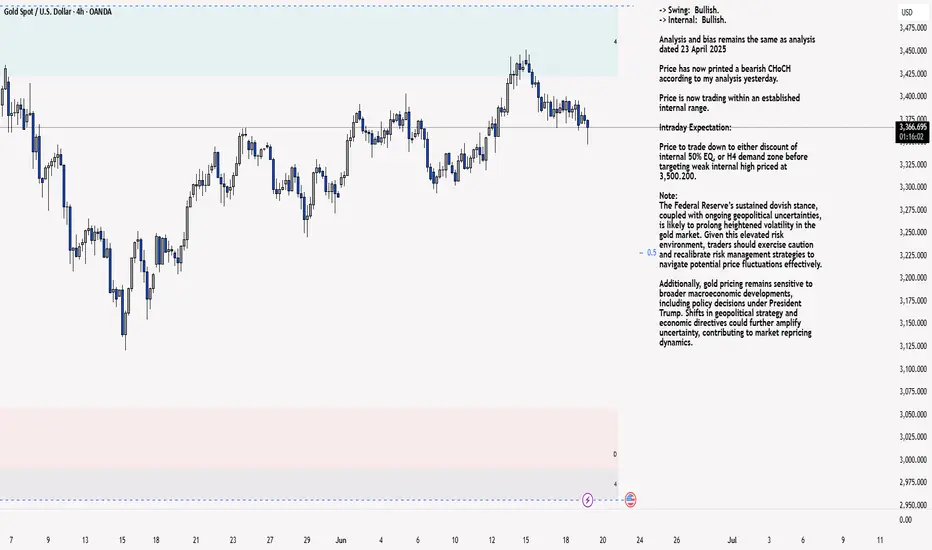
XAU/USD 19 June 2025 Intraday AnalysisH4 Analysis:
-> Swing: Bullish.
-> Internal: Bullish.
Analysis and bias remains the same as analysis dated 23 April 2025
Price has now printed a bearish CHoCH according to my analysis yesterday.
Price is now trading within an established internal range.
Intraday Expectation:
Price to trade down to either discount of internal 50% EQ, or H4 demand zone before targeting weak internal high priced at 3,500.200.
Note:
The Federal Reserve’s sustained dovish stance, coupled with ongoing geopolitical uncertainties, is likely to prolong heightened volatility in the gold market. Given this elevated risk environment, traders should exercise caution and recalibrate risk management strategies to navigate potential price fluctuations effectively.
Additionally, gold pricing remains sensitive to broader macroeconomic developments, including policy decisions under President Trump. Shifts in geopolitical strategy and economic directives could further amplify uncertainty, contributing to market repricing dynamics.
H4 Chart:
M15 Analysis:
-> Swing: Bullish.
-> Internal: Bullish.
Following previous high, and printing of bearish CHoCH, price has pulled back to an M15 supply zone, where we are currently seeing a reaction. Therefore, I shall now confirm internal high.
Price is now trading within an established internal range.
The remainder of my analysis shall remain the same as analysis dated 13 June 2025, apart from target price.
As per my analysis dated 22 May 2025 whereby I mentioned price can be seen to be reacting at discount of 50% EQ on H4 timeframe, therefore, it is a viable alternative that price could potentially print a bullish iBOS on M15 timeframe despite internal structure being bearish.
Price has printed a bullish iBOS followed by a bearish CHoCH, which indicates, but does not confirm, bearish pullback phase initiation. I will however continue to monitor, with respect to depth of pullback.
Intraday Expectation:
Price to continue bearish, react at either M15 supply zone, or discount of 50% internal EQ before targeting weak internal high priced at 3,451.375.
Note:
Gold remains highly volatile amid the Federal Reserve's continued dovish stance, persistent and escalating geopolitical uncertainties. Traders should implement robust risk management strategies and remain vigilant, as price swings may become more pronounced in this elevated volatility environment.
Additionally, President Trump’s recent tariff announcements are expected to further amplify market turbulence, potentially triggering sharp price fluctuations and whipsaws.
M15 Chart:
Nas100 target reached.I uploaded a trade idea of this yesterday and these are the results, I used proper risk management and proper execution approach!

How to trade the Fed's interest rate decision!In nearly an hour, the Fed will announce the Fed's interest rate decision and a summary of economic expectations;
In nearly an hour and a half, Powell will hold a monetary policy press conference.
If the Fed's policy statement or the latest forecast shows a dovish tendency, it may resume the downward trend of the US dollar, thereby supporting the upward trend of gold; and the recent mild inflation and weak employment data in the United States may prompt the Fed to soften its previous assessment, thereby strengthening expectations of interest rate cuts and providing support for gold prices.
From the current technical structure, gold maintains a volatile and anxious market during the day, and there is no clear direction in the short term, but gold is currently always below 3400, and the overall market is still in a weak trend; but gold has repeatedly touched the 3375-3365 area and can quickly recover, proving that there is still strong buying support below; in fact, it stands to reason that if gold is really weak, it should have continued to fall and touched the 3360-3350 area, but gold did not touch the area as expected, but used sideways trading to exchange time and space, and there was no sign of any downward breakthrough, so gold is likely to choose an upward direction.
In addition, the Middle East geopolitical crisis, global economic uncertainty, intensified trade frictions and rising inflation expectations will all provide structural support for gold. So if gold does not fall below the 3365-3355 area today, we will be bullish on gold first; but if gold cannot break through the 3410-3420 area in one fell swoop during the rise, then we need to be careful of the trend of gold rising and then falling.
As for how to trade the news next: the Federal Reserve interest rate decision. The above are my trading ideas and opinions, you can read them carefully and use them as a reference! If you still want to trade news after careful consideration, please be sure to set SL during the transaction to protect your account to the greatest extent!

ASX 200 Looks Set to BounceThe ASX 200 has drifted lower since its latest record high was set six days ago. 8500 held as support before doji formed on Tuesday to mark a false break of this key level. ASX 200 futures also tried but failed to break beneath it overnight.
Given the bullish divergence on the 1-hour RSI (14) and RSI (2), the bias is to seek dips towards 8500 for a cheeky long towards the December high.
Matt Simpson, Market Analyst at City Index and Forexc.com

Nifty Analysis EOD – June 18, 2025 – Wednesday🟢 Nifty Analysis EOD – June 18, 2025 – Wednesday 🔴
⚖️ Dhamakedar Start, But Indecisive Close – Weekly Expiry Caution Ahead
Nifty opened with a 65-point gap-down at 24,788.35, but what followed was a power-packed bullish start — within just 25 minutes, it surged over 150 points, hitting a day high of 24,947.55.
However, the euphoria didn’t last.
As the session progressed, the index gradually gave up all its gains, slipped below the previous day’s low, and finally found support at 24,750, a critical level. By the end of the day, Nifty settled around the opening zone at 24,812.05, just +23 points above open, while net change remained −41.35 points from the previous close.
The day showcased both strength and weakness — a typical "everyone-expected-fall-but-it-didn't-fall-enough" kind of day. The long upper wick reflects failed attempts by bulls, while the lack of breakdown keeps the bears in check.
Tomorrow is weekly expiry — caution is advised.
🕯 5 Min Time Frame Chart with Levels
🕯 Daily Time Frame Chart
🕯 Daily Candle Breakdown
Open: 24,788.35
High: 24,947.55
Low: 24,750.45
Close: 24,812.05
Change: −41.35 (−0.17%)
📊 Candle Structure Breakdown
Real Body: 23.70 pts → ✅ Green Candle (tiny body)
Upper Wick: 135.50 pts
Lower Wick: 37.90 pts
🔍 Interpretation
Strong bullish momentum early on, but buyers failed to hold above 24,900.
Long upper wick signals supply or profit-booking at higher levels.
Price closed near open despite wide range → indecision between bulls and bears.
🕯 Candle Type
🟨 Spinning Top – A textbook indecisive candle, often seen at turning points or during pauses in trend.
📌 Key Insight
Buyers couldn’t reclaim or close above 24,950 — resistance strengthened.
Support held at 24,750 — but barely.
Watch 24,950 on upside and 24,750 on downside — a breakout from either may decide expiry-day trend.
🛡 5 Min Intraday Chart
⚔️ Gladiator Strategy Update
ATR: 252.34
IB Range: 170.65 → Medium IB
Market Structure: ⚖️ Balanced
Trades:🚫 Short Trigger at 12:45 : Trapped - SL Hit
📌 Support & Resistance Zones
Resistance Levels
24,894 ~ 24,882
24,972 ~ 25,000
25,060 ~ 25,080
25,102 ~ 25,125
Support Levels
24,825 ~ 24,847
24,725 ~ 24,735
24,660
24,590
💭 Final Thoughts
When price travels 200 points but closes flat, it tells you something: Smart money is waiting.Weekly expiry ahead could bring unexpected moves.✅ Stay nimble. Stay alert.
🧠 “When in doubt, let the market shout — not whisper. Listen for the breakout.”
✏️ Disclaimer
This is just my personal viewpoint. Always consult your financial advisor before taking any action.

HUM: Multi-Year Support & Trendline ConfluenceAnalysis:
On the monthly timeframe, Humana (HUM) presents an intriguing long-term setup. After a significant multi-year bull run, the stock has experienced a substantial correction from its all-time highs. However, it now finds itself at a critical confluence of long-term support levels, suggesting potential for a significant bounce or a reversal of the recent downtrend.
1. Long-Term Bullish Channel:
Since the 2008 financial crisis, HUM has been trading within a remarkably well-defined bullish channel (depicted by the two green parallel lines). This channel has guided the price consistently higher for over a decade, with price action respecting both the upper and lower boundaries multiple times.
2. The "200 to 215 Key Level" - A Major Confluence Zone:
* Multi-Touch Support: The price has historically found strong buying interest in this zone, notably during the 2020 market correction and now in the present.
* Trendline Confluence: Crucially, this horizontal support zone perfectly aligns with the lower boundary of the long-term bullish channel. This dual support from both a horizontal key level and the long-term trendline creates a powerful confluence zone, making it a high-probability area for buyers to step in.
Potential Targets (Upside Scenario):
• 1st Resistance / Target $300: Should the 200−215 support hold firm, the immediate upside target for HUM is the $300 level. This zone previously acted as a minor pivot point, where price saw both support and resistance. A break above $300 would confirm bullish momentum.
• Long-Term Target $380 to $400: Beyond the initial 300 target, the next significant long−term target is the∗∗300target, the next significant long−term target is 380 - $400 range. This area previously served as strong support after the initial peak in late 2021/early 2022 before the major breakdown. Reclaiming this zone would signify a substantial recovery and a potential return to previous highs.
• Invalidation & Risk Management:
While the setup appears compelling, it is crucial to consider the downside risk. A decisive monthly close below the $200 level would invalidate this bullish thesis. Such a breakdown would suggest a failure of the long-term trend channel and could lead to further downside, potentially towards the 150−175 region. Traders should monitor price action for confirmation of support and manage their risk accordingly.
Conclusion:
Given the strong historical significance and the powerful confluence of technical indicators at the
200−215 level, Humana (HUM) presents a compelling long-term buy-the-dip opportunity for those looking for a potential reversal and recovery. Patience and confirmation of support at this key level will be paramount.
Disclaimer:
The information provided in this chart is for educational and informational purposes only and should not be considered as investment advice. Trading and investing involve substantial risk and are not suitable for every investor. You should carefully consider your financial situation and consult with a financial advisor before making any investment decisions. The creator of this chart does not guarantee any specific outcome or profit and is not responsible for any losses incurred as a result of using this information. Past performance is not indicative of future results. Use this information at your own risk. This chart has been created for my own improvement in Trading and Investment Analysis. Please do your own analysis before any investments.

The interest rate remains volatile,and the gold operation layout📰 Impact of news:
1. Initial jobless claims data
2. US-Iran conflict continues
3. Pay attention to the Fed's decision
📈 Market analysis:
Gold has been trading sideways recently. It is expected that there will not be much fluctuation before today's Fed interest rate information and Powell's speech. It is expected to continue to fluctuate in the range of 3405-3365. At the same time, the escalation of geopolitical conflicts in the short term is also a point we need to pay attention to.
🏅 Trading strategies:
BUY 3380-3375-3365-3355
TP 3395-3400-3405
SELL 3405-3395
TP 3380-3375-3360
If you agree with this view, or have a better idea, please leave a message in the comment area. I look forward to hearing different voices.
TVC:GOLD FXOPEN:XAUUSD FOREXCOM:XAUUSD FX:XAUUSD OANDA:XAUUSD

Wide range fluctuations continue, the latest layout of gold📰 Impact of news:
1. Initial jobless claims data
2. US-Iran conflict continues
3. Pay attention to the Fed's decision
📈 Market analysis:
At present, the gold price is testing the 3380 line again, and the strong support below is 3365-3355. As long as it does not fall below this key support, the bulls will remain strong. At the same time, the two key points of 3405 and 3420 above are still short-term resistance. Breaking through may directly test 3450. In the short term, gold fluctuates repeatedly at the 3405-3365 level, temporarily maintaining a high-altitude low-multiple cycle. There is also initial jobless claims data released today. At the same time, the geopolitical situation in the short term is severe, so we need to be cautious. In addition, the New York Stock Exchange will be closed tomorrow. The focus this week is mainly on Friday, especially when it is superimposed with the Fed's interest rate decision, we need to be vigilant about the transmission effect of sudden changes in liquidity on the market.
🏅 Trading strategies:
BUY 3380-3365-3355
TP 33395-3400-3405
SELL 3405-3390
TP 3380-3360
If you agree with this view, or have a better idea, please leave a message in the comment area. I look forward to hearing different voices.
OANDA:XAUUSD FX:XAUUSD FOREXCOM:XAUUSD FXOPEN:XAUUSD TVC:GOLD

Stick to shorting goldGold is currently fluctuating in a narrow range of 3380-3385, and the trend is relatively slow. We also need more patience. In comparison, I think the current short-selling force has a slight upper hand, because gold has shown signs of accelerating decline after a difficult rebound many times, and has fallen below 3380 many times. According to the current gold structure, gold does not have sufficient room for decline, and it is still possible to continue to fall to the 3365-3355 area.
It is expected that gold will not fluctuate too much before the Fed's interest rate decision and Powell's monetary policy press conference. For this interest rate decision, I think the possibility of a rate cut is not great, and the current interest rate may still remain unchanged. The reduction in the expectation of a rate cut may stimulate a wave of gold declines in the short term. So in the short term, I still prefer a short trade in gold. Obviously, gold is currently under pressure in the 3395-3405 area, so we can still try to short gold in this area.

Short trade
📍 Pair: CADJPY
📅 Date: Tuesday, June 17, 2025
🕒 Time: 3:00 PM (NY Session PM)
⏱ Time Frame: 1 Hour
📈 Direction: Sell-side
📊 Trade Breakdown:
Entry Price 106.484
Profit Level 106.029 (0.43%)
Stop Loss 106.603 (0.11%)
Risk-Reward Ratio 3.82
🧠 Context / Trade Notes:
1H Structure-Based Entry:
Trade was observed on the 1-hour chart, and sell-side trade was undertaken due to a clear bearish market structure in play.

Long trade
📍 Pair: GBPUSD
📅 Date: Tuesday, June 17, 2025
🕒 Time: 3:00 PM (NY Session PM)
⏱ Time Frame: 1 Hour
📈 Direction: Buyside
📊 Trade Breakdown:
Entry Price 1.34293
Profit Level 1.35653 (+1.01%)
Stop Loss 1.34086 (−0.15%)
Risk-Reward
Ratio 6.57 : 1
🧠 Context / Trade Notes:
Higher Timeframe Confluence:
Trade took off a 1-hour bullish order block following consistent higher highs and higher lows.
Choch + BOS Confirmed:
Clear change of character and break of structure gave the green light for a continuation long.

Seize the opportunity to short gold after the reboundBecause gold fell back to the expected support area of 3375-3365 first, I just took the opportunity to go long on gold near 3372 and set TP: 3390. Obviously, our long position ended the transaction by hitting TP, and we made a profit of 180pips.
At present, gold continues to rebound to around 3396, and is facing the short-term resistance area of 3395-3405, and the upside may be limited. And I think before the Fed's interest rate decision and Powell's monetary policy conference, gold is likely to maintain a range of fluctuations, and the willingness of both long and short parties to break through may not be strong in the short term. And from the current structure, gold tends to fluctuate downward as a whole.
So for short-term trading, we might as well try to short gold in the resistance area. I think it is still very likely to retreat to at least the 3385-3380 area.

GBPCHF: Another Nice Setup to Sell📉GBPCHF could continue to decline after testing a significant daily resistance level.
As a confirmation signal, I spotted a head and shoulders pattern
on that on an hourly time frame.
The price may drop to at least 1.0971, followed by 1.0939 support.
