Tend to short gold, it may still retrace to 3360-3350 areaAt present, gold as a whole is still fluctuating in the 3395-3365 area. In the short term, both long and short sides are not willing to break through. They may be waiting for the guidance of the Fed's interest rate decision and Powell's monetary policy press conference. However, from the current oscillation structure, because the high point of gold rebound and the low point of retracement are gradually moving downward, the center of gravity of the candlestick chart is shifting downward, and the weight of gold shorts is slightly higher.
From the current structure, 3395-3405 has become a new round of pressure area. Gold has been unable to break through for a long time, and has tried to accelerate downward many times during the retracement process. Although it can stabilize above 3375-3365, it may be easier to break through below after several tests. Once the 3375-3365 area is broken, gold may even continue to move to the 3360-3350 area.
Therefore, within the 3395-3365 oscillation range, we can temporarily maintain the trading rhythm of selling high and buying low in the short term, while we must pay attention to the breakthrough of gold. Once gold breaks through, the trend may be continued, and we need to follow the trend to execute transactions!
Candlestick Analysis

USD/CAD: Signs of a bottom as bulls fight backTuesday’s bullish move in USD/CAD has delivered a signal often seen at bottoms, taking out several key technical resistance levels in the process, including the December 2023 uptrend. With bearish momentum starting to reverse, upside risks look to be building.
Those in the market for a long setup could initiate positions around these levels with a stop beneath 1.3650 for protection. Tuesday’s high of 1.3693 now stands as an important near-term level. A break above opens the door to the June 10 high at 1.3728 as one potential target, along with 1.3750.
If either level is hit, reevaluate whether to hold, cut or reverse, given the setup runs counter to the broader trend.
Good luck!
DS

GBPUSD Wave Analysis – 17 June 2025- GBPUSD reversed from the resistance level 1.3615
- Likely to fall to support level at 1.3400
GBPUSD currency pair recently reversed down from the key resistance level 1.3615 (which has been reversing the price from the end of May) and the upper daily Bollinger Band.
The downward reversal from the resistance level 1.3615 formed the daily Japanese candlesticks reversal pattern Dark Cloud Cover – which was followed by the Shooting Star.
Given the bearish divergence on the daily Stochastic indicator, GBPUSD currency pair can be expected to fall to the next support level at 1.3400 (former resistance from April).

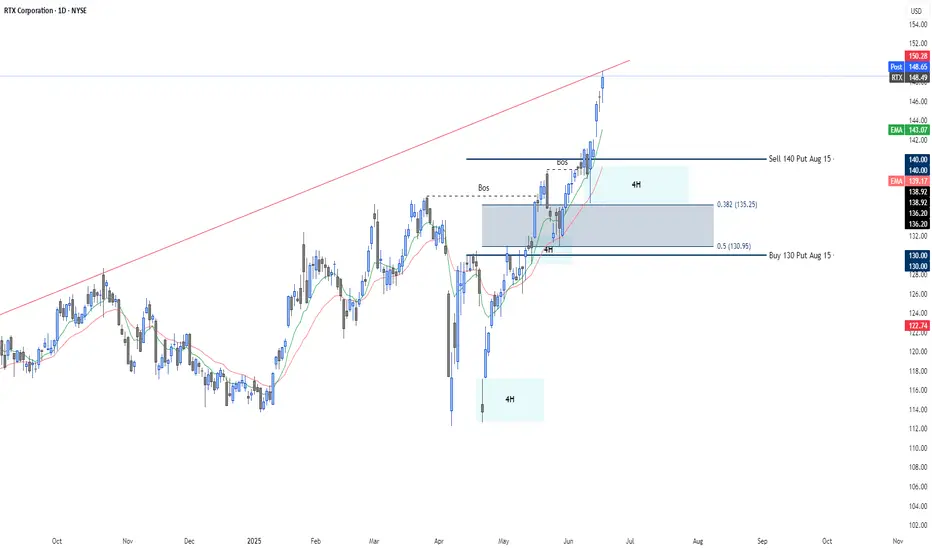
RTX – Defense sector strength backed by structurePut Credit Spread Aug 140/130 | Entry: -1.81 | POP 76%
🚀 Technical & Macro Context:
Raytheon Technologies (RTX) is surging amid escalating geopolitical tensions (Iran–Israel conflict) and renewed strength in defense sector fundamentals. The stock has broken multiple resistance levels and is now trading in a parabolic move within a widening bullish channel.
📌 Technically backed setup:
✅ Clear Break of Structure (BoS) confirmed and respected.
🧱 Strong 4H demand zone between $135.25–$130.95.
📉 RSI trending high but not overheated.
📈 MACD remains bullish with wide separation.
This zone aligns with:
Dynamic support (EMA20).
38–50% Fibonacci retracement.
Previous consolidation zone now acting as demand.
🔒 Spread Structure:
Sell Put $140 (Aug 15)
Buy Put $130 (Aug 15)
Probability of Profit (POP): 76%
📉 Invalidation below $130 with volume. Will reassess if demand fails.
📷 The chart already illustrates the setup with institutional logic, break levels, and supply/demand zones.
🔍 If you enjoy structured option setups, technicals with context, and high-probability spreads,
👉 Follow me for more trade ideas like this.
📈 Weekly updates | 🎯 Conviction trades | 🧠 Smart risk-reward
Gold is weak, and there may be a low point yet to come!According to the current structure, gold is obviously in a weak position. Gold has failed to break through the high point of the previous wave after multiple rebounds during the day. 3400 has become a new round of pressure area; and gold has just accelerated its decline and fell below 3370. For the current trend, falling below 3370 will weaken the bullish sentiment to a certain extent and indicate that there is further room for decline, so I think gold should have a low point, and the low point we should first pay attention to is in the range of 3365-3355.
So in terms of short-term trading,
First, we can try to short gold with the short-term resistance area of 3395-3405;
But if gold first retreats to the support area of 3365-3355, we can first choose to go long on gold.

NZDUSD SHORTMarket structure bearish on HTFs DW
Entry at both Weekly and Daily AOi
Weekly Rejection At AOi
Daily Rejection at AOi
Previous Structure point Daily
Around Psychological Level 0.59500
H4 EMA retest
H4 Candlestick rejection
Rejection from Previous structure
Levels 4.48
Entry 100%
REMEMBER : Trading is a Game Of Probability
: Manage Your Risk
: Be Patient
: Every Moment Is Unique
: Rinse, Wash, Repeat!
: Christ is King.

Falling below 3380,testing 3365,the low position remains bullish📰 Impact of news:
1. Geopolitical tensions in the Middle East
2. Iran nuclear talks
3. Retail sales data
📈 Market analysis:
After rebounding to the 3400 line, gold encountered resistance and fell back to test the support level of 3380. Although it was very close to the point of 3405 we gave, I did not enter the trade because gold has been in the middle section in the short term and has not rebounded to the ideal point.
There are too many long orders at high levels in gold. The international situation is so tense that gold is still slowly declining, but the geopolitical situation is still continuing. In addition, the retail sales data is bullish. Then, as the trading strategy given at noon, it is expected to test the short-term support of 3365-3355 below. I will consider going long in this range
🏅 Trading strategies:
BUY 3365-3355
TP 3380-3390-3400
If you agree with this view, or have a better idea, please leave a message in the comment area. I look forward to hearing different voices.
TVC:GOLD FXOPEN:XAUUSD FOREXCOM:XAUUSD FX:XAUUSD OANDA:XAUUSD

Why I Think GBPUSD Will Sell...Technical AnalysisHey Rich Friends,
I hope you're well today. I wanted to share why I think GBPUSD will sell today and maybe more this week. This is only my technical analysis so make sure you check the news and cross reference the indicators you have on your chart. This is what I am looking at:
- The market hit a swing high on 4H and has been creating lower highs.
- The momentum is picking up for the sellers based on candle bodies.
- The stochastic is facing down, the slow line (orange) is on top of the fast line (blue) and both lines have crossed below 50. These are bearish confirmations for me.
Additional information:
- Wait for the stochastic to cross below 20.
- Wait for a break of structure below 1.35320.
- I will be setting sell stops so that my trades trigger on the way down. I will set previous highs as my SL and previous lows as my TPs.
Good luck if you decide to take this trade!
Peace and Profits,
Cha

SILVER (XAGUSD): One More Buying Opportunity📈SILVER is currently experiencing a strong bullish trend on the daily chart.
Since the end of last week, it has been consolidating within a horizontal range on a 4-hour time frame.
Today's bullish movement has successfully broken above the resistance of this range, confirming buyer strength and suggesting a likely continuation of the upward trend.
The next target is 38.00.

Nifty Analysis EOD – June 17, 2025 – Tuesday🟢 Nifty Analysis EOD – June 17, 2025 – Tuesday 🔴
⚠️ Resistance Rejection at 25K – Pause or Warning Sign?
Yesterday’s note rightly anticipated today’s challenge near 25K — and that’s exactly how the session unfolded.
Nifty opened at 24,977.85, right inside the critical resistance zone of 24,972–25,000, and formed a near O=H (Open = High) structure. The index quickly lost ground, dropping 135 points within the first hour to mark a day low of 24,813.70, forming a medium-sized Initial Balance (IB) within a wide CPR — conditions known for range-bound or tricky days.
Throughout the session, Nifty hovered largely inside the CPR and IB, with a false breakdown attempt around 12:50 PM. Such setups (wide CPR + higher value + medium IB) often result in false moves or low-conviction sessions, and today was no exception.
By day’s end, Nifty closed at 24,853.40, logging a modest −93.10 point dip, forming what can be termed as a healthy pullback — but the real test remains.
If bulls want to take charge again, they must breach and close above 25,025. On the flip side, if 24,800–24,820 gives way, it could trigger a slide toward 24,725 and 24,660 in the coming sessions.
🕯 Daily Time Frame Chart
🕯 Daily Candle Breakdown
Open: 24,977.85
High: 24,982.05
Low: 24,813.70
Close: 24,853.40
Change: −93.10 (−0.37%)
📊 Candle Structure Breakdown
Real Body: 124.45 pts → 🔻 Red Candle
Upper Wick: 4.20 pts
Lower Wick: 39.70 pts
🔍 Interpretation
Opened near the day’s high but selling dominated soon after.
Small upper wick shows minimal buyer strength; recovery attempts were mild.
Lower wick indicates some support emerged at day’s low, but overall tone remained bearish.
🕯 Candle Type
🟥 Bearish Candle – strong real body, minor lower wick — reflects steady intraday selling, though not overly aggressive.
📌 Key Insight
Nifty has now rejected the 25K zone two days in a row, turning it into short-term resistance.
If 24,800 breaks, expect pressure to mount — next watch: 24,725 → 24,660.
Bulls need a close above 25,025 to regain command.
🛡 5 Min Intraday Chart
⚔️ Gladiator Strategy Update
ATR: 258.48
IB Range: 131.60 → Medium IB
Market Structure: ⚖️ Balanced
Trades:🚫 No Trade Triggered by System
📌 Support & Resistance Zones
Resistance Levels
24,894 ~ 24,882
24,972 ~ 25,000
25,060 ~ 25,080
25,102 ~ 25,125
Support Levels
24,825 ~ 24,847
24,725 ~ 24,735
24,660
24,590
💭 Final Thoughts
Today’s session didn’t break anything major — but it also didn’t conquer anything new.Stuck between major support and resistance, the index is coiling for a move. Bulls have the burden of proof now.
🧠 “Markets don’t pause forever — compression leads to expansion. Be ready when it chooses its direction.”
✏️ Disclaimer
This is just my personal viewpoint. Always consult your financial advisor before taking any action.

Continue to try to short gold,It's expected to touch 3355-3345 Gold has broken through 3380 twice, but recovered quickly, indicating that the bulls still have some defensive power. At present, gold has touched 3400 again; it can be seen that the bulls' potential defense is still good, but it is not enough to support the continued rebound of gold in the short term. Obviously, gold is still under pressure in the 3410-3420 area in the short term. If gold cannot break through this resistance area in the short term, gold may continue to maintain a volatile state and continue to seek strong support downward. Only after gold breaks through the 3410-3420 area, it is expected to continue to rise and touch the area near 3450 again.
When gold tested the support near 3380 several times during the day and tried to break through this area, after gold failed to break through the 3410-3420 area in the short term, I think gold will be more likely to choose a downward direction, or even continue to test the 3355-3345 area. Therefore, for short-term trading, before breaking through the 3410-3420 area, we should not chase gold too much, and we can try to short gold in this area appropriately.

GBPCHF: Bearish Movement After Breakout📉GBPCHF appears to be bearish following a breakout of a significant daily support level.
After retesting this broken structure, the pair formed an inverted cup and handle pattern, and we are now seeing the test of the broken neckline.
A downward movement towards 1.1006 is anticipated.

Resistance zones and Geo-political instability acting up.Geo-Political instability and resistance zone are acting up together to stop Nifty and not allowing it to close above 25K. As the world is looking at developments in Iran Vs Israel conflict with beated heart market today gave up some gains from yesterday. The only index looking strong is IT index right now. Avoid taking very long positions unless you are very sure of the company. Yesterday also Nifty failed to close above 25K opened briefly near 25K today and then moved downwards. Lot will be decided in the short term by the developments that happen tonight. Important G7 meet and US Federal reserve Rate Cut meet is also to happen later in the week. These 2 global factors will decide fate of the market in the short term. Local factors are all in line and nothing to worry for Indian markets on that front.
The supports for Nifty remain at: 24713 (Trend line support), 24425 (Mother line support of Daily chart), next support is near 23917, 23806 (Father line support of daily chart is in place). Closing below 23906 can lead to further down side and in such a scenario Nifty can fall further towards 23500 or 23047 levels. If we get a closing below that we will give updates regarding the same.
Resistances for Nifty remain at: 24982 (Today's high), 25112 and trend line resistance of 25251. When we get a closing above 25251 we will update you regarding the further upward resistnace levels.
Disclaimer: The above information is provided for educational purpose, analysis and paper trading only. Please don't treat this as a buy or sell recommendation for the stock or index. The Techno-Funda analysis is based on data that is more than 3 months old. Supports and Resistances are determined by historic past peaks and Valley in the chart. Many other indicators and patterns like EMA, RSI, MACD, Volumes, Fibonacci, parallel channel etc. use historic data which is 3 months or older cyclical points. There is no guarantee they will work in future as markets are highly volatile and swings in prices are also due to macro and micro factors based on actions taken by the company as well as region and global events. Equity investment is subject to risks. I or my clients or family members might have positions in the stocks that we mention in our educational posts. We will not be responsible for any Profit or loss that may occur due to any financial decision taken based on any data provided in this message. Do consult your investment advisor before taking any financial decisions. Stop losses should be an important part of any investment in equity.

USDT Dominance SHOWDOWN INCOMINGAfter a full liquidity sweep at 4.50%, USDT.D is now pressing into the EMA cluster from below…
📊 What does that mean?
➡️ Stablecoin dominance is rising = risk-off behavior creeping in
➡️ But we’re STILL under trend — and that green dot sweep could mean a fakeout bottom
🧠 If USDT.D breaks above EMAs → altcoins bleed
🔥 If USDT.D gets rejected here → altcoins pump hard
This is the pivot. Watch closely.

Forward-looking trading, focus on 3380 support📰 Impact of news:
1. Geopolitical tensions in the Middle East
2. Iran nuclear talks
3. Retail sales data
📈 Market analysis:
Gold prices are currently in a narrow range of fluctuations again, and the signal of Iran restarting nuclear negotiations has weakened risk aversion, triggering a correction in gold prices during the session, but tensions in the Middle East remain an uncertain factor. In the short term, we still need to focus on the breakthrough of the 3380 support line. If the 3380 support line is strong, we can still maintain a long trading idea in the short term and look to 3400. On the contrary, once it falls below, it is expected to look to the 3350 line. Pay attention to the breakthrough of 3400 on the upside. If the Asian and European sessions cannot effectively break through this short-term resistance, gold will continue to fluctuate.
🏅 Trading strategies:
BUY 3380-3370
TP 3390-3400-3450
SELL 3400-3390
TP 3380-3370-3350
If you agree with this view, or have a better idea, please leave a message in the comment area. I look forward to hearing different voices.
OANDA:XAUUSD FX:XAUUSD FOREXCOM:XAUUSD FXOPEN:XAUUSD TVC:GOLD

GOLD (XAUUSD): Your Trading Plan Explained⚠️GOLD is currently at a crucial daily horizontal support level.
It is consolidating within a horizontal range on the 4-hour chart, showing a positive bullish reaction and testing the range's resistance.
A breakout above this resistance with a 4-hour candle close would signal strong bullish momentum, potentially leading to further gains, with the next target at 3437.
Conversely, a bearish breakout below the support could initiate a downward movement.

USD/ CAD Trade plan ???From the chart level you can plan sell if price come to our selling area . then after 5min coch or 15 min red candle

AUDCAD: Pullback From Resistance Confirmed 🇦🇺🇨🇦
AUDCAD is going to retrace from a key intraday horizontal resistance.
A local bearish CHoCH and an imbalance on an hourly time frame
provide a strong bearish confirmation.
Goal - 0.88445
❤️Please, support my work with like, thank you!❤️
I am part of Trade Nation's Influencer program and receive a monthly fee for using their TradingView charts in my analysis.


intraday-swing buy continuationlarge specs are long chf
bullish structure
irl-erl liquidity target
POI: ob


Short gold, it needs to retreat to the area around 3350!Gold is currently testing the support near 3380 again. According to the current trend of gold, gold is likely to break through 3380, and gold has stopped near 3400 many times during the rebound process, and the rebound strength of gold is lacking. If gold really wants to rebound, then after testing near 3380 many times and getting support at 3390, it should have rebounded to the 3410-3420 area, but it is obvious that gold has not yet touched the 3410-3420 area. Therefore, gold's performance is relatively weak and its correction trend should continue for now.
In terms of fundamentals, Iran is not decisive in its retaliatory behavior, so if the conflict in the Middle East does not escalate, gold may find it difficult to continue to rise. So according to the current trend and performance of gold, we should not be stubborn in long gold trading for the time being, and adjust our trading plan reasonably according to the market and price behavior. If gold continues to retreat, the first thing we need to pay attention to below is the 3355-3345 area, followed by the area near 3330. So for the next short-term trading, we can try to short gold in the 3395-3405 area.

XAU/USD 17 June 2025 Intraday AnalysisH4 Analysis:
-> Swing: Bullish.
-> Internal: Bullish.
Analysis and bias remains the same as analysis dated 23 April 2025
Price has now printed a bearish CHoCH according to my analysis yesterday.
Price is now trading within an established internal range.
Intraday Expectation:
Price to trade down to either discount of internal 50% EQ, or H4 demand zone before targeting weak internal high priced at 3,500.200.
Note:
The Federal Reserve’s sustained dovish stance, coupled with ongoing geopolitical uncertainties, is likely to prolong heightened volatility in the gold market. Given this elevated risk environment, traders should exercise caution and recalibrate risk management strategies to navigate potential price fluctuations effectively.
Additionally, gold pricing remains sensitive to broader macroeconomic developments, including policy decisions under President Trump. Shifts in geopolitical strategy and economic directives could further amplify uncertainty, contributing to market repricing dynamics.
H4 Chart:
M15 Analysis:
-> Swing: Bullish.
-> Internal: Bullish.
Following previous high, and printing of bearish CHoCH, price has pulled back to an M15 supply zone, where we are currently seeing a reaction. Therefore, I shall now confirm internal high.
Price is now trading within an established internal range.
The remainder of my analysis shall remain the same as analysis dated 13 June 2025, apart from target price.
As per my analysis dated 22 May 2025 whereby I mentioned price can be seen to be reacting at discount of 50% EQ on H4 timeframe, therefore, it is a viable alternative that price could potentially print a bullish iBOS on M15 timeframe despite internal structure being bearish.
Price has printed a bullish iBOS followed by a bearish CHoCH, which indicates, but does not confirm, bearish pullback phase initiation. I will however continue to monitor, with respect to depth of pullback.
Intraday Expectation:
Price to continue bearish, react at either M15 supply zone, or discount of 50% internal EQ before targeting weak internal high priced at 3,451.375.
Note:
Gold remains highly volatile amid the Federal Reserve's continued dovish stance, persistent and escalating geopolitical uncertainties. Traders should implement robust risk management strategies and remain vigilant, as price swings may become more pronounced in this elevated volatility environment.
Additionally, President Trump’s recent tariff announcements are expected to further amplify market turbulence, potentially triggering sharp price fluctuations and whipsaws.
M15 Chart:
