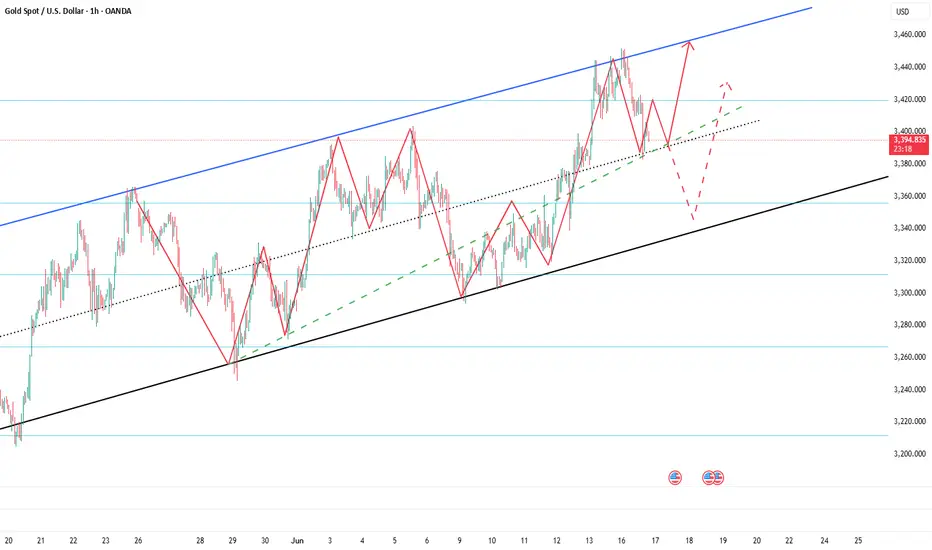
Gold is expected to hit 3410-3420 againBecause of the news that Iran hopes to ease the hostile relationship with Israel, gold fell sharply in the short term, then rebounded after touching 3383, and quickly recovered above 3390. From this point of view, the buying support below is strong, and the market sentiment is still high, which limits the downside of gold, and the support of 3390-3380 area is still valid.
Although the bullish momentum of gold has weakened relatively due to the retracement in the short term, as long as gold remains above 3380, it still maintains a strong upward structure; and the retracement only exacerbates the short-term shock trend. Gold is still likely to maintain a shock upward structure and try to touch the 3410-3420 area again. Once gold breaks through 3420 strongly, it is expected to hit the area near 3450 again.
So for short-term trading, I still hold a long position in gold, and there is still a certain profit now. I have to say that if gold can reach the 3410-3420 area as expected, our profits will increase significantly!
Candlestick Analysis
AUD/JPY Bulls Eye 95+ After Bullish ReversalAUD/JPY bounced sharply on Thursday, snapping a 3-day losing streak with a solid bullish-range session. The rally kicked off from a bullish pinbar above 92, where the higher low reinforces support and the broader bullish case.
The 1-hour chart shows a clean breakout from an inverted head and shoulders pattern, pointing to a target around 95.50. With resistance at the April high (95.30), March high (95.75), and the 96 handle, there’s still room for bulls to run.
Dips toward 94 may offer opportunities to join the trend — but a break back below the neckline would shift the tone back to risk-off.
Matt Simpson, Market Analyst at City Index and Forex.com

EURJPY ANALYSISFrom the previous trading day we see that the pair closed bullish and the 4hr and 1hr making HH and HL, which are confirmation of a bullish trend type move.

GBPUSD ANALYSIS After seeing how the previous daily candle close bullish and the 4hr structure make a retracement to a key level of 1.35626, we could be looking for another push leg up to make a new HH on the 4hr but waiting for confirmation on the daily timeframe.

USDJPY Wave Analysis – 16 June 2025
- USDJPY reversed from the support zone
- Likely to rise to the resistance level 146.00
USDJPY currency pair recently reversed from the support zone surrounding the pivotal support level 142.50, which has been reversing the price from the start of August.
The upward reversal from the support level 142.50 created the daily Japanese candlesticks reversal pattern Piercing Line.
USDJPY currency pair can be expected to rise to the next resistance level 146.00 (top of the previous correction 2 from last month).

3400 3380 are the two points that determine the trend of gold📰 Impact of news:
1. Geopolitical risks
2. Expected Fed policy
📈 Market analysis:
This week, the Federal Reserve's policy meeting, retail sales data, initial jobless claims and geopolitical situation will be the core factors affecting global markets. In the short term, gold rebounded after hitting the 3383 line. This round of decline was relatively rapid. At the same time, there is a certain resistance at the 3405-3410 line above in the short term, which is also the main reason for our long orders to leave the market. In the short term, it is recommended to first look at the support situation at the 3380 line below, and then enter the long order after obtaining effective support above this position. On the contrary, if it falls below this short-term support, the gold price is expected to fall to the 3350 mark! For the evening layout, it is recommended to focus on the 3400 long-short watershed, pay attention to the 3410 line of resistance, and pay attention to the 3380 line of support below.
🏅 Trading strategies:
BUY 3390-3380
TP 3400-3410-3420
SELL 3400-3390
TP 3380-3360-3350
If you agree with this view, or have a better idea, please leave a message in the comment area. I look forward to hearing different voices.
TVC:GOLD FXOPEN:XAUUSD FOREXCOM:XAUUSD FX:XAUUSD OANDA:XAUUSD

Silver Swing plan trade .???if price come to this level then you can plan trade by 15 min candlestick confirm like( Engulfing, evening star, etc) or buy after 5min Coch

Gold bulls may restart at any time, buy gold!Although compared with the performance of gold during the day, gold only touched 3452 and then began to retreat, and even failed to approach the previous high of 3500, gold is not strong; but based on the current fundamentals and technical structure, gold is currently in a very strong bullish structure; so I think the gold retracement is not a sign of gold weakness, but to increase liquidity, so that gold can rise better and prepare in advance for breaking through 3500! Gold bulls are ready to restart at any time after the retracement!
So for short-term trading, I don’t think the gold retracement is a reason for weakness, nor is it a certificate for chasing short gold; on the contrary, I think the gold retracement is a good time to buy on dips; first of all, the support area we have to pay attention to is the 3410-3400 area, and the second must pay attention to the 3390-3380 area support.
So in the next transaction, we might as well use these two support areas as defense and start to go long on gold in batches!

Long trade
🟢 GBPUSD – Buyside Trade
Date: Monday, 16th June 2025
Session: London Session AM
Time: 5:00 AM
Entry Timeframe: 1Hr TF
Trade Parameters
Entry: 1.35864
Take Profit: 1.36168 (+0.22%)
Stop Loss: 1.35664 (−0.15%)
Risk-Reward Ratio (RR): 1.5
🧠 Trade Reasoning
This GBPUSD buyside trade was structured around an early London session setup, targeting a short-term liquidity gap above. Price had formed a bullish 1Hr structure, establishing a higher low.

Long trade
🟢 EURUSD – Buyside Trade
Date: Monday, 16th June 2025
Session: London Session AM
Time: 5:00 AM
Entry Timeframe: 1Hr TF
Trade Parameters
Entry: 1.15748
Take Profit: 1.16144 (+0.34%)
Stop Loss: 1.15581 (−0.15%)
Risk-Reward Ratio (RR): 2.29
🧠 Trade Reasoning
This buyside trade was executed after price swept the sell-side high from Monday, 21st April 2025, triggering liquidity above the previous swing, and then sharply rejecting back into structure. The reaction occurred above a 1Hr Fair Value Gap (FVG), indicative of a directional bias.

Long trade
4Hr TF
🟢 AUDUSD – Buyside Trade
Date: Monday, 16th June 2025
Session: London Session AM
Time: 5:00 AM
Entry Timeframe: 4Hr TF
Trade Parameters
Entry: 0.65169
Take Profit: 0.65427 (+0.40%)
Stop Loss: 0.65087 (−0.13%)
Risk-Reward Ratio (RR): 3.15
🧠 Trade Reasoning
This AUDUSD buyside trade was executed on the 4-hour timeframe following a bullish rejection wick and confirmation of a mid-range bounce within a larger consolidation phase.

Long trade
1Hr TF
🟢 NZDUSD – Buyside Trade
Date: Monday, 16th June 2025
Session: London Session AM
Time: 5:00 AM
Entry Timeframe: 1Hr TF
Trade Parameters
Entry: 0.60429
Take Profit: 0.60684 (+0.42%)
Stop Loss: 0.60347 (−0.13%)
Risk-Reward Ratio (RR): 3.23
🧠 Trade Reasoning
The trade was initiated on a 1-hour bullish continuation setup, with price finding firm support around the 0.60350 level — a previously swept liquidity zone and minor structural demand.

Solid V Shaped recovery within the Parallel channel for NiftyNifty recovered sharply within the parallel channel. The reasons that can be attributed are inherent strength in the Indian market and swift recovery in IT, Infra, Metal, commodities, Realty, Mid and Small cap browsers. The closing of Nifty was at 24946 which is just above the mother line which is at 24908. The same mother line provided the support to Nifty in the last few hours of trade when there was some intraday profit booking pressure.
Nifty Supports remain at: 24908 (Mother line Support), 24836, 24690 (Father Line Support), 24555 (Channel Bottom Support) and 24480 recent low. Below 24880 Nifty will be very weak and Bears in that scenario can drag Nifty further down to 24195 or 23957. These are the levels as of now. If we go below these levels in unlikely circumstances we will update the levels once we get there.
Nifty Resistances remain at: 24973, 25106 (Mid Channel Resistance) and 25231.Once we close above 25231 we will update further levels.
Disclaimer: The above information is provided for educational purpose, analysis and paper trading only. Please don't treat this as a buy or sell recommendation for the stock or index. The Techno-Funda analysis is based on data that is more than 3 months old. Supports and Resistances are determined by historic past peaks and Valley in the chart. Many other indicators and patterns like EMA, RSI, MACD, Volumes, Fibonacci, parallel channel etc. use historic data which is 3 months or older cyclical points. There is no guarantee they will work in future as markets are highly volatile and swings in prices are also due to macro and micro factors based on actions taken by the company as well as region and global events. Equity investment is subject to risks. I or my clients or family members might have positions in the stocks that we mention in our educational posts. We will not be responsible for any Profit or loss that may occur due to any financial decision taken based on any data provided in this message. Do consult your investment advisor before taking any financial decisions. Stop losses should be an important part of any investment in equity.

Nifty Analysis EOD – June 16, 2025 – Monday🟢 Nifty Analysis EOD – June 16, 2025 – Monday 🔴
📈 Expected Follow-Through Plays Out – Bulls Eye 25K Hurdle Next
Nifty opened flat-to-positive at 24,737, briefly dipped to the day’s low of 24,703.60, and then reversed smartly to touch an intraday high of 24,967.10 by 13:40. After that, the index spent the rest of the day consolidating in a narrow 40-point band and closed at 24,940.95 intraday (adjusted close: 24,946.50), delivering a solid +227.90 point gain.
As anticipated, the 24,768–24,800 support zone provided the launchpad for further upside, confirming the bullish follow-up from Friday's recovery. The rally tested 24,967, just shy of the crucial resistance at 24,972, which remains a key watch for the next session.
🔍 However, going forward, the bulls face major challenges around 25,000–25,080. This zone has acted as a hurdle in the past and could either stall the rally or serve as a breakout trigger. Watch price behavior carefully around these levels to assess conviction.
🛡 5 Min Chart with Levels
🕯 Daily Time Frame Chart
🕯 Daily Candle Breakdown
Open: 24,732.35
High: 24,967.10
Low: 24,703.60
Close: 24,946.50
Change: +227.90 (+0.92%)
📊 Candle Structure Breakdown
Real Body: 214.15 pts → 🟢 Strong Green Candle
Upper Wick: 20.60 pts
Lower Wick: 28.75 pts
🔍 Interpretation
Opened near day’s low, closed near day’s high — classic bullish sentiment.
Small wicks show controlled buying with minimal resistance and shakeouts.
Reinforces the bulls’ momentum after Friday’s OL recovery candle.
🔦 Candle Type
💚 Bullish Marubozu–type / Bullish Continuation Candle– Often found during the middle leg of a bullish swing, signaling strong trend momentum.
📌 Key Insight
Today's price action confirmed continuation of the recovery.
Close above 24,950–25,000 in the next session could ignite fresh upside.
Rejection around 25,060–25,080 would indicate caution — stay nimble.
🛡 5 Min Intraday Chart
⚔️ Gladiator Strategy Update
ATR: 268.49
IB Range: 114.05 → Medium IB
Market Structure: ⚖️ Unbalanced
Trades:
✅ 10:20 AM – Long Triggered → Target Achieved, Trailing SL Hit (RR: 1:3.28)
📌 Support & Resistance Zones
Resistance Levels
24,972 ~ 25,000
25,060 ~ 25,080
25,102 ~ 25,125
Support Levels
24,894 ~ 24,882
24,825 ~ 24,847
24,725 ~ 24,735
24,660
💭 Final Thoughts
The market played exactly as mapped — now it’s about decision time near 25K. Will the bulls charge ahead or pause? Either way, the structure favors short-term bullishness — but profit booking pressure near resistance must be expected.
🧠 “Momentum is a gift – but without volume and conviction, it fades at resistance.”
✏️ Disclaimer
This is just my personal viewpoint. Always consult your financial advisor before taking any action.

Buy on dips and seize rising opportunities📰 Impact of news:
1. Geopolitical risks
2. Expected Fed policy
📈 Market analysis:
The market opened higher in the morning and then continued to fall. From a medium-term perspective, the market is still in a medium-term bullish position. The price will only be under further pressure if it breaks below the weekly support. Observing from the daily level, the price broke through the daily resistance again last Wednesday and continued to soar after the breakthrough. The current price is testing the monthly high, and the subsequent gains and losses of the previous high are the key. Judging from the 1H chart, the short-term death cross continues to fall. At the same time, according to the 4H level, as time goes by, we need to pay attention to the support of 3413-3403. This support is the key watershed of the short-term trend. As long as it does not fall below this support, the bulls still have a chance.
🏅 Trading strategies:
BUY 3413-3403
TP 3430-3440
If you agree with this view, or have a better idea, please leave a message in the comment area. I look forward to hearing different voices.
OANDA:XAUUSD FX:XAUUSD FOREXCOM:XAUUSD FXOPEN:XAUUSD TVC:GOLD

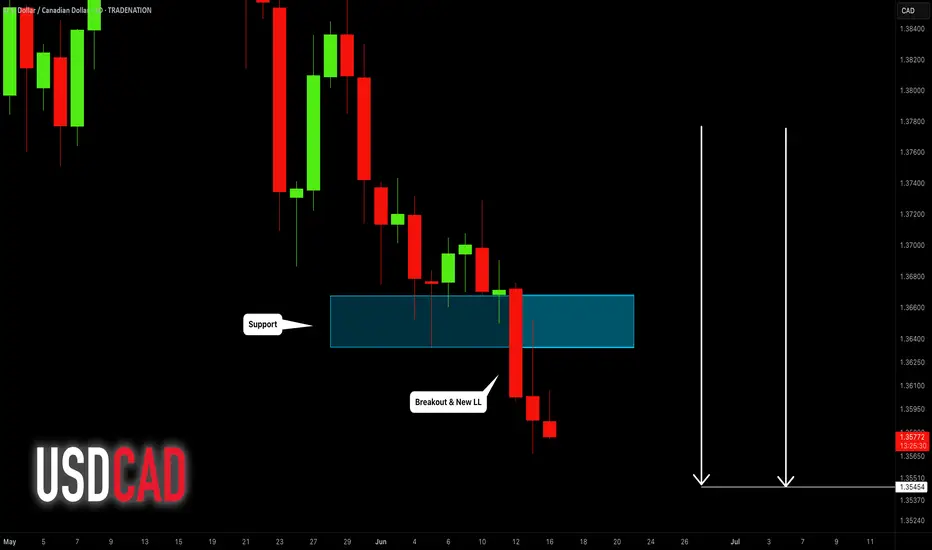
Short trade 🔻 USDCAD – Sell-side Trade
Date: Monday, 16th June 2025
Session: London Session AM
Time: 5:00 AM
Entry Timeframe: 1Hr TF
Trade Parameters
Entry: 1.35680
Take Profit: 1.34735 (+0.70%)
Stop Loss: 1.35965 (−0.21%)
Risk-Reward Ratio (RR): 3.32
🧠 Trade Reasoning
USDCAD has shown sustained bearish momentum on both 1Hr and 4Hr timeframes, with a clear lower high forming beneath the 1.35800 area. This trade was initiated on confirmation of a bearish rejection from a supply zone during the early London session volatility.

AUDCHF: Pullback From Resistance 🇦🇺🇨🇭
There is a high chance that AUDCHF will retrace from a key daily resistance.
As a confirmation, I see a strong rejection on an hourly time frame.
Goal - 0.5267
❤️Please, support my work with like, thank you!❤️
I am part of Trade Nation's Influencer program and receive a monthly fee for using their TradingView charts in my analysis.

EURUSD: Bullish Move After BreakoutThe price action on EURUSD shows that it broke through a horizontal resistance level on the 4-hour chart.
Following the breakout, a local correction occurred, forming a bullish flag pattern.
As the NY session opened, the market rose and surpassed its resistance line, indicating a strong likelihood of continued upward movement.
The target is set at 1.1616.

GBPCAD: Pullback After a Trap 🇬🇧🇨🇦
There is a high chance that GBPCAD will pull back
from the underlined support.
The price started to grow after a false violation of that and a confirmed bearish trap.
Goal - 1.8458
❤️Please, support my work with like, thank you!❤️
I am part of Trade Nation's Influencer program and receive a monthly fee for using their TradingView charts in my analysis.

XAU/USD 16 June 2025 Intraday AnalysisH4 Analysis:
-> Swing: Bullish.
-> Internal: Bullish.
Analysis and bias remains the same as analysis dated 23 April 2025
Price has now printed a bearish CHoCH according to my analysis yesterday.
Price is now trading within an established internal range.
Intraday Expectation:
Price to trade down to either discount of internal 50% EQ, or H4 demand zone before targeting weak internal high priced at 3,500.200.
Note:
The Federal Reserve’s sustained dovish stance, coupled with ongoing geopolitical uncertainties, is likely to prolong heightened volatility in the gold market. Given this elevated risk environment, traders should exercise caution and recalibrate risk management strategies to navigate potential price fluctuations effectively.
Additionally, gold pricing remains sensitive to broader macroeconomic developments, including policy decisions under President Trump. Shifts in geopolitical strategy and economic directives could further amplify uncertainty, contributing to market repricing dynamics.
H4 Chart:
M15 Analysis:
-> Swing: Bullish.
-> Internal: Bullish.
Following previous bullish iBOS and subsequent printing of bearish CHoCH, price did not pullback to either M15 supply zone, or discount of internal 50% EQ, therefore, I will not mark current iBOS but will mark it in red. The reason I am not classifying this as an iBOS is, due to relative price action, the internal range would be too narrow.
The remainder of my analysis shall remain the same as analysis dated 13 June 2025, apart from target price.
As per my analysis dated 22 May 2025 whereby I mentioned price can be seen to be reacting at discount of 50% EQ on H4 timeframe, therefore, it is a viable alternative that price could potentially print a bullish iBOS on M15 timeframe despite internal structure being bearish.
Price has printed a bullish iBOS followed by a bearish CHoCH, which indicates, but does not confirm, bearish pullback phase initiation. I will however continue to monitor, with respect to depth of pullback.
Intraday Expectation:
Price to continue bearish, react at either M15 supply zone, or discount of 50% internal EQ before targeting weak internal high priced at 3,451.375.
Note:
Gold remains highly volatile amid the Federal Reserve's continued dovish stance, persistent and escalating geopolitical uncertainties. Traders should implement robust risk management strategies and remain vigilant, as price swings may become more pronounced in this elevated volatility environment.
Additionally, President Trump’s recent tariff announcements are expected to further amplify market turbulence, potentially triggering sharp price fluctuations and whipsaws.
M15 Chart:

USDCAD: Bearish Trend Continues 🇺🇸🇨🇦
Amid the geopolitical tensions and a bullish rally on Crude Oil,
USDCAD is going to drop more.
The closest support that I see is 1.3545.
It will be the next goal for the sellers.
❤️Please, support my work with like, thank you!❤️
I am part of Trade Nation's Influencer program and receive a monthly fee for using their TradingView charts in my analysis.
Ethereum’s 19-Day ETF Inflow Streak: What Really HappenedEthereum’s 19-Day ETF Inflow Streak: What Really Happened to Price, Structure, and Sentiment
Table of Contents
1. Executive Summary
2. ETF Backdrop: How the 19-Day Inflow Wave Took Shape
3. Chronology of Price: Day-by-Day Performance
4. Weekly Chart Anatomy: The “Pre-Tower Top” Signal Explained
5. Intraday Technicals: From $2,450 Low to the $2,620 Hurdle
6. On-Chain & Derivatives Lens: Funding, OI, CEX Balances
7. Fundamental Undercurrents: Dencun Afterglow, L2 Fees, Staking Yields
8. Risks & Catalysts: ETH vs. Macro, vs. BTC Dominance, vs. SEC Noise
9. Playbooks for Traders and Long-Term Allocators
10. Conclusion: A Pause, Not a Peak—If Key Levels Hold
________________________________________
1. Executive Summary
• Ethereum received 19 consecutive days of net inflows into spot-linked exchange-traded products (ETPs) totaling $1.37 billion, the longest positive streak since the 2021 bull-run.
• Over the same period ETH/USD rose 18.4 %, printing a local high at $2,750, but has since pulled back to $2,575 amid broad crypto risk-off and Middle-East tensions.
• The latest weekly candle morphs into a “pre-tower top” pattern—two tall green candles followed by a small-bodied doji—often a harbinger of heavy distribution if confirmed by another red week.
• Short-term structure improved Monday: price pierced a contracting-triangle ceiling at $2,550, reclaimed the 100-hour SMA, and now eyes $2,620 as the gatekeeper to renewed upside.
• Funding rates flipped neutral, exchange reserves hit a 7-year low, and staking deposits outpace withdrawals 1.7 : 1—on-chain signs that the sell-off is more leverage shakeout than top formation.
________________________________________
2. ETF Backdrop: How the 19-Day Inflow Wave Took Shape
2.1. The Players
Unlike Bitcoin’s mammoth U.S. spot ETFs, Ethereum’s inflow streak drew from Europe and Canada, where physically backed ETPs have traded since 2021. The three biggest contributors:
Product Country 19-Day Net Flow AUM Growth
21Shares Ethereum ETP (AETH) Switzerland +$502 m +38 %
CI Galaxy Ethereum ETF (ETHX) Canada +$458 m +29 %
WisdomTree Physical Ethereum EU +$227 m +24 %
Rumors of an SEC approval window “after the U.S. election” sparked pre-positioning; asset managers figured it was cheaper to accumulate now than chase later once liquidity explodes on Wall Street.
2.2. Flow Mechanics
When an ETP issues new shares, it must buy spot ETH or tap an AP that can supply coins—direct demand unmatched by equivalent selling pressure. Over the 19-day window, the net 396 k ETH of creation equaled 57 % of all new issuance from block rewards post-Dencun, creating a measurable supply squeeze.
2.3. Historical Context
The only longer stretch was January–February 2021 (27 days), which culminated in ETH exploding from $1,400 to $2,000. The key difference today: market cap is six times larger, so identical inflows exert a milder percentage impact, explaining why price “only” added ~18 %.
________________________________________
3. Chronology of Price: Day-by-Day Performance
Day Date ETF Net Flow Price Close % Δ vs. Prior Day
1 Mar 18 +$58 m $2,110 —
5 Mar 22 +$73 m $2,265 +7.3 %
10 Mar 27 +$94 m $2,430 +2.4 %
15 Apr 1 +$125 m $2,690 +3.8 %
19 Apr 5 +$81 m $2,750 +0.9 %
Across the stretch, realized volatility rose from 32 % to 46 %, but skew stayed positive, showing call demand outpaced puts until the very end, when geopolitical headlines flipped sentiment.
________________________________________
4. Weekly Chart Anatomy: The “Pre-Tower Top” Signal Explained
4.1. What Is a Tower Top?
In candlestick lore, a tower top comprises:
1. A tall green candle (strong breakout)
2. Another tall green candle (exhaustion)
3. A narrow doji or spinning top (equilibrium)
4. A large red candle (breakdown confirmation)
We currently have the first three pieces: the last two weeks of March delivered back-to-back 10 % advances; the first week of April closed as a +0.6 % doji. The pattern is not confirmed until a decisive red week engulfs the doji body (< $2,540).
4.2. Indicators
• RSI (weekly): 59 → ticking down from 68 high; still shy of overbought.
• MACD histogram: Positive but flattening.
• Bollinger bands: Price mid-point of upper band, room for one more expansion.
Conclusion: the candle warns of fatigue, but momentum hasn’t rolled over—yet.
________________________________________
5. Intraday Technicals: From $2,450 Low to the $2,620 Hurdle
5.1. Hourly Chart (Kraken Feed)
• Triangle Breakout: Price sliced through descending trend-line at $2,550, tagging $2,590.
• Moving Averages: ETH trades marginally above the 100-hour SMA ($2,575) but below the 200-hour ($2,610).
• Fibonacci Zones: $2,620 aligns with 0.5 retrace of the $2,750→$2,450 fall—classic reversal pivot.
A clean hourly close >$2,620 opens the door to $2,680 (0.618 Fib) and psychological $2,700. Failure rejects to $2,520 support cluster.
5.2. Order-Book Heat Map
Coinbase Pro data shows 1,300 ETH ask wall at $2,620 and a thinner 890 ETH bid at $2,520. Liquidity skew favors dip-buying, but bulls need market orders >1 k ETH to smash the ask block.
________________________________________
6. On-Chain & Derivatives Lens
6.1. Exchange Reserves
Centralized exchanges now hold 12.9 million ETH, lowest since July 2017. The 19-day ETF harvest accelerated an already extant down-trend of roughly 60 k ETH/week outflows, mostly into staking contracts and L2 bridges.
6.2. Staking Flows
• Beacon deposit contract: +188 k in April’s first week.
• Withdrawal queue: 11 k ETH—tiny relative to deposits.
• Effective deposit APR after Dencun: 3.2 %, still beating U.S. 2-year T-notes post-tax for many investors.
6.3. Perpetual Funding & OI
• Funding normalized to 0.007 %/8 h (≈ 3.2 % APR), down from 9 % at March highs—spec longs flushed.
• Open Interest shed $420 m in the two-day dip—liquidations, not fresh shorts, drove the wash-out.
6.4. Options Skew
• 25-delta risk reversal (1-month): flipped to –4 % (puts pricier than calls) for first time since January—hedging demand but nowhere near panic-level (–12 % in 2022 bear).
________________________________________
7. Fundamental Undercurrents
7.1. Dencun Afterglow & L2 Fees
Proto-danksharding (EIP-4844) slashed L2 data costs by 85 %, pushing average Arbitrum and Optimism transaction fees under $0.02. Cheaper blockspace fuels on-chain activity:
Metric Pre-Dencun Post-Dencun Δ
Daily L2 Txns 2.4 m 4.1 m +71 %
Bridged ETH to L2s 6.8 m 7.9 m +16 %
More usage → more gas burned → structural tailwind to ETH as a fee-burn asset.
7.2. DeFi TVL
Total value locked rebounded to $61 billion, led by EigenLayer and restaking hype. ETH comprises 68 % of TVL collateral—every lending loop pins additional demand.
7.3. Competing Narratives
• Solana season siphoned retail mind-share; SOL/ETH ratio popped 42 % YTD.
• Bitcoin L2s (Stacks, Rootstock) attempt to mirror Ethereum’s smart-contract moat, but dev tooling remains nascent.
•
Net: Ethereum retains developer supremacy (70 % of new GitHub commits among smart-contract chains) and therefore garners institutional comfort.
________________________________________
8. Risks & Catalysts
Factor Bearish Angle Bullish Rebuttal
Macro Sticky U.S. CPI halts Fed cuts → higher real yields weigh on non-yielders ETH staking yield + MEV is real cash-flow; Dencun lowers L2 costs → adoption offset
SEC Spot ETF Delay past Jan 2026 or outright denial kills U.S. inflow dream 19-day streak proves ex-U.S. capital is hungry; approval >0 is all it takes for supply shock
BTC Dominance Halving FOMO may keep Bitcoin’s share >55 %, starve ETH rotation Historical pattern: ETH rips 6-10 weeks post-halving as beta plays catch-up
Tower-Top Pattern Weekly confirmation could spark drop to $2,200 support Pattern fails if bulls recapture $2,750 quickly, turning doji into bullish flag
________________________________________
9. Playbooks for Traders and Long-Term Allocators
9.1. Short-Term Momentum (0–7 days)
• Bias: Range-trade $2,520–$2,620 until breakout.
• Instruments: ETH-perp on Bybit/Deribit, 3× leveraged tokens for reduced funding bleed.
• Trigger: 15-minute candle above $2,620 with ≥ $50 m aggregated CVD buys.
• Stop: $2,560 (triangle retest).
• Target: $2,680 then $2,700.
9.2. Swing (1–8 weeks)
• Bias: Accumulate dips as long as weekly stays >$2,350 (0.382 Fib of Oct→Mar leg).
• Tools: 1-month $2,500-$2,800 call spreads; spot with 25 % collar protection.
• Catalysts: SEC commentary May 23, FOMC June 18.
9.3. Position (6–18 months)
• Bias: Dollar-cost average into staking nodes; carry 4 % ETH on portfolio NAV.
• Thesis: EIP-4844 usage boom + probable U.S. ETF = $4–5 k fair value by 2026.
• Risk Control: Hedge 25 % notional via BTC-perp short if BTC.D >58 %.
________________________________________
10. Conclusion: A Pause, Not a Peak—If Key Levels Hold
The 19-day ETF inflow streak proves that institutional demand for Ethereum exists even without a U.S. spot vehicle. Price responded vigorously but not parabolically, reflecting the asset’s growing market-cap gravity. The nascent “pre-tower-top” weekly candle warns of exhaustion; confirmation, however, requires another bearish week that cracks $2,540 support.
Short-term order-flow shows willing dip buyers, staking metrics scream supply sink, and the macro backdrop—while shaky—fails to dent ETH’s relative value proposition versus fiat yields. Translation: Ethereum is vulnerable to headline-driven squalls but structurally sound.
If bulls recapture $2,620, the path to retest $2,750 and ultimately $3,000 reopens. Lose $2,450 and the tower top will complete, sending ETH toward $2,200 where ETF inflow buyers likely reload. For now, the balance of evidence favors consolidation with an upward skew—tower construction, perhaps, but no wrecking ball yet.

BTC/USDT Technical Analysis, 2025-06-15 14:00 UTCBTC/USDT Technical Analysis, 2025-06-15 14:00 UTC
This setup illustrates a high-probability short-term trade using confluence between technical indicators, price action, volume behavior, and order book data.
Entry Conditions
A potential long entry was identified around 105,289.39 based on the following:
RSI (21) was in the oversold zone, below the 40 level
MACD (8/18/6) histogram flipped from negative to positive, signaling momentum shift
Stochastic (21,5,5) showed a %K/%D bullish crossover in the oversold region
A bullish reversal candlestick pattern formed near short-term support
Whale activity detected in the order book, including a 3.87 BTC buy wall
EMA Ribbon (5/13) indicated a bullish crossover
Take Profit & Risk Management
Target level for potential profit was set near 106,489.39, representing approximately a 1.2% move from entry
Stop loss was positioned at 104,689.39, around 0.6% below the entry to maintain a 1:2 risk-to-reward ratio
Order Flow Context
On-balance volume (OBV) was rising, supporting upward pressure
Bid dominance reached 41.9%, indicating aggressive buyers in control
Depth of market showed strong support from large limit buy orders
Important Notes for Traders
Always backtest setups before applying in live market conditions
Use stop losses to protect capital
