EURNZD Break & Retest of Double Bottom Neckline (BUY)(WEEKLY) - Price is in Strong Uptrend.
(WEEKLY) - Price formed Double Bottom Equal Lows at ( 1.88915 - 1.88078).
(WEEKLY) - Weekly Breakout Candle Closing above DB Neckline at (1.91570 - 1.91145).
(DAILY) - Double Bottom Neckline at (1.91570 - 1.91145).
(4H) - Price is forming rising higher lows inside DB Neckline.
Trade Management.
Stop loss - 1.91145
Take Profit - Previous Swing High at 1.95791.
Candlestick Analysis

long trade
🟢 BTCUSDT – Buyside Trade
Date: Sunday, 15th June 2025
Session: NY Session PM
Time: 5:00 PM
Entry Timeframe: Precision Intraday Entry
Trade Parameters
Entry: 104,502.89
Take Profit: 105,567.08 (+1.02%)
Stop Loss: 104,377.60 (−0.12%)
Risk-Reward Ratio (RR): 8.49
🧠 Trade Reasoning
BTCUSDT showed a textbook liquidity sweep and recovery during the NY PM session, grabbing lows below 104,400 before swiftly reversing. The entry at 104,502.89 was taken on confirmation of short-term bullish structure reclaiming the range low.


Long trade
🟢 DOGEUSDT – Buyside Trade
Date: Sunday, 15th June 2025
Session: Asia Session AM
Time: 6:30 AM
Entry Timeframe: 15min TF
Trade Parameters
Entry: 0.17421
Take Profit: 0.17838 (+2.39%)
Stop Loss: 0.17361 (−0.34%)
Risk-Reward Ratio (RR): 6.95
🧠 Trade Reasoning (Buyside)
DOGEUSDT printed a bullish market structure shift during the early Asia session after a sweep of short-term liquidity beneath the 0.17360 level.

TES swing buy projectionbullish structure
irl-erl liquidity target
point of interest: orderblock on LTF

Long trade
🟢 PEPEUSDT – Buyside Trade
Date: Sunday, 15th June 2025
Session: Asia Session AM
Time: 6:15 AM
Entry Timeframe: Short-term (scalp entry)
Trade Parameters
Entry: 0.00001112
Take Profit: 0.00001158 (+4.14%)
Stop Loss: 0.00001101 (−0.99%)
Risk-Reward Ratio (RR): 4.18
🧠 Trade Reasoning
Price action on PEPEUSDT was consolidating within a tight range following a liquidity sweep beneath the 0.00001100 handle. Entry was taken after observing bullish confirmation at a micro demand zone, with the price reclaiming a short-term range low.

BTC update!!Good day traders, here is another update on BTC and I have adjusted my narrative but my overall bias is still remaining bearish…

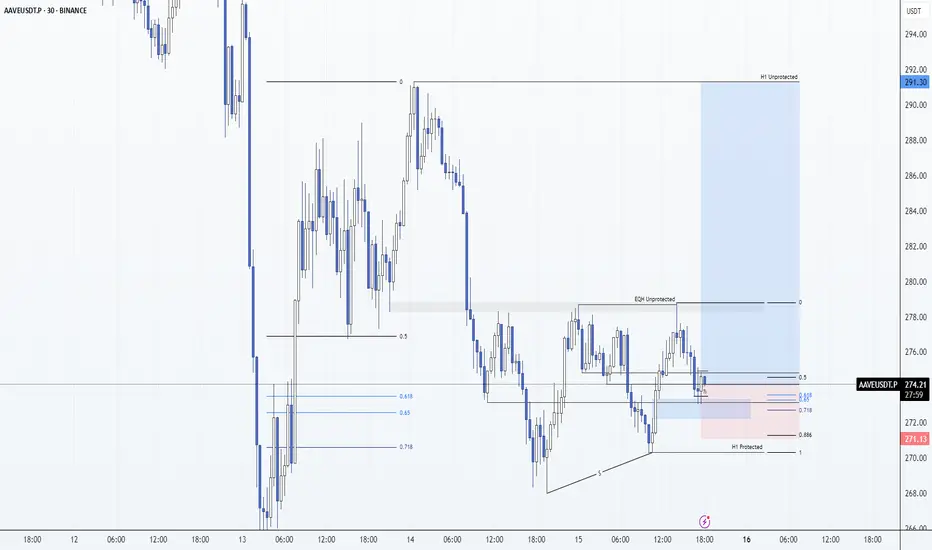
AAVE: Long 15/06/25Trade Direction:
AAVE Long
Risk Management:
- Risk halved because of weekend
- Halved again as counter HTF trend (Bearish)
- 0.25% risk
Reason for Entry:
- OTE Retracement
- Failure to displace on this bearish leg
- Key support
- Oversold M15
- M5 Ts
- M5 Bull Div
- H1 and M30 FVG
Additional Notes:
- Target EQHs then HTF DOL at 291
- Probably one of the weaker alts and if btc rolls over this will get stopped. If it breaks out of EQHs expect that imbalance to get aggressively swept to 291.
- SL At 0.886 retracement because my system dictates if the FVG gets fully mitigated we are going to sweep the H1 Protected
- Losing FVG (Fully mitigating it) would invalidate this idea.
- Highly risky as no MSB / CHoCH has formed for bulls.
Last trade of the day for me. Until I get a potential short trigger above 106,500 btc no more trades till tomorrow. Have a good weekend.
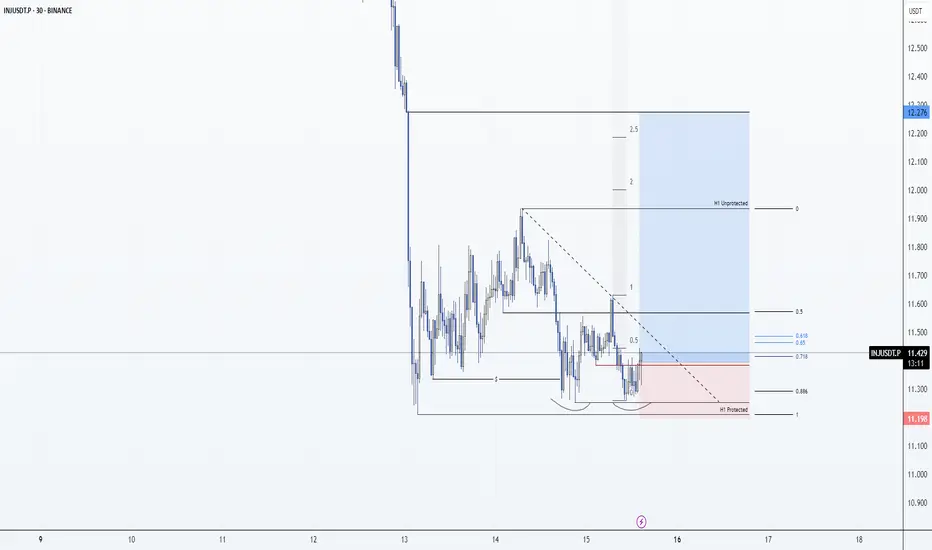
INJ: Long Idea 15/06/25Trade Direction:
INJ Long
Risk Management:
- Risk halved because of weekend
- Halved again as counter HTF trend (Bearish)
Reason for Entry:
- BTC retrace into OTE of H1 Leg and looks primed for my target on that long at $106,300 - $106,500
- Double Bottom
- Price starting to move out of oversold on multiple timeframes
- Failure to displace lower
- HTF Support.
Additional Notes:
- Target second daily FVG with a flat candle.
- Probably one of the weaker alts and if btc rolls over this will get stopped.
- Double bottom could be read as EQL which could get swept
- Losing the double bottom would invalidate this idea
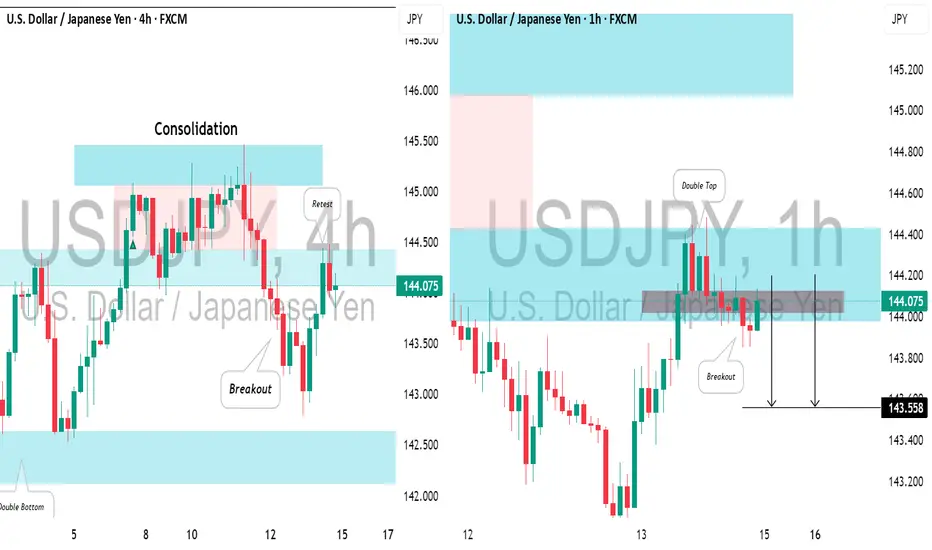
USDJPY: Intraday Bearish ConfirmationIn the middle of last week, I spotted a valid confirmed structure breakout on 📉USDJPY on a 4-hour timeframe.
Currently, the pair is retesting the broken structure, and the price has formed a strong bearish confirmation on the hourly chart.
I see a double top pattern and a violation of its neckline.
With high probability, the price will fall and reach the 144.02 level.
Naturalgas long tradeNaturalgas is resisting downside movement as witnessed on chart.
If you see the downward movement of Naturalgas, it is with relatively high volume but it is not coming down as expected from sellers and bouncing back up again as seen 3 times.
Now naturalgas has reached short term resistance zone of 307-310 from which it took support on 9th June, broke it on 10th June, took resistance on 11th and 12th June.
This might be a Change of Character zone for Naturalgas.
And now that Naturalgas is resisting downward movement, we might see breakout of this zone and probable upside movement.
Lastly it is also forming Ascending triangle which is still premature but just for reader's consideration.
Let's watch it on coming days.

GBPCHF trade ideea potential for next week.The trend is strongly bearish, so I am going to be waiting for a retest of the previous AOI then to sell. Preatty simple I would say😃

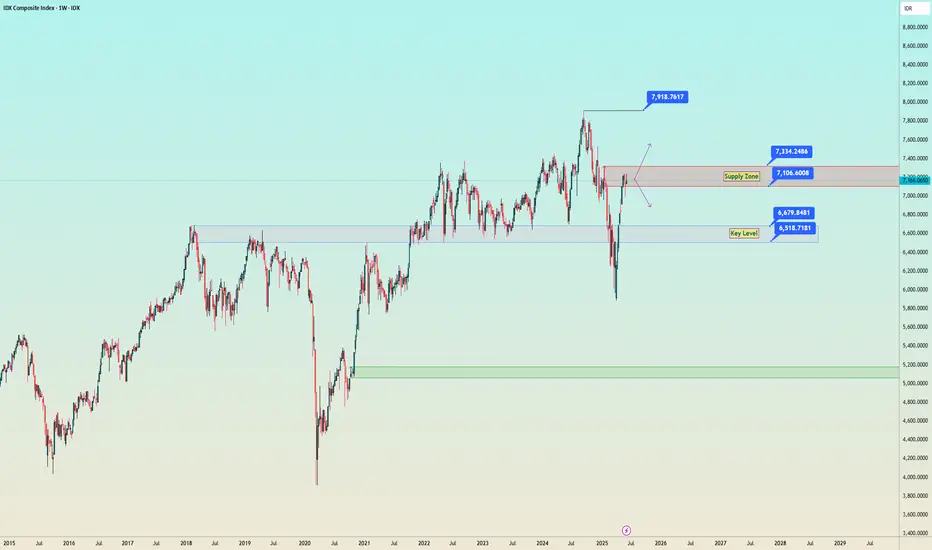
IHSG / IDX - Wait and See...Continue or pullback ?
Currently our IDX Composite in Supply Zone and Candle stick shown push back from Seller since last week.
Need to get confirmation whether this week IDX will pass the supply zone or it will pull back to "key level" area.
Enjoy !
EURUSD: Move Up Ahead?! 🇪🇺🇺🇸
EURUSD nicely respected the underlined key horizontal support.
A strong rejection from that and a formation of a bullish imbalance candle
indicate a highly probably bullish continuation next week.
Goal - 1.1608
❤️Please, support my work with like, thank you!❤️
I am part of Trade Nation's Influencer program and receive a monthly fee for using their TradingView charts in my analysis.

Short trade
Pair: SOLUSDT
Trade Type: Sell-side trade
Date: Sunday, 15th June 2025
Time: 1:00 AM
Session: Tokyo Session
Entry Timeframe: 15min TF
📍 Trade Details
Entry Price: 147.33
Profit Level: 144.54 (1.89%)
Stop Level: 148.19 (0.58%)
Risk-to-Reward Ratio (RR): 3.19
🧠 Context / Trade Notes
Trade executed during the Tokyo session, known for lower liquidity and often used to fade exaggerated price moves from the prior sessions. Price tapped into a minor supply zone formed during the late NY session, showing early signs of sell-side intent.
1Hr TF Overview

Nifty Analysis EOD – June 13, 2025 – Friday 🟢 Nifty Analysis EOD – June 13, 2025 – Friday 🔴
🕊️ Gap-Down on Geopolitical Tension – Buyers Step In at Crucial Support
Nifty opened with a massive gap-down of 415 points at 24,473 triggered by overnight geopolitical tensions — testing a crucial swing low from May 22. Interestingly, the market formed an OL (Open = Low) pattern and staged a powerful 281-point intraday recovery, closing near the day’s high at 24,718.60.
While the adjusted close still reflects a −0.68% drop, the price action was dominantly bullish. The strong bounce from the 24,460–24,520 demand zone — a region that had acted as a reversal zone multiple times earlier — reaffirms its significance.
🧭 If global cues stabilize or turn positive, this could pave the way for a bounce back toward 25,000. But if Friday’s low is breached, sentiment damage may deepen further. For now, intraday opportunities are preferable over positional plays, as uncertainty persists.
📝 A reminder from the May 22 note:
“Is the retracement run finished? Technically, YES. A bold call, but unless global headwinds reappear, today’s low must sustain.”
Nifty has once again honored this level — but the coming sessions will determine whether this bounce was genuine or temporary.
🛡 5 Min Chart with Levels
🕯 Daily Time Frame Chart
🕯 Daily Candle Breakdown
Open: 24,473.00
High: 24,754.35
Low: 24,473.00
Close: 24,718.60
Net Change: −169.60 (−0.68%)
📊 Candle Structure Breakdown
Real Body: 245.60 pts → 🟢 Strong Green Candle
Upper Wick: 35.75 pts
Lower Wick: None (OL Formation)
🔍 Interpretation
Despite the gap-down, bulls took control right from the open.
The absence of a lower wick signals firm intraday confidence.
Closing near the high reinforces the buying strength, even on a net down day.
🔦 Candle Type
💚 Bullish Marubozu–like (OL) Candle– Represents a strong intra-session reversal, where buyers dominated from the very first tick.
📌 Key Insight
Price respected the 24,460–24,520 zone, once again validating it as key support.
If the next session crosses and sustains above 24,750–24,770, a short-term reversal confirmation could follow.
However, a breakdown below 24,473 may renew bearish pressure.
🛡 5 Min Intraday Chart
⚔️ Gladiator Strategy Update
ATR: 269.05
IB Range: 145.05 → Medium IB
Market Structure: Balanced
Trades:✅ 10:20 AM – Long Triggered → Target Achieved, Trailing SL Hit (RR: 1:1.7)
📌 Support & Resistance Zones
Resistance Levels
24,725 ~ 24,735
24,825 ~ 24,847 (Fibonacci 0.5 retracement level)
24,882 ~ 24,894
24,972 ~ 25,000
25,060 ~ 25,080
Support Levels
24,660
24,640 ~ 24,625
24,420
24,365 ~ 24,330
24,245 ~ 24,220
💭 Final Thoughts
Friday’s session was a battle between fear and resilience — and bulls showed up just in time. The key test ahead: can the index reclaim 25K or will the bounce fade away?
🧠 “Great rebounds are born from great fear — but follow-through is what separates noise from reversal.”
✏️ Disclaimer
This is just my personal viewpoint. Always consult your financial advisor before taking any action.

Bitcoin is holding the 200 EMA on H4 despite everything...Despite war news and heavy sell volume, BTC held the 200 EMA on H4.
Low-volume weekend = low liquidity, yet bears still couldn’t break it.
🧠 Classic Effort vs. Result: big effort, weak result = hidden strength.
🎯 If it holds: $106.5K → $108.2K → $110K in play.
Structure intact. Bulls stealthily in control.

Short trade Pair: PEPEUSDT
Trade Type: Sell-side trade
Date: Saturday, 14th June 2025
Time: 6:30 AM
Session: London to New York Session AM
Entry Timeframe: 15min
📍 Trade Details
Entry Price: 0.00001111
Profit Level: 0.00001064 (4.23%)
Stop Level: 0.00001121 (0.90%)
Risk-to-Reward Ratio (RR): 4.70
🧠 Context / Trade note: Sell-side trade idea
Trade positioned during the London to NY session overlap, a high-volume window with strong directional momentum. Observed volume imbalance as price pushed into a minor supply zone — signs of liquidity sweep and exhaustion.
15min TF entry

Short trade Sell-side trade
ETHUSDT
Sat 14th June 25
7.30 am
Asia Session AM
Entry 2531.42
Profit level 2498.58 (1.30%)
Stop level 2547.18 (0.62%)
RR 2.08
Reason: Observing a previous failed sell-side trade, I decided to take another sell-side trade on this occasion. To add the trade was executed during the early Asia session, typically marked by lower liquidity and increased sensitivity to order flow.

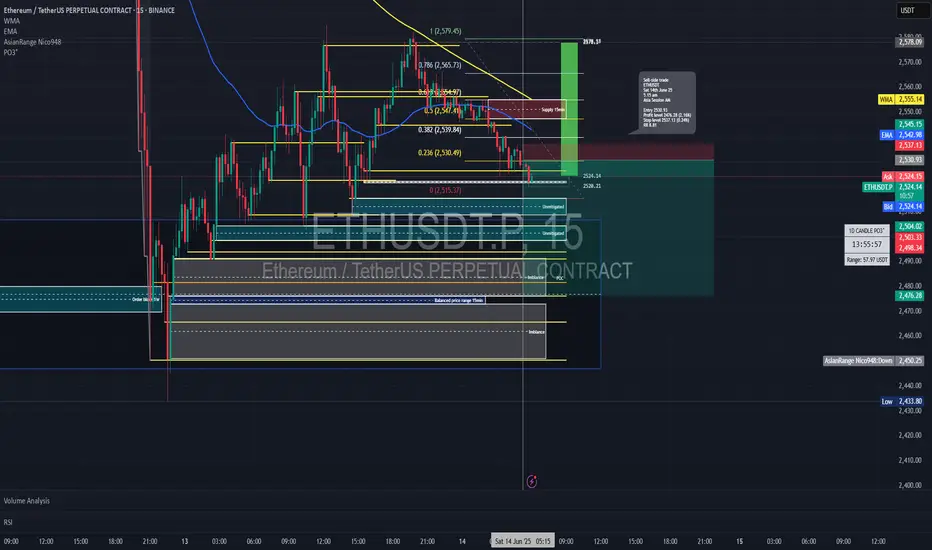
Short trade Sell-side trade
ETHUSDT
Sat 14th June 25
5.15 am
Asia Session AM
Entry 15min TF
Entry 2530.93
Profit level 2476.28 (2.16%)
Stop level 2537.13 (0.24%)
RR 8.81
Sell-side trade idea narrative based on the ICT seek and destroy indicator, taking session liquidity into account for directional bias, along with unmitigated price zones and imbalanced price ranges for confluence.
Gold will inevitably fall after risingGold has risen sharply due to the violent geopolitical conflicts and the surge in risk aversion. It once reached around 3445, but in the process of falling back, it only touched 3408 and rebounded again, stabilizing above 3400. It is obvious that due to the changes in fundamentals, the sentiment of gold bulls is high; although the upward momentum of gold near 3440 has weakened, there is no clear signal of peaking yet!
For short-term trading, it is relatively difficult to participate at present. To be honest, I naturally don’t want to chase gold at a high level; but there are no more signals to support me to short gold for the time being. However, with the rebound of gold, the current short-term support below is in the 3425-3415 area, followed by the psychological support of the 3400 integer mark; and the short-term resistance above is in the 3455-3465 area, followed by the area near 3480.
Compared with the profit and loss ratio, I prefer shorting gold for short-term trading, because gold has performed relatively strongly in the London market. Logically, gold will have the inertia to rise in the New York market, so I think gold may rise and then fall in the New York market, so my current plan is to try shorting gold starting in the 3455-3465 area.
Because the changes in gold's fundamentals are more extreme and complex, you must set up SL when participating in transactions.

Bull market continues? Beware of the possibility of a pullback📰 Impact of news:
1. The geopolitical situation between Israel and Iran deteriorates
📈 Market analysis:
In the short term, gold is expected to rise further. Relatively speaking, there is still room for further increase. If it continues to rise today, it depends on the test of 3440 points, which is the opening position of the previous decline. In the short term, pay attention to the 3340-3350 resistance. If it can break through and stay above it, the 3468-3493 line we gave in the morning can still be used as a reference, and it is even expected to reach 3500. But at the same time, the RSI indicator in the hourly chart is approaching the overbought area, so we still need to be vigilant about the possibility of a pullback.
🏅 Trading strategies:
SELL 3440-3450
TP 3430-3420
BUY 3415-3400
TP 3420-3440
If you agree with this view, or have a better idea, please leave a message in the comment area. I look forward to hearing different voices.
TVC:GOLD FXOPEN:XAUUSD FOREXCOM:XAUUSD FX:XAUUSD OANDA:XAUUSD
