Repeated sweeps, gold trend analysis and operation layout📰 Impact of news:
1. Pay attention to the initial unemployment claims data
📈 Market analysis:
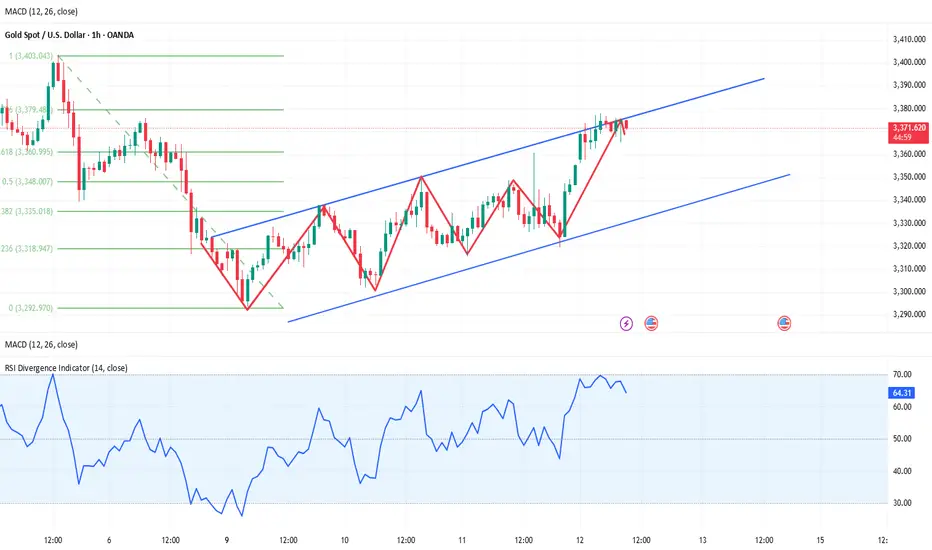
Gold price jumped higher in Asian session. The short-term upper pressure is at 3375. Once it breaks, the upward route of bulls will be opened. The RSI indicator in the 1H chart began to retreat after touching the overbought area. Last night's high of 3360 is now a breakthrough, and the previous strong suppression is at 3350. This morning's Asian session was also broken and stabilized. Then 3360-3350 has changed from a suppression position to a support position. Therefore, the next position we should pay close attention to should be around 3360-3350. If it can fall back to 3360-3350 in the future, it is possible to enter the market to do more, but at the same time, it is also necessary to defend 3345. Independent trading requires a SL.
🏅 Trading strategies:
BUY 3360-3350
TP 3370-3380-3400
If you agree with this view, or have a better idea, please leave a message in the comment area. I look forward to hearing different voices.
TVC:GOLD FXOPEN:XAUUSD FOREXCOM:XAUUSD FX:XAUUSD OANDA:XAUUSD
Candlestick Analysis
USD/CHF Testing June Low as Momentum Turns SouthRising geopolitical tensions and sliding U.S. Treasury yields have dragged USD/CHF sharply lower, delivering a bearish engulfing candle on the daily and pushing the pair back towards the June low at .8160. The move sets up a potential short should that level give way.
A clean break of .8160 would allow for positions to be established with a stop above for protection, targeting a retest of the April 21 swing low at .8040. Momentum signals are turning bearish, with RSI (14) breaking its uptrend and drifting further from neutral, while MACD looks set to cross the signal line below zero.
While a long setup is also a consideration should .8160 hold, recent price action and momentum shifts suggest it’s a low-probability play.
Good luck!
DS

Nasdaq Futures: Tariff Talk, Tech Fatigue Turn TideHaving surged more than 20% from the April lows, we could be nearing a turning point for Nasdaq 100 futures.
Bullish momentum is showing signs of shifting lower, while Wednesday’s inverted hammer candle—on a day when tech stocks were given every excuse to rally thanks to the soft U.S. inflation report and subsequent decline in Treasury yields—warns the rally may be running out of steam.
With Donald Trump talking about setting firm tariff rates for individual nations within the next two weeks, we’re already seeing signs of weakness in futures, bolstering the prospect for a three-candle evening star pattern being completed. Sitting in a rising wedge, directional risks seem to be skewing lower.
If the price breaks and closes beneath wedge support, it would create a setup where shorts could be established with a stop above Wednesday’s high to protect against a resumption of the bullish trend.
21436 is a minor support level that screens as an initial target, although 20800—where the price bounced strongly from on May 23—makes for a more appealing case from a risk-reward perspective.
A push and close above 21969—a minor resistance level established earlier this year—would invalidate the bearish bias.
Good luck!
DS

Insist on shorting gold on ralliesToday we made a total profit of 350 pips in 2 short trades. First, we shorted gold near 3345, and when gold fell to around 3330, we manually closed the order to lock in profits; the second time, gold rebounded sharply with the help of CPI data, and we seized the opportunity to short gold again near 3360, and ended the transaction by hitting TP: 3340. We accurately grasped the profit of gold shorting.
At present, gold is in a narrow range of fluctuations near the 3330 mark. Relatively speaking, gold is still in a weak position. Although gold has rebounded sharply with the help of the positive CPI data, it has shown a long upper shadow in the candle chart due to the rapid retracement, which has strengthened the resistance above and limited the rebound space of gold in the short term. In addition, the morphological structure shows signs of building a head and shoulders top structure. The resistance area in the short term is 3345-3355; followed by 3360-3370. Although gold is currently in a narrow range of fluctuations near the 3330 mark, it does not show obvious signs of support. It is easy to fall below the area near 3330 in a weak situation. The relatively strong support is in the 3320-3310 area, followed by the area near 3300-3290.
So for short-term trading, I still advocate taking the 3345-3355 area as resistance first and continue to short gold!

MES Long - HVN, Gap, FVG, Long trade for MES based on High Volume Node with refined Entry in lower timeframe.
HVN on higher timeframe (daily)
HVN on lower timeframe (m30)
Gap followed by huge FVG
Expected reaction for price to bounce to the upside.
TP2 rather a swing trade exit.
TP1 more of a intraday trade exit.

How to arrange the gold price in the evening? Go long at 3330📰 Impact of news:
1. CPI data is profitable
2. The US CPI rose slightly in May, and Trump's tariff effect has not yet fully emerged
📈 Market analysis:
The trend line position of the 4H chart coincides and resonates with the middle track of the Bollinger Band, with 3326 as the watershed reference. This is why it is difficult to break below this point after repeated tests. Once it breaks below, the short-term trend is likely to fluctuate from strong to weak. However, the current support below is still strong at 3330-3326. The repeated rise and fall of data during the day also stopped the decline at this point. If the price does not lose here, the pattern of strong fluctuations will remain unchanged, and the bulls will gradually regain lost ground. At present, it is time for space. The operation suggestion for the future market is to continue to rely on the bullish trend above 3330, and 3330-3326 can be flexibly entered. At the same time, the RSI indicator is above 50 and there is still some space from the overbought zone. The signal is given that 3360, although the long upper shadow line K is closed, is very likely not the short-term top. After the sharp rise and fall in 1H, it went sideways and waited for the next wave of strength. If the night close is above 3326, the upper area will probably be 3350-3360. If the price can break through and stabilize this level, the upward pace will most likely accelerate to reach 3370-3380.
🏅 Trading strategies:
BUY 3330-3326
TP 3350-3360
If you agree with this view, or have a better idea, please leave a message in the comment area. I look forward to hearing different voices.
OANDA:XAUUSD FX:XAUUSD FOREXCOM:XAUUSD FXOPEN:XAUUSD TVC:GOLD
Bitcoin H4 – UpdatePrice consolidating just under $110K with low sell volume. This is bullish compression, not weakness.
📍 Key support: $109K
📍 Breakout above: $110.3K → 🚀 $112K+ in sight
📍 Invalidated below: $108K
This is the calm before the next leg up.

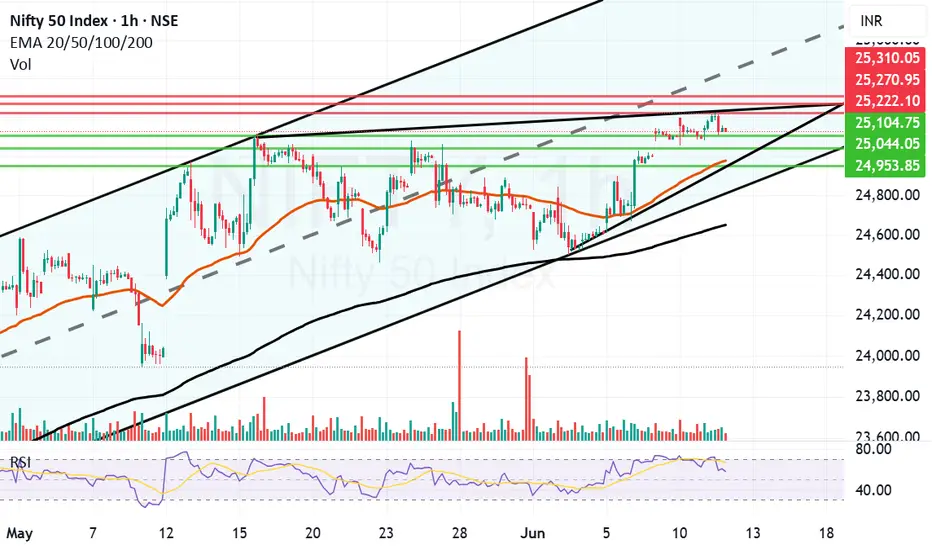
Nifty Facing resistnace above 25200 zoneToday Nifty closing above 25141 is a positive sign but it is evidently facing resistnace above 25200 zone. Nifty made a high of 25222 today but could not sustain at those levels and fell but eventually closed in the positive. The daily candle formed is an indecisive Doji.
IT Sector seems to be on the verge of a Reverse Head and Shoulder Breakout. If this breakout happens and Nifty gets support from other heavy weights we can see it growing further.
The resistances for Nifty now are at 25222, 25270 and 25310.
The supports for Nifty are at 25104, 25044, 24977 (Mother line support of Daily chart and 24953 Channel bottom. Things are in balance with shadow of the candle slightly positive.
Disclaimer: The above information is provided for educational purpose, analysis and paper trading only. Please don't treat this as a buy or sell recommendation for the stock or index. The Techno-Funda analysis is based on data that is more than 3 months old. Supports and Resistances are determined by historic past peaks and Valley in the chart. Many other indicators and patterns like EMA, RSI, MACD, Volumes, Fibonacci, parallel channel etc. use historic data which is 3 months or older cyclical points. There is no guarantee they will work in future as markets are highly volatile and swings in prices are also due to macro and micro factors based on actions taken by the company as well as region and global events. Equity investment is subject to risks. I or my clients or family members might have positions in the stocks that we mention in our educational posts. We will not be responsible for any Profit or loss that may occur due to any financial decision taken based on any data provided in this message. Do consult your investment advisor before taking any financial decisions. Stop losses should be an important part of any investment in equity.
Continue to short gold Gold rebounded from around 3315 and has now reached above 3340. According to the current structure, gold tends to rebound upward. But the characteristics of the recent market trends are also very obvious. Gold has risen with difficulty, but has retreated very quickly! Overall, there was no continuation in the process of long and short games, which was disorderly fluctuation.
According to the current structure, as long as gold cannot break through the 3350-3355 area and the bulls have not completely gained the upper hand, gold still has the potential to go down and test the 3320-3310 area again. Therefore, for short-term trading, we should not chase gold too much, and we can still try to short gold with the 3345-3355 area as resistance.
Nifty Analysis EOD – June 11, 2025 – Wednesday🟢 Nifty Analysis EOD – June 11, 2025 – Wednesday 🔴
♻️ Déjà vu Day – Bulls Attempt, Bears Resist
For the third consecutive session, Nifty started on a positive note with a 45-point gap-up at 25,134.15, but as has been the pattern lately, early optimism was wiped out instantly, with the index hitting the day’s low of 25,081 within the first 5 minutes.
What followed was a gradual climb as bulls gained some momentum, pushing Nifty to test the 25,200 zone. However, resistance in the 25,200–25,222 band proved too strong. Despite multiple attempts, bulls gave up the level around 13:20, triggering a sharp fall to 25,100.
Post-fall, the market struggled to recover and closed at 25,141.40, up just 37 points from the previous close. It was yet another rangebound, indecisive session, showing that the index is coiling for a potential breakout—but the direction remains uncertain.
🛡 5 Min Chart with Levels
🕯 Daily Time Frame Chart
🕯 Daily Candle Breakdown
Open: 25,134.15
High: 25,222.40
Low: 25,081.30
Close: 25,141.40
Net Change: +37.15 (+0.15%)
📊 Candle Structure Breakdown
Real Body: 7.25 pts → 🟢 Small Green Candle
Upper Wick: 81.00 pts
Lower Wick: 52.85 pts
🔍 Interpretation
Strong intra-day swings in both directions signal high volatility with no control on either side.
Bulls failed at resistance (25,222); bears couldn’t break support (25,081).
The tiny real body with long shadows reflects market indecision.
🔦 Candle Type
⚖️ Spinning Top– Neutral structure with no clear directional conviction.
📌 Key Insight
The market is clearly taking a breather after recent moves.
Watch 25,222 on the upside and 25,080 on the downside — a breakout from either could set the next directional tone.
Bias stays mildly bullish as long as 25,080 holds, but it’s hanging by a thread.
🛡 5 Min Intraday Chart
⚔️ Gladiator Strategy Update
ATR: 239.75
IB Range: 72.9 → Small IB
Market Structure: Balanced
Trades:✅ 10:30 AM – Long Triggered → Target Achieved, Trailing SL Hit (RR: 1:1.65)
📌 Support & Resistance Zones
Resistance Levels
25,116 ~ 25,128
25,180 ~ 25,222
25,285
Support Levels
25,062 ~ 25,070
24,972
24,920 ~ 24,894
24,800 ~ 24,768
💭 Final Thoughts
Market is in a tight tug-of-war. No clear winner yet, but momentum can build quickly once a side gives in.Patience will pay—wait for the range breakout.
🧠 "Pressure builds silently before an explosion—so does the market before a breakout."
✏️ Disclaimer
This is just my personal viewpoint. Always consult your financial advisor before taking any action.

Gold is in a state of shock again, the market is waiting for CPI📰 Impact of news:
1. May CPI data
📈 Market analysis:
Gold is still fluctuating, and the bulls and bears are currently in a stalemate. The market is waiting for the release of today's CPI data. From the 1H chart, the Bollinger Bands are narrowing, and the gold price is above the 3331 middle track. RSI is stuck at 55, and the MACD golden cross green column is narrowing. For short-term trading, pay attention to the resistance of 3340-3350, and the support of 3320-3310 below.
🏅 Trading strategies:
SELL 3340-3350
TP 3320-3310-3300
BUY 3320-3310
TP 3330-3345
If you agree with this view, or have a better idea, please leave a message in the comment area. I look forward to hearing different voices.
OANDA:XAUUSD FX:XAUUSD FOREXCOM:XAUUSD FXOPEN:XAUUSD TVC:GOLD

ETHEREUM (ETHUSD): Bullish Continuation is Coming?!📈ETHEREUM is in a long-term bullish trend, but since late May, it has been consolidating within a horizontal range.
However, the price bounced yesterday and closed above the range's resistance, which is likely to initiate a trend-following movement.
The next resistance level is at 3000.

Gold – Holding Mid-Week Gains Ahead of US CPIGold prices have moved slowly higher at the start of this week, moving from a Monday low at 3293, up to a Tuesday high of 3349, with prices slightly lower this morning at time of writing (3335 – 0700 BST).
Traders have already had much to consider this week, with heightened tensions in the Middle East and Ukraine to focus on, as well as the midnight conclusion of the eagerly awaited second round of trade talks between the US and China.
These talks finished after 20 hours of negotiation over 2 days and have seemingly produced a framework for President’s Trump and Xi to sign off on, with progress made in key areas (supply of rare earth metals and advanced technology), while leaving the wider issues for another time.
This leaves the May US CPI (inflation) release due out later today at 1330 BST as the next major scheduled event that could have an influence on where Gold moves into the Friday close. This release takes on more significance as it is the first month where President Trump's tariffs should start to impact prices paid by US consumers. The extent to which this shows up in the data could be the catalyst for a wider shift in risk sentiment and Gold prices depending on how far the print deviates from expectations.
Technical Update: Considering the Bollinger Mid-Average Support
Since the test of the psychological 3500 level on April 22nd, which held and reversed the sharp acceleration higher in Gold, the latest price activity has seen a consolidation extend, as can be seen on the chart below.
Of course, this type of consolidation can materialise following the type of aggressive activity as that seen into the April 22nd all-time high and may be viewed by traders as an on-going attempt to unwind upside price extremes.
However, traders are always looking forward for insight into where Gold may move next, especially with the May US CPI update release out later today.
With that in mind let’s consider what might be the potential support and resistance levels to focus on?
Potential Support Levels:
Within a positive trending condition such as that recently seen in Gold a rising Bollinger mid-average can provide a support level.
For Gold the mid-average currently stands at 3311 (see chart below) and this may represent a relevant first support level for traders to monitor on a closing basis.
While closing breaks below this type of support level offer no guarantee of further price declines, if it were to happen, it may lead to a more extended phase of price weakness.
This could in turn open further downside tests towards to the next potential support at 3289, which is equal to the 38.2% Fibonacci retracement of May 15th to June 3rd 2025 strength, and if this in turn were to break, the 61.8% retracement which stands at 3225.
Potential Resistance Levels:
While the support at 3311 offered by the rising Bollinger mid-average remains intact on a closing basis, it is possible further attempts at price strength may develop. This could lead to tests of higher resistance levels.
The first resistance level for traders to monitor could be 3392, which is the June 3rd session high. Any potential closing breaks above this resistance may be viewed as a more constructive development, which could then open the possibility of further attempts at price strength towards 3435, which is the May 6th session high (see chart above).
The material provided here has not been prepared in accordance with legal requirements designed to promote the independence of investment research and as such is considered to be a marketing communication. Whilst it is not subject to any prohibition on dealing ahead of the dissemination of investment research, we will not seek to take any advantage before providing it to our clients.
Pepperstone doesn’t represent that the material provided here is accurate, current or complete, and therefore shouldn’t be relied upon as such. The information, whether from a third party or not, isn’t to be considered as a recommendation; or an offer to buy or sell; or the solicitation of an offer to buy or sell any security, financial product or instrument; or to participate in any particular trading strategy. It does not take into account readers’ financial situation or investment objectives. We advise any readers of this content to seek their own advice. Without the approval of Pepperstone, reproduction or redistribution of this information isn’t permitted.

EURAUD: Pullback Trade From Support 📉EURAUD appears to be bullish following a test of significant daily/intraday support.
An inverted head and shoulders pattern has formed on the 4-hour chart, and strong bullish momentum observed this morning suggests positive movement.
I believe the market may retrace to the 1.7600 resistance level.

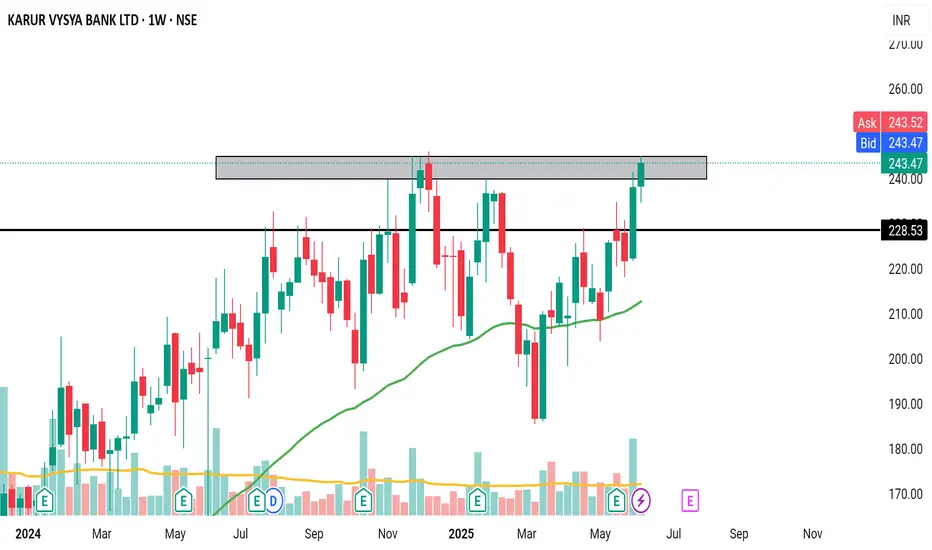
Karur ko watchlist mein rakhna jaroorOn the verge of breaking all time high. Good fundamentals, good volumes.
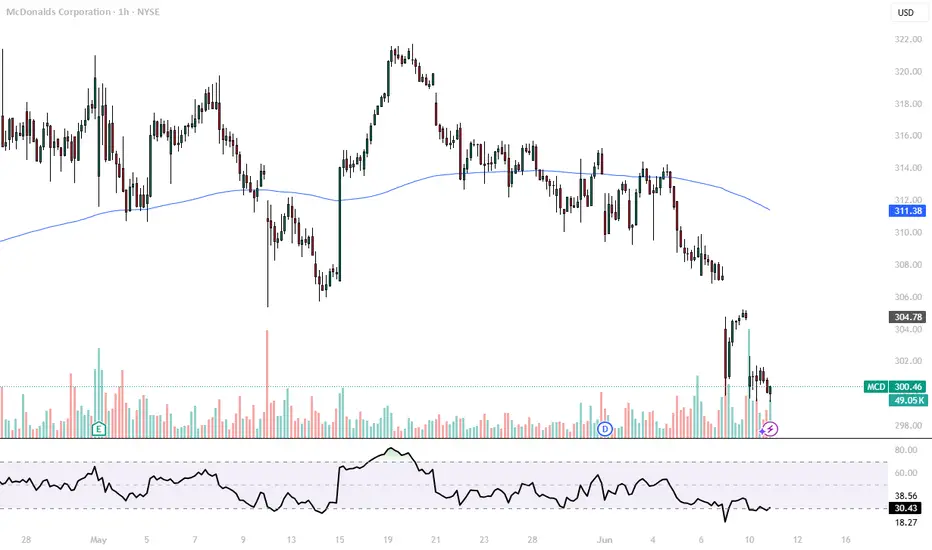
McDonald 1H Long PositionMy self-built strategy has sent me a signal for a long position. I bought a tranche of NYSE:MCD long and will be targeting the upper gaps as my profit targets. The first station will be around $306, and the second target lies between $318 and $319. Currently, the 1H chart is forming a nice divergence and had a huge volume spike, and my strategy indicates a high probability setup for this chart.
Given the current market volatility, I’ll be keeping a close eye on my open position to be able to react quickly if needed.
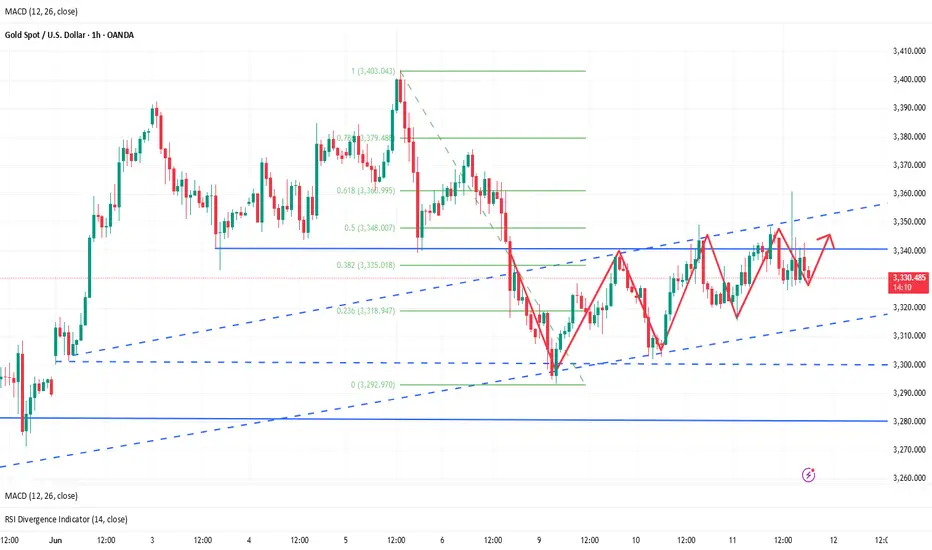
XAUUSD Builds Higher Floors – 3350 Under Pressure1. Recap of Yesterday’s View
In yesterday’s analysis, I noted that Gold appeared to have built a strong floor around 3300, and while the 3340–3350 resistance zone was still capping the upside, the structure hinted at a potential breakout.
2. What Happened Since?
✅ Price once again rallied into resistance and was rejected.
But here’s the key shift:
🔹 This time, the drop only reached 3315, and it was quickly bought back.
🔹 A new higher base around 3320 is now visible.
🔹 Gold is already back into the resistance zone.
3. Technical Implication
This evolving structure signals bullish pressure is building.
Every dip is being bought higher than the last — a classic sign of demand stepping in.
We are now closer than ever to a confirmed breakout.
4. Trading Strategy
📌 A clear break and close above 3350 = breakout confirmed
🎯 Target: 3400 and above
📉 Until then, buying dips into 3315–3320 remains my preferred strategy.
5. Final Thoughts
The yellow metal is coiling tightly under resistance.
The higher floors are shouting one thing: buyers are in control.
Disclosure: I am part of TradeNation's Influencer program and receive a monthly fee for using their TradingView charts in my analyses and educational articles.

WTI Crude Oil Stalls At Technical JunctureCrude oil has enjoyed a decent rally in recent weeks thanks to improved sentiment and OPEC+ scaling back production. Yet momentum turned against bulls on Tuesday, despite positive trade talks between the US and China. Today I discuss whether this could be a turning point for oil, or simply a bump in the road.
Matt Simpson, Market Analyst at City Index and Forex.com

Gold stuck slowly correcting the bearish imbalancesExplained in video. Please let me know if there is anything I missed in this analysis!
Don't forget to like and share 🔑

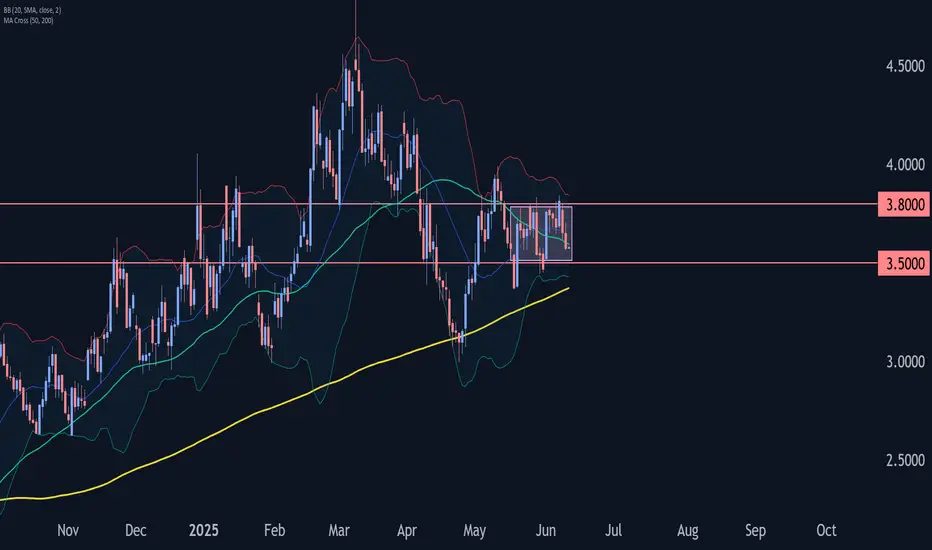
Natural Gas Wave Analysis – 10 June 2025
- Natural Gas reversed from key resistance level 3.80
- Likely to fall to support level 3.50
Natural Gas recently reversed down from the pivotal resistance level 3.80 (which is the upper border of the narrow sideways price range inside which the price has been trading from May).
The downward reversal from the resistance level 3.80 created the daily Japanese candlesticks reversal pattern Bearish Engulfing.
Given the strong daily downtrend, Natural Gas can be expected to fall to the next support level 3.50 (lower border of the active price range, low of waves (2) and 2).
SWDY Neutral Zone AnalysisSWDY stock is in a neutral zone. There is a semi double bottom at the support line 80.742 that might encourage a bullish reversal pattern. In case of increasing it's expected to breach the resistance line 81.139 to reach the 81.209 then the 3rd at 81.420. In case of being a fake sign it'll break the support line at 80.742 to reach the 2nd at 80.578 then the 3rd at 80.531 points.

TMGH Rebound AnalysisTMG Holding trend is reaching a new peak zone at the resistance line 58.624. Historically, it is expected to rebound to the support line at 58.538, then the support line 58.452 and finally 56.734. In conclusion, it increased by 0.17%.

Gold rebounds and repairs, is it a shock or a bull market?📰 Impact of news:
1. Geopolitical situation
2. Impact of the US dollar trend on gold
📈 Market analysis:
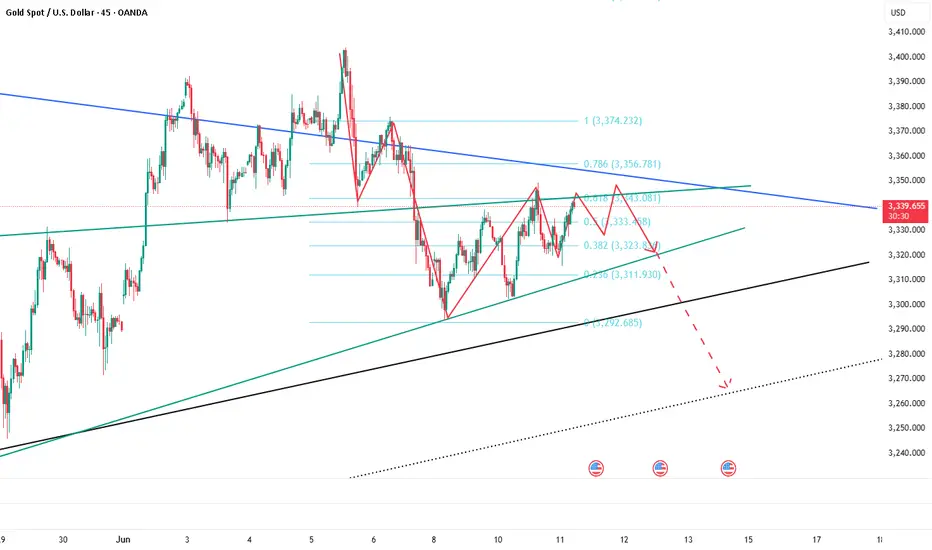
At the gold hourly level, after the pressure in the Asian session in the morning, it directly fell to the vicinity of 3302. The big Yin effectively lost the lower track of the descending flag consolidation channel. The original 3318 line was the confirmation of the channel counter-pressure point, which happened to be the 61.8% split resistance level at that time. At the same time, it lost the middle track. Therefore, we gave a trading idea of looking at the rebound under pressure and continuing to decline in the European session. As a result, the market directly took a V-shaped wash-up and once pulled up to the vicinity of 3342.
The European session fluctuated strongly and rose. Before and after the US session, it took advantage of the retracement to lure the short position, and there is still the possibility of a second pull-up space. Therefore, in the subsequent retracement support level, pay attention to two positions, one is 3322-3324, and the other is the 61.8% division support level of 3318. If it stabilizes, there is a high probability that there will be a second upward space, pointing to 3348. If the pressure here cannot be overcome, the bottom will continue to oscillate back and forth. At that time, it will fall back to see if a secondary low point can be formed to further stabilize the support. If it goes straight through and stands on it, 3293 may already be the short-term low.
On the whole, I still hold short orders before the effective breakthrough of 3345, but at the same time, as the gold price rebounds and moves upward, the short-term support level is temporarily expected to be 3325-3320.
🏅 Trading strategies:
SELL 3335-3345
TP 3325-3315
BUY 3325-3330
TP 3350-3360
If you agree with this view, or have a better idea, please leave a message in the comment area. I look forward to hearing different voices.
TVC:GOLD FXOPEN:XAUUSD FOREXCOM:XAUUSD FX:XAUUSD OANDA:XAUUSD
