Bitcoin: Well defined consolation zoneI have had no real forecast for this market. The imbalances that have presented are formed in a consolidatory manor.
DXY is also in a strange place making it hard as well.
I am seeing sideways motion until we get a nice bullish close
Candlestick Analysis

USD/JPY(20250807)Today's AnalysisMarket News:
Federal Reserve Chairman Kashkari: A rate cut may be appropriate in the short term, and two rate cuts this year are reasonable. Trump: The new Fed governor will likely be temporary, and the appointment will be announced within 2-3 days.
Technical Analysis:
Today's Buy/Sell Levels:
147.40
Support and Resistance Levels:
148.30
147.96
147.74
147.05
146.83
146.49
Trading Strategy:
If the market breaks above 147.40, consider a buy entry, with the first target price being 147.74. If the market breaks below 147.05, consider a sell entry, with the first target price being 146.83

Buy AMD with Confidence. Hello I am the Cafe Trader.
My goal is to help you find great pricing for your long term, and help you finesse your position the markets.
Today we are going to take a closer look at AMD.
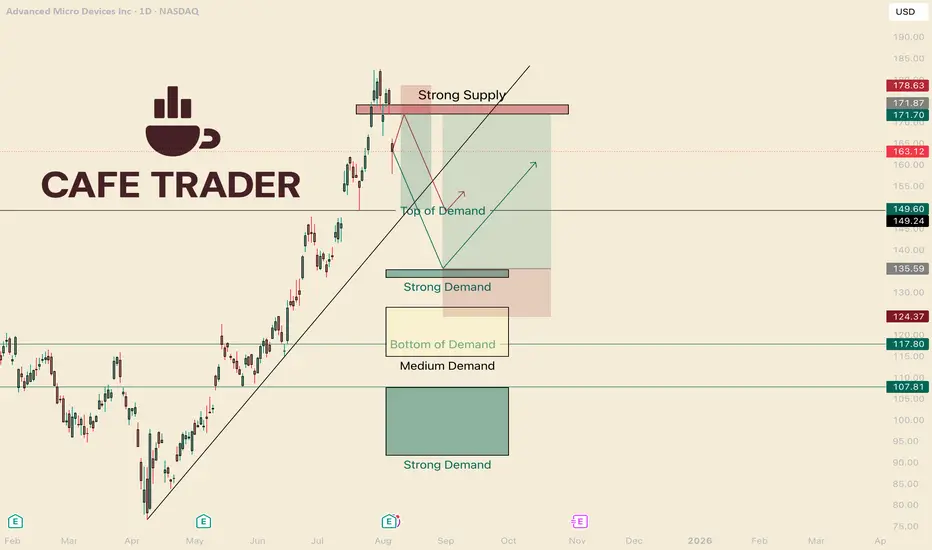
As of right now AMD has just peeled off it's highs, gapping down. Is this where buyers are stepping in? Should you buy now? What are some short term plays that can maximize your profits?
CONTEXT
On the Chart I have labeled different levels of Demand. Knowing where the players are (buyers and sellers) can help us be surgical in price and timing.
In my opinion it is best to trade in terms of scenarios. How players react is just as important as Where they react.
For example: Say you are waiting in a long line for coffee. After some time, the line moves very slowly. We can start to ask questions, like "Why is this taking so long? How long will this take?"
"How" is an important question because we would have to examine how fast, or slow, the line is moving. We are in the dark with how big the current players are in the market.
Knowing "How" will help us position ourselves well with the other players. This lines us up for the best pricing, and helps us be able to get out of a position quick if we are wrong.
SHORT TERM
AMD had mixed earnings. This puts pressure on the buyers but they are still in control.
With a new seller inbound It's probable to hit the "Top of Demand" before breaking new highs.
Short Scenario (Red Line)
I think this will touch quick, reject, and then a few days of sideways before the real move down. You can take a Short right in this zone at 172, but if you buy puts, look to get good pricing. If we move up 4% the contracts might be too expensive to swing 3-5 days. I think after the touch, wait two days or so, and then look to get into some options.
Short (shares)
Entry 172
Stop 178.75
TP 150
Short (options)
Entry is after a test of the strong supply, wait a couple days.
Strike price: 160 Strike (or higher)
Premium: 4 to 1 R
$1.50 4-5 days TP $600
$2.50 6-10 days TP $1000
Long Scenario.
If we do not touch the strong supply before going down, This could drop aggressively. Unlike the previous scenario, I am expecting a hot reaction off the strong Demand area.
Long (shares)
Entry 135.50
Stop 124
TP 172
Long (options)
As soon as it touches, same day and next days contracts, 1 - 2 standard deviations outside the money. I think It can get to 140 minimum the same day.
Strike 136-137
Premium: 2.50-3.50 (if you get it cheaper, great!) Really this will depend on if it touches on a Monday, or a Friday lol.
TP 150% - 400%
LONG TERM
These prices should align with your own sentiment and Due Diligence of AMD.
Fair: $149.50 (Top of Demand)
Deal: $133.50 - 135.50 (Strong Demand)
Steal: anything under 108
(2nd Strong Demand)
Don't forget to Boost and follow!
More insight to come, and make sure you check out all my channels.
Much Love and Happy Trading!
@thecafetrader
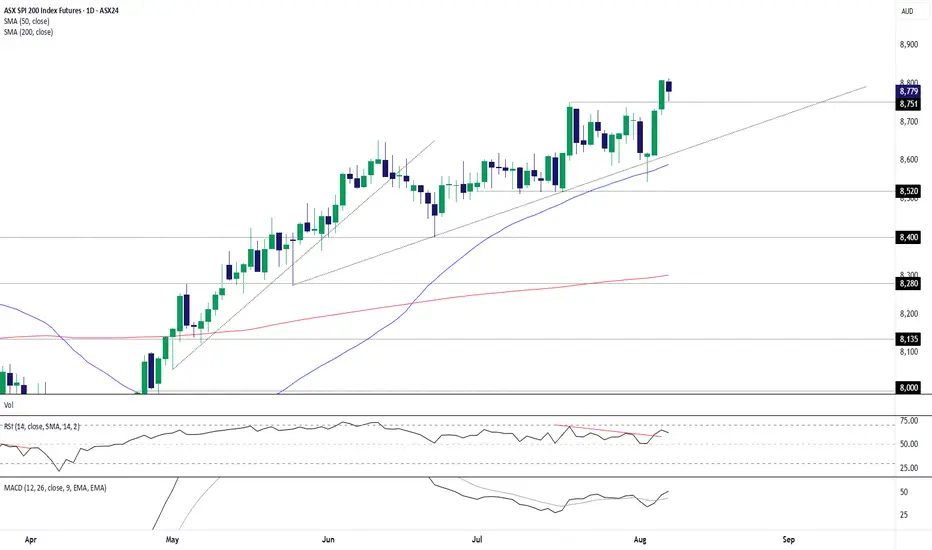
ASX 200 Futures: Back-Test Bounce Keeps Bulls in ControlASX 200 futures remain a buy-on-dips prospect, putting the contract on track to test the 9000 level soon.
Already sitting in an established uptrend, the latest leg higher coincided with a three-candle morning star pattern being completed on Tuesday, providing a bullish signal that goes some way to explaining the price taking out the former record high of 8751 a day later. The back-test and bounce from this level overnight suggest the path of least resistance remains higher. It also provides a level to build bullish setups around should we see a retracement to the level.
If we see a pullback towards 8751, longs could be established above with a stop below for protection. Wednesday’s high and 8900 are levels of note for those contemplating the trade, although 9000 comes across as a more appealing target.
Momentum indicators are also signalling growing topside pressure, with RSI (14) breaking its downtrend above 50 while MACD has crossed the signal line from below in positive territory. Combined, it provides a backdrop that favours a bullish bias.
Good luck!
DS
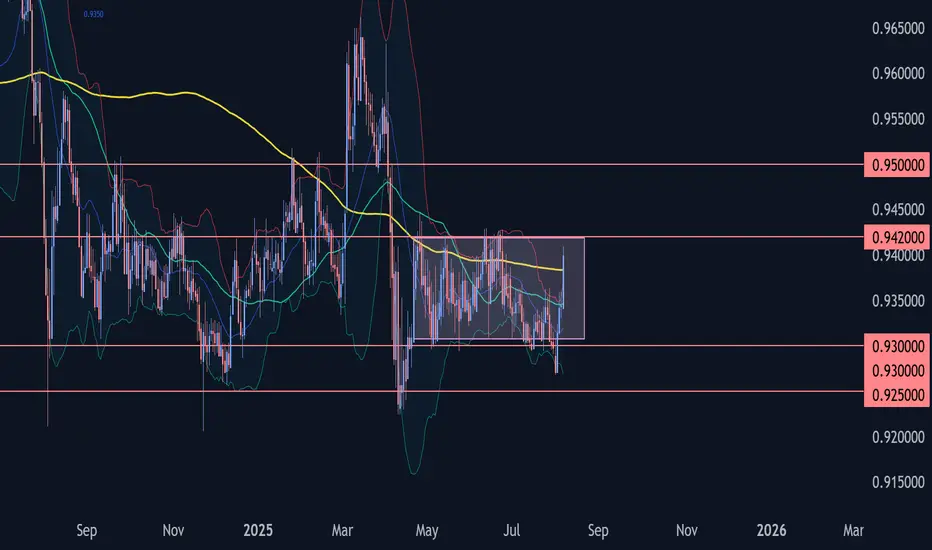
EURCHF Wave Analysis – 6 August 2025
- EURCHF rising inside sideways price range
- Likely to test resistance level 0.9420
EURCHF currency pair recently reversed from the support area between the strong support level of 0.9300 (lower border of the sideways price range from April) and the lower daily Bollinger Band.
The upward reversal from this support area created the clear daily Japanese candlesticks reversal pattern Bullish Engulfing – which started active impulse wave 3.
Given the strongly bearish Swiss franc sentiment seen today, EURCHF can be expected to rise to the next resistance level 0.9420 (upper border of the active sideways price range).
EURUSD Wave Analysis – 6 August 2025
- EURUSD reversed from support area
- Likely to rise to resistance level 1.1755
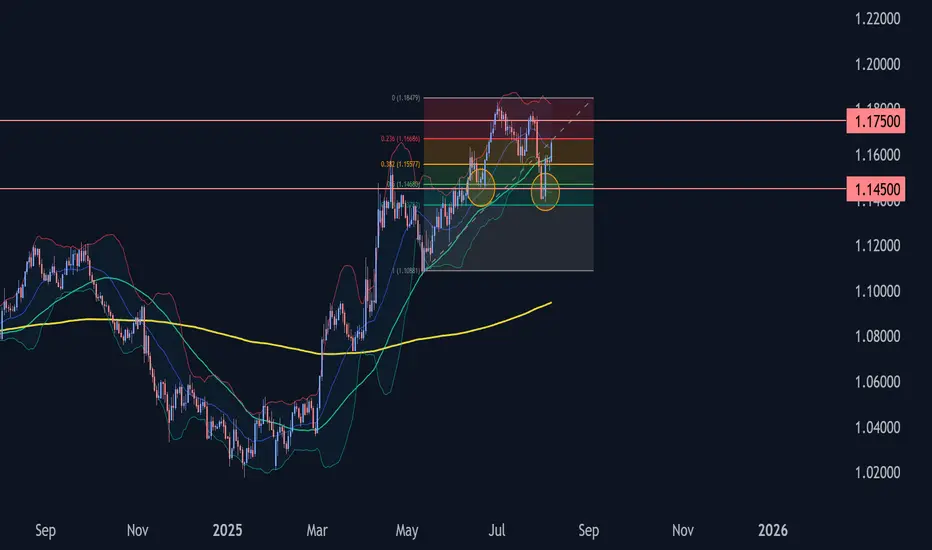
EURUSD currency pair recently reversed from the support area between the strong support level of 1.1500 (former low of wave iv from June), lower daily Bollinger Band and the 50% Fibonacci correction of the upward impulse 1 from May.
The upward reversal from this support area created the clear daily Japanese candlesticks reversal pattern Morning Star.
Given the clear daily uptrend and bearish us dollar sentiment seen today, EURUSD can be expected to rise to the next resistance level 1.1755.
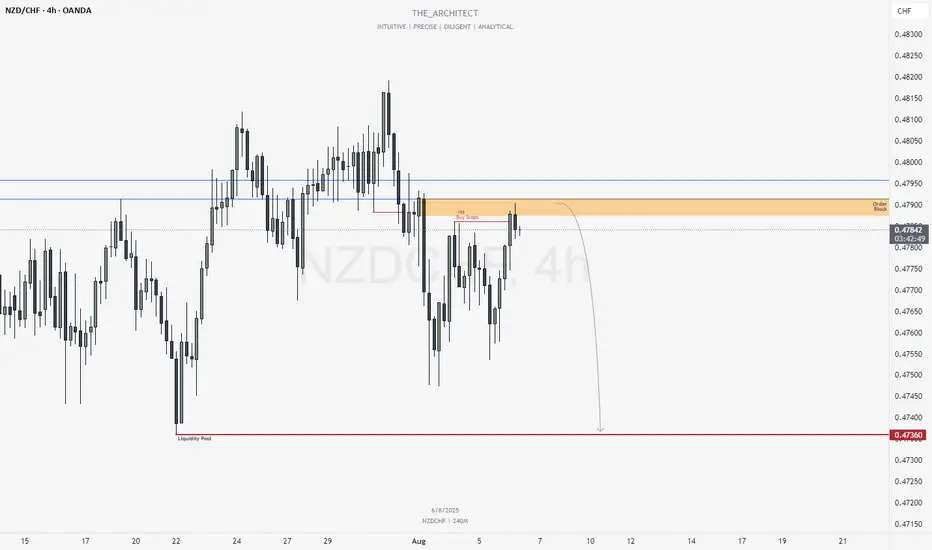
NZDCHF: Selling Within Bearish Order Flow & Order BlockGreetings Traders,
In today’s analysis of NZDCHF, recent price action confirms the presence of bearish institutional order flow. As a result, we aim to align ourselves with this directional bias by identifying strategic selling opportunities.
🔍 Key Observations on H4:
Bearish Market Structure Shift
The H4 timeframe has confirmed a bearish shift in market structure, giving us a solid framework to seek short setups aligned with institutional momentum.
Bearish Order Block
Price has recently reached a bearish order block, expected to act as a strong resistance zone for potential downside continuation.
Liquidity Engineering
Buy stops on H4 have been taken out—this sweep may be used to order the pair against liquidity, favoring bearish continuation.
📈 Trading Plan:
Entry Strategy
Monitor lower timeframes (e.g., M15 and below) for bearish confirmation setups within or near the bearish order block.
Target Objective
Our draw on liquidity remains the liquidity pool located at deeper discount levels, in alignment with the prevailing short bias.
For a detailed market walkthrough and in-depth execution zones, be sure to watch this week’s Forex Market Breakdown:
Stay disciplined, trust your confirmations, and manage your risk wisely.
Kind regards,
The Architect 🏛️📉
NZDCAD SHORT Market structure bearish on HTFs DW
Entry at both weekly and daily
Weekly Rejection at AOi
Previous Weekly Structure Point
Daily Rejection at AOi
Daily EMA retest
Previous Structure point Daily
Around Psychological Level 0.82000
H4 Candlestick rejection
Levels 3.23
Entry 100%
REMEMBER : Trading is a Game Of Probability
: Manage Your Risk
: Be Patient
: Every Moment Is Unique
: Rinse, Wash, Repeat!
: Christ is King.

Gold Bulls Unshaken, 3400 in FocusGold prices retreated from a high of 3385 today, currently hitting a low near 3358. How far will gold fall? Are the bears back in control? I'm not worried about a gold pullback, but rather a lack of one, because only a pullback can provide a good entry opportunity. Clearly, I remain bullish on gold and optimistic about it reaching the 3400 mark.
Because gold fell all the way to around 3358, some voices in the market began to tout the strong return of the bears, but I remained unmoved. When many people were once in self-doubt, I was quietly taking advantage of the gold pullback to accumulate funds in batches and pick up bargains. We can clearly see that gold did not destroy the bullish structure during the decline, and as gold rebounded, the 3360-3350 area has become a dense trading area, indicating strong buying support. After the technical top and bottom conversion, it has become a relatively solid support area. It may be difficult for gold to fall below this support area in the short term.
So, why has gold repeatedly encountered resistance and retreated? I believe that gold has encountered resistance and retreated in the 3385-3390 area many times in order to repeatedly test the effectiveness of support and consolidate the strength of support. It is also to increase liquidity during the retreat period, thereby accumulating more upward momentum so that gold can rise further and break through the 3400 mark.
So I still hold a long position in gold, and I have not lost confidence in the gold bulls. On the contrary, I still expect that gold will be able to hit 3400 in one fell swoop after repeatedly testing the support, or even continue to rise to the 3420-3430 area.

CADJPY SWING: SHORT OPPORTUNITYHi there,
Just like my short expectation on the GBPJPY analysis I shared, I would like to see CADJPY trade lower.
My reasons are well annotated on the chart. But I'd urge you to look at the 3M chart and see where we are in terms of support and resistance levels.
Anyways, I wish you good trading.
Cheers,
Jabari

PWAS/USDT BIG PUPMPBreak down trend in daily time frame & now probably Big pump for Paws this bad shit coin is coming!

EURJPY: Classic Bullish Pattern 🇪🇺🇯🇵
There is a high chance that EURJPY will continue growing.
A bullish breakout of a neckline of an inverted head & shoulders
pattern leaves clear bullish clues.
Next resistance - 171.9
b]❤️Please, support my work with like, thank you!❤️
I am part of Trade Nation's Influencer program and receive a monthly fee for using their TradingView charts in my analysis.

The market trend is still there, go long on the pullback#XAUUSD
Yesterday, gold experienced a V-shaped reversal: it was blocked at the 3382 line in the morning and then fluctuated and fell, then it fell to the support near 3349 and stabilized and rebounded, then rebounded to near 3390 in the evening and closed with a doji on the daily line. Judging from the overall trend, the bullish pattern has not changed.
Gold has limited room for decline in the short term, and a sharp drop is unlikely. Today's market tends to adjust and correct first before continuing to rise. The adjustment is only short-term, and is more to give everyone enough opportunities to get on board. The focus of the market below is 3375-3360, with the target looking at yesterday's high around 3390-3395. A break is expected to extend to the 3400-3420 area.
🚀 BUY 3375-3360
🚀 TP 3390-3395

Dollar Index (DXY): Important Bearish BreakoutThe Dollar Index has fallen below a key daily/intraday support level,
which has now become resistance.
A bearish trend is likely to persist, with the next target set at 98.15.

Correction first and then rise during the day, TP3400Yesterday, gold hit the bottom near 3350 and then quickly rose to break the high. It fell back slightly in the evening and closed with volatility. The daily line closed with a long lower shadow bullish line. The short-term correction process has been completed, and there is still momentum for an upward impact. The overall structure is still a bullish trend. Focus on 3365-3355 below. As long as the bullish thinking above this level remains unchanged, any decline will provide an opportunity to enter the market. The target can be around yesterday's high of 3390. Once it breaks through 3390, the gold price is expected to reach 3405-3415.
OANDA:XAUUSD

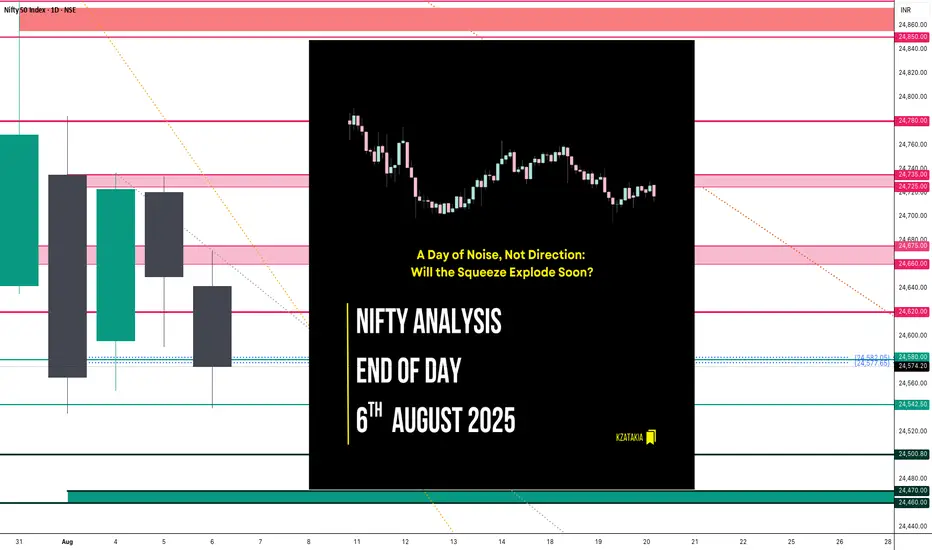
Nifty Analysis EOD – August 6, 2025 – Wednesday 🟢 Nifty Analysis EOD – August 6, 2025 – Wednesday 🔴
A Day of Noise, Not Direction: Will the Squeeze Explode Soon?
Nifty started flat with indecisive vibes, struggling initially around the 24,660 ~ 24,675 zone. After multiple failed attempts to hold, it slipped toward 24,580 — a cluster of PDL + S1 + Key Support — and broke below, forming the IB Low.
A quick bounce followed, but the index was firmly rejected near the VWAP + CPR + Fib zone, pushing it to a new day low at 24,544. Repeated intraday bounces faced selling pressure around 24,620, while 24,540 provided solid support — creating a tight intraday range.
Despite a perfect CPR setup for breakout, the market moved within just 132 points, the narrowest range in the last 4 sessions. A compression phase is building; breakout traders may soon get their moment.
📉 5 Min Time Frame Chart with Intraday Levels
🗣 Voice of the Intraday Option Buyer
Trend direction flipped multiple times — bearish to bullish and vice versa.
PDL + S1 zone experienced repeated fakeouts.
Low conviction moves on both sides frustrated momentum setups.
RBI event also not enough strong or trigger to guide directional bias.
Bank Nifty broke IB Low → IB High, closed strong; Nifty stayed muted.
Weekly expiry ahead — theta decay took control.
Many traders, including myself, anticipated a double inside bar breakout — but the trap continued.
Last 4 sessions (since Aug 1) have been painful for intraday option buyers — but it's all part of the game.
📉 Daily Time Frame Chart with Intraday Levels
🕯️ Daily Candle Breakdown
Open: 24,641.35
High: 24,671.40
Low: 24,539.20
Close: 24,574.20
Change: −75.35 (−0.31%)
Candle Structure:
Real Body: Red candle (67.15 pts)
Upper Wick: 30.05 pts
Lower Wick: 35.00 pts
Interpretation:
Attempted upside early on but couldn’t hold.
Both wicks show intraday tug-of-war; red close confirms sellers still in control.
Repeated rejection from 24,660–24,675 highlights weak bullish attempts.
Candle Type:
Bearish indecision candle — resembles an Inverted Hammer, indicating weakness despite dip buying attempts.
🔍 Nifty Short-Term View – As of August 6, 2025
Last 5 sessions show directional fatigue and failed bullish attempts above 24,700.
Two consecutive inside bars signal tight range and pending breakout.
Lower closes and long lower wicks = sellers dominate, but buyers defend dips.
Break below 24,535 = fresh selling.
Close above 24,660 = potential short-covering rally.
📌 Conclusion:
Nifty is coiling — a strong breakout may soon end this sideways-to-weak grind.
🛡 5 Min Intraday Chart
⚔️ Gladiator Strategy Update
ATR: 195.66
IB Range: 91.70 → Medium
Market Structure: Balanced
Trade Summary:
⏱ 10:35 AM – Short Entry → SL Hit
⏱ 12:15 PM – Long Entry → SL Hit
📏 Today's CPR Setup presenting...
Value Relationship: Inside Value → Breakout-Ready
Avg CPR Width: 37.54
Today’s CPR Width: 8.10 (🟠 21.58%)
CPR Type: Narrow → Perfect setup for big expansion
⚠️ Today’s setup didn’t deliver, but backtests show such narrow CPRs often explode in the following session.
📌 Support & Resistance Levels
🔼 Resistance Zones:
24,620
24,660 ~ 24,675
24,725 ~ 24,735
24,780 ~ 24,795
24,860 ~ 24,880
🔽 Support Zones:
24,542 ~ 24,535
24,500
24,470 ~ 24,460
🧠 Final Thoughts
The market is in consolidation mode with narrowing range. The double inside bar setup points to an imminent move — be prepared for a breakout trade soon. Don’t lose patience; big days often follow tough ones.
🛡 Disclaimer
This analysis is shared for educational purposes only. It is not trading advice. Please consult your financial advisor before making any trading decisions. Always trade with proper risk management.
GBPNZD: Another Bullish Wave Coming 🇬🇧🇳🇿
GBPNZD respected a strong rising trend line on a daily.
The price formed a cup & handle pattern on that
and violated its horizontal neckline yesterday.
I think that another up movement is ahead.
Goal - 2.26
❤️Please, support my work with like, thank you!❤️

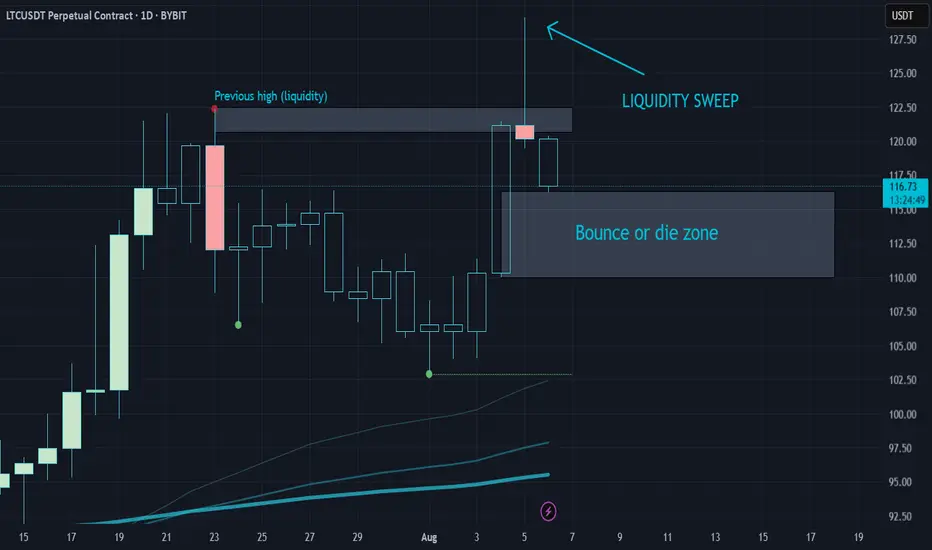
Litecoin cleared the previous high liquidity and now is losing sIf CRYPTOCAP:LTC doesn't bounce from this area, the most likely outcome is that it reverts the whole pump.
Litecoin cleared the previous high liquidity and now is losing steam, doing what it likes to do:
Mean revert pumps.
EURJPY: Rejection Block Support Fuels Bullish momentum!Greetings Traders,
In today’s analysis of EURJPY, recent price action confirms the presence of bullish institutional order flow. As a result, we aim to align ourselves with this directional bias by seeking high-probability buying opportunities that target the long-term highs, where a significant liquidity pool resides.
Key Observations:
Weekly Timeframe Insight:
Last week, price retraced into a weekly bullish Fair Value Gap (FVG), which has acted as a strong support zone. This reaction has initiated a bullish response across lower timeframes, validating the weekly FVG as a meaningful area of institutional demand.
H4 Bullish Market Structure Shift:
Following the weekly bounce, the H4 chart presented a clear bullish Market Structure Shift (MSS), signaling the onset of upward momentum. Price then retraced into an extreme discount, where it found support at a well-defined Rejection Block—an institutional array we expect to hold as a launchpad for further bullish continuation.
Trading Plan:
Entry Strategy:
Monitor the Rejection Block zone for bullish confirmation setups on lower timeframes (M15 and below) to validate potential long entries.
Target Objective:
The draw on liquidity remains at higher premium levels, with the liquidity pool above the long-term highs serving as our primary objective.
For a detailed market walkthrough and in-depth execution zones, be sure to watch this week’s Forex Market Breakdown:
As always, exercise patience, wait for confirmation, and maintain strict risk management.
Kind regards,
The Architect 🏛️📈

CHFJPY: Pullback From Resistance Confirmed?! 🇨🇭🇯🇵
CHFJPY may retrace from a key daily horizontal resistance.
A breakout of a support line of a consolidation range
on that on an hourly time frame provides a strong intraday confirmation.
Goal - 182.42
❤️Please, support my work with like, thank you!❤️
I am part of Trade Nation's Influencer program and receive a monthly fee for using their TradingView charts in my analysis.

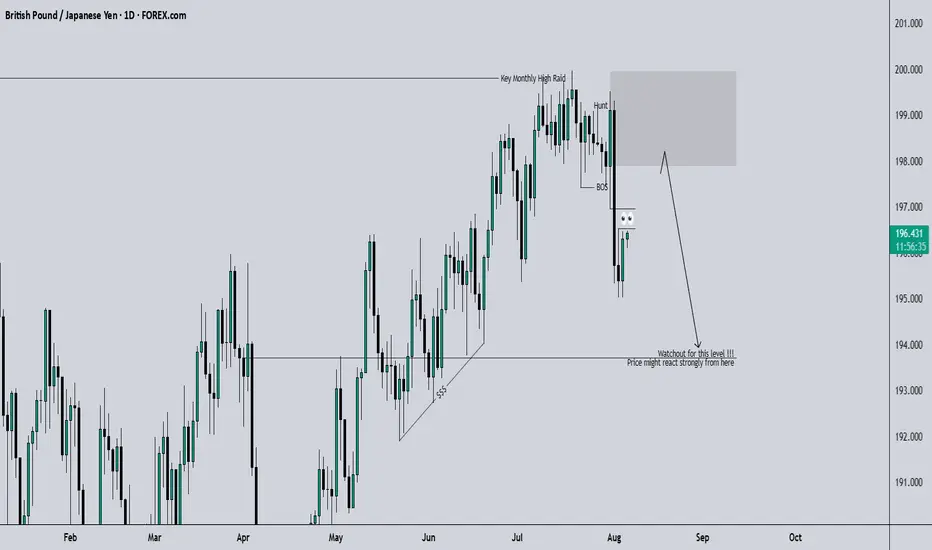
GBPJPY SWING: SHORT-TERM BEARISH OPPORTUNITYHi there,
Overall for the 3rd quarter of the year, I speculate a bullish candle close, however, for price to rally, it needs to trade lower to gather the needed liquidity. Hence, the short-term bearish move.
If you turn your chart to the 3M, you will see the wick of the last quarter's candle which translates to the Monthly OB that price is most likely to trade into after running multiple stops.
Check out my next post on CADJPY.
Cheers,
Jabari
EU Scalp (wrong bias) - Trump speech Came into the day with a neutral bias looking for some kind of retracement deeper into the hourly leg.
After a bearish London with bearish H1 order flow showing (H1 wicks + rejecting the Order block) we sell our liquidity shakeout right in the middle of New York session.
It's really got me interested was how close we came to the daily DOL (or so I thought) before retracing

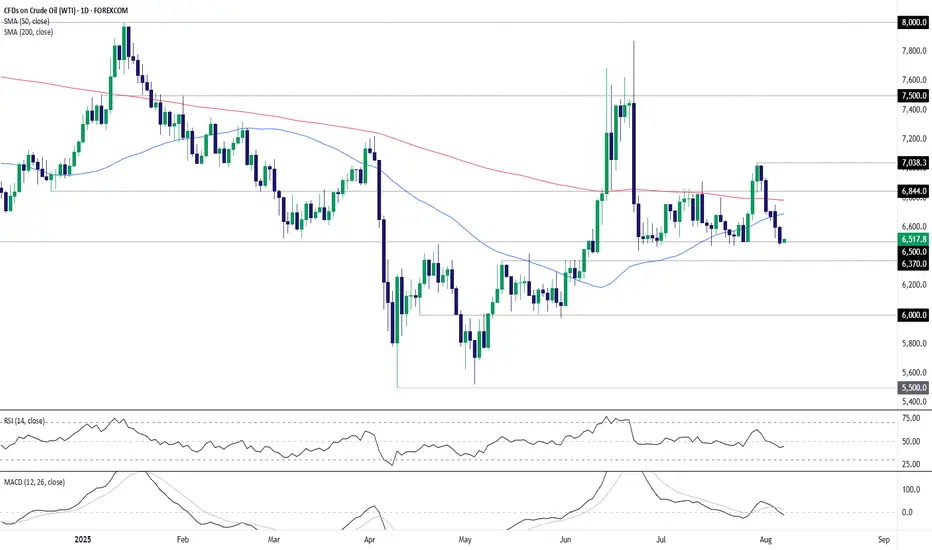
WTI Crude: Bulls on the Back FootWTI crude oil has found plenty of willing buyers beneath $65 per barrel recently, often acting as a launchpad for abrupt squeezes higher. But with supply gushing as OPEC+ returns 2.2 million barrels per day to market at a time when concerns about the U.S. economy are growing, whether that continues remains debatable—especially after the sharp $5-plus slide over the past week.
With the price closing at its lowest level since early June on Tuesday, traders should be alert to the risk of an extension of the bearish move.
Given how often the price has been bid up beneath $65, the inclination is not to act immediately if Tuesday’s lows are taken out. Instead, $63.70 is a level to watch, having acted as resistance through May and June. A break below there would create a cleaner setup for shorts, allowing positions to be initiated with a stop just above for protection. $62.00 saw some action earlier in the year, but $60 looks the more compelling downside target.
RSI (14) is beneath 50 while MACD is negative, having already crossed below the signal line—both hinting that selling rallies may work better than buying dips near term.
Of course, if the contract can’t break $65 meaningfully despite the bearish backdrop, the setup could be flipped, allowing for longs to be established above with a stop beneath, targeting either the 200-day moving average or $68.44 resistance.
Good luck!
DS