NASDAQ Still failing to secure meaningful closes above the rangeAll explained in video. Please let me know if there is anything I may have missed in this analysis.
Thanks and share with anyone who may be interested 🔓
Candlestick Analysis

EURJPY ANALYSIS After seeing the previous week close really bullish on the daily and weekly timeframes, we could expect that momentum to continue pushing but since the pair is at a HH area on the daily we could expect a pull back before the bullish move kicks in

GBPUSD ANALYSISAfter seeing the previous week close above 135.000 we could expect a retest of that area before the market continues to the upside, but in the mean time the daily and 4hr are currently showing bearish type setups which could be a sign that the retracement on the weekly could form

EURCHF H4As we can see , we had sell side Liquidity that have been taken out after that , we had MSS (market structure shift ) which creates inducement that forms SMT ( smart money technique). After SMT market goes up creating inversion fair value gap. And we took our entry at our order block.

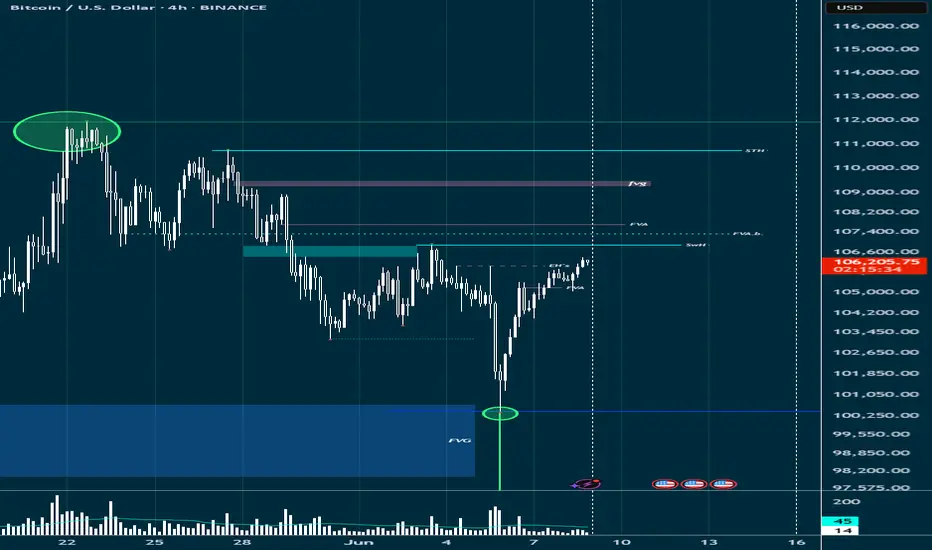
BTC - Weekly outlook - Bullish.Following on from my HTF analysis on BTC, same shit applies you little reprobates! - BTC tapped into a weekly FVG on Thursday, taking out 4 hour and daily liquidity levels in the process.
Since tapping the Weekly FVG, price has printed a strong bullish reversion, back into the 4H and Daily areas of potential resistance. Right now, is crunch time (so to speak) - BULLS NEEDS TO SEE THE DAILY PREM ARRAYS BEING DISRESPECTED.
So far, the 4H FVA has been respected, with LTF disc arrays being respected also, with that being said, the next logical targets within reach are the daily (light blue) PDA's above current price action. Asian session to run these highs? Possibly, bulls need to see strong support created in these areas if they are to realistically find levels to move higher from.
Biggest question is how much supply is residing above these levels? IF WE REACH TO THE DAILY SWING HIGH, WE NEED TO OBSERVE FOR LTF SIGNALS OF A SWEEP FORMING - ideal scenario is for price to RUN the Daily SwH to the continue towards the STH - THESE ARE OUR TARGETS FOR THIS WEEK. - Only thing that will change my bias is if the daily sweeps the SwH at 106.9K (pretty much 107K, another key level for analysts).
Happy Trading people, don't forget - trade what we SEE, not what we THINK!
GBPJPY UPDATE!!Good day traders, I am back again with an update and this time it's on GBP/JPY. On the 1st of June I posted a setup but I mentioned that I will explain it later because I will be able to make my point clearer and easy to understand.
When this setup was posted I had that daily order block in mind, only because I needed to see it revisit the order block for the last time before price could make a run for that internal liquidity resting inside an unfilled FVG(BISI). We can also use that thought as confluence when looking for short term reversals or partial exits. Just by taking a look on the chart I posted again I will put it in the description below, you can see in the sell side of the chart we have a lot of equal lows and ICT teaches us that price looks for relative lows/equal lows and old lows.
On the daily TF price is currently inside a bearish order block and what we do not wanna see is price going over the wick of that wick of a candle that was booked on the 29th of May. We are also inside the premium zone of the wick meaning we can expect to run from there to our objectives below. As always my first objective is always the internal liquidity and that is only because that internal liquidity are my LTF | Highs/Lows.
On the 4H price is inside a balanced price range again that's in my favour meaning I have to note it. ICT teaches that we always wanna trade towards the direction where all our PD arrays are lining up and in this case, it's in the sellside, I believe we are in the starting phase of ICT's sell model.
My name is Teboho Matla but you...you don't know me yet!!

Long trade
30min TF overview
📘 Trade Journal Entry — PEPEUSDT (Buyside Trade)
🗓 Date: Sunday, 8th June 2025
⏰ Time: 3:15 PM
📍 Session: NY Session PM
📈 Timeframe: 15-Minute
🎯 Target: This Week’s Open (0.00001181)
📊 Risk-Reward Ratio: 8.0
🔹 Trade Details:
Entry Price: 0.00001173
Take Profit: 0.00001181 (+0.68%)
Stop Loss: 0.00001172 (−0.09%)
15min TF overview
🔹 Technical Breakdown:
Bias: Buyside pressure observed with steady reclaim of mid-range levels.
Market Context: Entered during a slow grind upwards toward the weekly open.
Confluence Factors:
Clean 15m structure supported upward continuation.
RSI was rising with momentum, confirming higher lows.

Long trade
15min TF overview
📘 Trade Journal Entry — PEPEUSDT (Buyside Trade)
🗓 Date: Sunday, 8th June 2025
⏰ Time: 2:00 PM
📍 Session: NY Session PM
📈 Timeframe: 10-Second Chart (High-Frequency Scalping)
🧠 Confirmation Tool: RSI Indicator for directional bias
🎯 Result: ✅ Target hit successfully
🔹 Trade Details:
Entry Price: 0.00001173
Take Profit: 0.00001179 (+0.51%)
Stop Loss: 0.00001172 (−0.09%)
Risk-Reward Ratio: 5.10
10 sec TF entry
🔹 Technical Breakdown:
RSI Confirmation: RSI divergence spotted on microstructure, indicating short-term oversold conditions. Entry Trigger: Price action reclaimed the short-term support zone while RSI reversed upward from the 30-level—execution: Executed immediately after a bullish micro-candle and RSI confirmation crossover.
10 sec TF entry overview

XAU/USD 09-13 June 2025 Weekly AnalysisWeekly Analysis:
Swing Structure -> Bullish.
Internal Structure -> Bullish.
Analysis and bias remains the same as analysis dated 16 March 2025.
In my analysis dated 27 October 2024 I mentioned (below) that price could potentially print higher-highs in order to reposition CHoCH. This is exactly how price printed. CHoCH positioning has been brought significantly closer to current price action. CHoCH positioning is denoted with a shortened blue dotted horizontal line.
The remainder of my analysis and bias remains the same as analysis dated 09 February 2025.
Price has printed a further bullish iBOS.
Price is currently trading within an internal low and fractal high. CHoCH positioning is denoted with a blue dashed line.
Price Action Analysis:
In my analysis dated 27 October 2024, it was noted that the first sign of a pullback would be a bearish Change of Character (CHoCH), indicated by a blue dotted line. Price's consistent upward momentum had repositioned previous CHoCH much closer to recent price levels as expected for weeks. Current CHoCH positioning is quite a distance away from price, therefore, it would be viable if price continued bullish to reposition ChOCH.
Note:
It is highly unlikely price will "crash" as many analysts are predicting. My view is this is merely a corrective wave of the primary trend.
Given the Federal Reserve's dovish policy stance alongside heightened geopolitical risks, market volatility is likely to remain elevated, influencing intraday price swings.
Price could also be driven by President Trump's policies, geopolitical moves and economic decisions which are sparking uncertainty and potential repricing of Gold.
Weekly Chart:
Daily Analysis:
Swing -> Bullish.
Internal -> Bullish.
Analysis and Bias remains the same as Analysis dated 11 May 2025.
Since my last weekly analysis price has finally printed a bearish CHoCH.
This is the first indication, but not confirmation of bearish pullback phase initiation.
Price is now trading within an established internal range.
Price should now technically trade down to either discount of 50% internal EQ, or Daily demand zone before targeting weak internal high, priced at 3,500.200.
Note:
The Federal Reserve’s continued dovish stance, coupled with escalating geopolitical uncertainties, is expected to sustain elevated market volatility, influencing both intraday and broader trend developments.
Additionally, price action may be further shaped by U.S. policy decisions, including measures enacted under President Trump. Shifts in geopolitical strategy and economic policymaking could introduce further uncertainty, contributing to the ongoing repricing dynamics within the gold market.
Daily Chart:
H4 Analysis:
-> Swing: Bullish.
-> Internal: Bullish.
Analysis and bias remains the same as analysis dated 23 April 2025
Price has now printed a bearish CHoCH according to my analysis yesterday.
Price is now trading within an established internal range.
Intraday Expectation:
Price to trade down to either discount of internal 50% EQ, or H4 demand zone before targeting weak internal high priced at 3,500.200.
Note:
The Federal Reserve’s sustained dovish stance, coupled with ongoing geopolitical uncertainties, is likely to prolong heightened volatility in the gold market. Given this elevated risk environment, traders should exercise caution and recalibrate risk management strategies to navigate potential price fluctuations effectively.
Additionally, gold pricing remains sensitive to broader macroeconomic developments, including policy decisions under President Trump. Shifts in geopolitical strategy and economic directives could further amplify uncertainty, contributing to market repricing dynamics.
H4 Chart:

NQ tumbles?Good day traders, I don't know why but I get a bit scared when it comes to analyzing NQ. I always doubt myself with it.
On the weekly TF price is trading inside an order block and for the past two weeks price has visited the order block two times. In the two times that price revisited the order block it failed to close above the midpoint indicating the strength of the order block, going into the new week I am going to use the discount zone of the OB+ as my resistance.
On the daily TF before I say much, THERE IS A GAP, and price did not trade to it since opening high on the 12th May. That gap is my target and I want to see price go and fill that volume imbalance as ICT calls it.
Still on the daily TF...when you read price for past two weeks on NQ, you'll quickly come to a realization that price has been expanding higher since Tuesday 3rd June, but expanding to where?...well liquidity resting above the high of the candle booked on the 29th of May.
Now on the 4 hour TF things are opening up and price is becoming clearer and it goes to show the importance of multi time frame analysis. The lows of Tuesday and Thursday make the relative equal lows that are shown on the chart. The internal liquidity shown below is my short term target or TP1. The red triangle represents that 4H inverse FVG and once price is trading below the inverse any movement inside that inverse should show weakness!

ETH Monthly Masterplan – From Frogs to the Moon 🐸 1. Miracle’s Take – The Legendary Leap Begins!
“Yo yo yo! Miracle here – and ETH just jumped outta the swamps straight into the order block jungle! 🐸💥”
We kissed the Order Block Buy zone like it’s the holy ground of memes 📿
3 Buy Levels hit – frogs were loading while normies were panicking 🤡
Price now chilling near the FOMO Zone – and trust me, most are buying now that it's too late
First target: 4,100 💸
Second target: 5,700+ – That’s where meme dreams start getting real!
Ultimate dream: 6,100+ – That’s a 250% leap... Frogs do fly 😤
💣 But yo, don’t ignore that massive Sell Order Block between 4.1K and 5K.
"Miracle Rule: You don't chase green candles – you trap 'em in green nets." 🎣
🟥 If we fall? Warning zone at 1.9K and hell no below 1.3K – STOP LOSS city 🚨
🐸 “ETH isn’t just a coin. It’s the ticket to meme kingdom.”
🔍 2. Clean Technical Breakdown – Analyst Mode
ETHUSD Monthly shows a textbook rebound from a long-term demand zone (“Order Block Buy”)
Three strong entry levels respected:
$2,142
$2,269
$2,394
Current price is retesting FOMO zone, last seen as local resistance
First Take Profit: $4,100
Second Take Profit: $5,718
Final fib extension target: $6,116 (254% from lows)
“Price must break and close above $2,750 with volume for confirmation.”
A monthly close below $1,942 is a strong warning
Final invalidation at $1,331, where structure is broken
“Respect the order blocks. Trade the levels.”
🎭 Which side are YOU on this time?
📈 Logical Analysis OR 🐸 Meme Mastery?
💬 Type #TeamMiracle or #TeamAnalyst and let the ETH prophecy unfold!
🎬 @TradeWithMky – where altcoins speak louder than Bitcoin!
#ETHtoMoon #EthereumMonthly #TradeWithMky #AltcoinSeason #MemeAnalysis

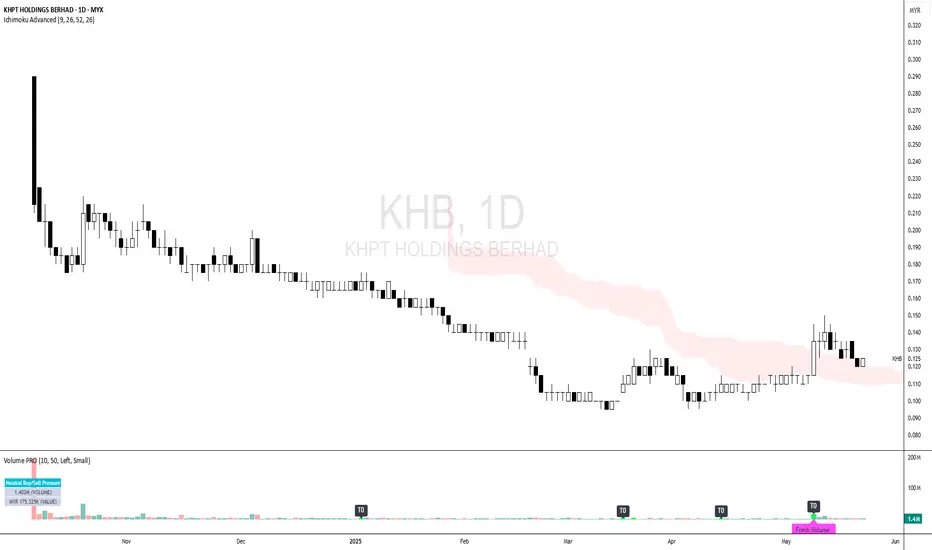
KHB - Downtrend Phase is FINISHED ?KHB - CURRENT PRICE : RM0.125
KHB was in downtrend since its listing day on 08 OCTOBER 2024. Recently the stock price rise with a bullish candlestick on 09 MEI 2025. The stock is making higher high and higher low. This indicates that the downtrend may end. At current price, it gives an attractive RISK REWARD RATIO.
ENTRY PRICE : RM0.125
TARGET PRICE : RM0.140 (+12%) and RM0.150 (+20)
SUPPORT : RM0.115 (-8%) --- The low of long white candle
Bitcoin plummets!!Good day traders, I am back with yet another update on BTC/USD. My last update on bitcoin what I was expecting price to do unfortunately did not happen as price was very weak, I had a FVG(SIBI) that I really wanted price to revisit and the two price levels that make up the SIBI are 107752 and 107149.
Now that both our sellside liquidity were taken does that mean price is now gonna look for the buyside liquidity? My honest opinion is I don't think because I said 97k is insight and I believe it can still happen and it will according to my HTF perspective.
On the daily TF we have clear sight of relative highs that we wanna see price take and that might happen today but my short term objective is the high that was booked on Tuesday. That Tuesday's candlestick has a very large wick and from my time learning with ICT's content, wicks contain a lot of price data that can be used either for entries or exits.
4H- Here we had a shift in market structure lower on Thursday but price has been bullish ever since the shift happened. On this respective TF we have equal highs too, and ICT teaches us to always focus our attention on them mainly because price looks for liquidity and imbalances on the 4 hour TF...should we look closely on the left of our screens or chart, there is an order block from the wick I mentioned above. Again what are the rules of an order block?..
FROM TOMORROW PRICE WILL START TO PLUMMET!!

Crypto Total Market Cap – Bulls vs. Walls
🧪 1. 🐸 Miracle’s Take – The Meme Prophet Speaks!
“Wassup degenz! It’s ya boi Miracle again – and this chart’s juicier than a frog smoothie!”
Market just kissed the MA50 like it’s a long-lost love 💋… and BOOM — bounced back hard!
We’re climbing outta the bear channel like a true meme-warrior escaping rug hell 🧱
BUT... the resistance zone ahead (3.27T–3.32T) is like a fat whale sitting on top of the market 💀
A breakout above that and we go party at 3.48T, where the liquidity gods live 🎯
If we get slapped down though… Miracle sees a revisit to 3.2T support, where apes gather before launch 🦍
🔋 Momentum is here, but no confirmed breakout YET!
📢 Miracle’s Warning: “A trendline breakout without meme energy is just hopium with candles!”
💡 Miracle Watchlist:
✅ Break + Retest of resistance zone = GO LONG
❌ Rejection = scalp short back to MA
🔍 2. Unknown Analyst View – Clean & Technical
MA50 acted as a dynamic support and initiated a bounce.
Price is trying to break out of a descending channel, which has acted as a structure since late May.
Immediate resistance lies in the 3.27T–3.32T zone, which previously caused multiple rejections.
A confirmed breakout with volume and a successful retest of the resistance zone or MA50 could push us toward:
🎯 Target 1: 3.35T
🎯 Target 2: 3.48T (horizontal key resistance)
If rejected, we could slide back to the 3.20T support (yellow line) or even back into the bearish channel.
The market’s response to this zone will define the short-term trend.
"Observe the structure. Let price prove direction."
🎭 Two Faces. One Chart.
Who do YOU trust more today?
The meme-warrior 🐸 or the mystery tactician 🧠?
💬 Tell us in comments: #TeamMiracle or #TeamUnknown?
🎬 TradeWithMky – where altcoins speak louder than Bitcoin!
#CryptoCap #TotalMarketCap #AltseasonComing #TradeWithMky #CryptoAnalysis

Bitcoin 4H – Battle at Resistance | Two Perspectives 🧪 1. 🐸 Miracle’s View – “Altcoins' Prophet” 🐸
"Yo fellow degenz! It's me – Miracle from the meme-coin clan, and I'm sniffing something bullish... but not so fast!"
Price is tryin’ to break out of a wicked resistance zone.
That red line? 🔴 It's not ketchup — it's the final boss trendline, and BTC must defeat it with volume ⚔️
Market sentiment is bullish, but Miracle says: "Wait for a clean break and retest — no fomo attacks!"
🔍 MA50 (gray snake) is curling up like a noodle of support. If we bounce off it again → 🚀 108.5K, 111K and beyond!
📉 BUT — if price gets rejected and drops below 105K… we might slide to 103.8K (or worse, the dungeon at 101.7K) 🕳️
📢 Miracle Rule: “Breakout without a retest is like a meme coin without a rug — rare!”
🔮 TL;DR:
🟢 Above 106.7K = Go time, ride the wave!
🔴 Below MA50 = Watch your bags, exit or short it with a stop above the resistance!
🔍 2. Unknown Analyst’s Neutral View (Clean & Pro)
BTC is challenging a major resistance zone between ~105.7K–106.7K.
A strong breakout above both the horizontal zone and descending trendline could initiate the next bullish leg.
MA50 and MA200 are offering dynamic clues:
MA50 holding = bullish confirmation if price closes above resistance
Failure to hold = a likely revisit to lower demand levels
Confirmation needed:
Clean candle close above resistance zone
Followed by a successful retest of the zone or MA50 as support
If rejection happens here → Potential retracement to 103.8K or lower (support & previous consolidation)
🎯 Targets on Breakout:
108.5K (local high)
111K (liquidity zone)
Extension possible if volume supports it
🧠 Dual Insight:
"Same chart. Two voices. One truth: Trade with logic — not emotion."
💬 Let us know in comments:
Are you team 🐸 Miracle or team 🧠 Unknown Analyst?
🎬 TradeWithMky – where altcoins speak louder than Bitcoin!
#Bitcoin #CryptoAnalysis #BTC #TradingView #TradeWithMky #MiracleShot #AltcoinArmy

Accurately grasp the gold trend analysis next week📰 Impact of news:
1. The geopolitical situation is gradually deteriorating
2. Trump again calls on the Federal Reserve to cut interest rates
📈 Market analysis:
The current weekly moving average support for gold prices is roughly 3250-3260. If 3250-60 can be maintained, then gold may continue to maintain consolidation and wait for an opportunity to choose a trend. If it falls below 3250, then it can directly see the 3200 mark. If 3200 falls below again, then it will see 3100. In the short term, the first focus of the gold price below is 3315. As long as it stays above 3315, gold is still in a bullish trend. Secondly, pay attention to the 3280 line below. If it falls below 3280, the gold price will further test the support of 3260-3250. It is possible that gold will form a head and shoulders top structure on the daily chart next week. It may fall to 3250-60 at the beginning of the week to lure shorts into the market, and then stretch and rebound to around 3350 to form a shoulder position, and finally directly dive down to around 3150.
If you agree with this view, or have a better idea, please leave a message in the comment area. I look forward to hearing different voices.
OANDA:XAUUSD FX:XAUUSD FOREXCOM:XAUUSD FXOPEN:XAUUSD TVC:GOLD

Short trade
📕 Trade Journal Entry — DOGEUSDT (Sellside Trade)
🗓 Date: Sunday, 8th June 2025
⏰ Time: 5:00 AM (NY Time)
📍 Session: London Session AM
📈 Timeframe: (Not specified – assumed short-term trade)
🔹 Trade Details:
Entry Price: 0.18198
Take Profit: 0.17864 (+1.84%)
Stop Loss: 0.18306 (−0.59%)
Risk-Reward Ratio: 3.09
🔹 Technical Context:
Trade was taken on signs of rejection at a previous resistance level after a rally.

Long trade
📘 Trade Journal Entry — DOGEUSDT (Buyside Trade 2)
🗓 Date: Saturday, 7th June 2025
⏰ Time: 3:00 PM
📍 Session: New York PM
📈 Timeframe: 1-Hour
📊 Market Structure Tool: Bullish Break of Structure + Fair Value Gap Retest
🧠 Confirmation Tool: Rejection from Demand + Volume Support
🔹 Trade Details:
Entry Price: 0.18327
Take Profit: 0.18670 (+1.84%)
Stop Loss: 0.18222 (−0.57%)
Risk-Reward Ratio: 3.27
🔹 Technical Breakdown:
Market Structure:
On the 1-hour chart, price broke a key lower high, shifting the structure bullish.
Entry was taken after a clean retracement into a fair value gap (FVG) within the new bullish leg.
Entry Confirmation:
Price exhibited a clear bullish reaction at the FVG zone,
Momentum & RSI:
RSI stayed above 50, showing strong bullish momentum.

Long trade
📘 Trade Journal Entry — ETHUSDT (Buyside Trade)
🗓 Date: Saturday, 7th June 2025
⏰ Time: 4:00 PM (NY Time)
📍 Session: NY Session PM
📈 Timeframe: 1-Hour
🎯 Result: ✅ Target hit successfully
🔹 Trade Details:
Entry Price: 2,518.91
Take Profit: 2,561.82 (+1.70%)
Stop Loss: 2,513.19 (−0.23%)
Risk-Reward Ratio: 7.5
🔹 Technical Context:
Entered a strong bullish continuation pattern on the 1Hr timeframe.
Confirmed by confluence of higher lows and demand zone support.

My opinion gold will be bounce after one of orderblockMain structure of gold H1 is still up trend. Will be bounce after reach of orderblock.. or other scenarios the price break body of lower high it make a change main structure. Let's see

AUDUSD Start of Week DropThe DXY index has double bottomed and left a significant FVG at around $1. This has yet to retrace and market sentiment towards seeing the USD under $1 is tough. This FVG is likely to close this week as a last ditch effort to hold the USD at $1 level.
We have business confidence news twice in the early week that is likely to be not great pressuring the AUD, then later on we have USD news that will likely hold or temporarily bolster USD confidence. This is the dynamics shift that I believe will bring on that larger retracement of the USD to $1.
Be ready for a significant rejection once we arrive at the FVG though.

XRP Back on the MENU! XRPUSD Ripple next move? XrpUsdtIt's been a while since we looked at this chart.
🌍 SeekingPips 🌎 View remains the same and so we are strictly looking for strategic LONG entry points in
TIME & PRICE. 👌
Yes it's a WEEKLY chart and I understand that many of the trigger happy TRADERS or in some cases GAMBLERS can't stand to look at anything longer than a 30 minute chart BUT really sometimes you really just have to STEP RIGHT BACK to see the BIGGER PICTURE👍
✅️This week's candle CLOSE really has the potential to setup the next few weeks for easy MULTIDAY TRENDING MOVE TRADE SETUPS 👍
ℹ️ Note the price location on what we viewed as a HTF FLAG MANY WEEKS AGO .
Yes it was breached both sides but 🌎SeekingPips🌍 doesn't trade the patterns themselves but the HUMAN PSYCHOLOGY AROUND THESE PATTERNS.🤔
ℹ️ Note where most of the volume has been trading and also note the moves around the extreems of the dead patteren too.💡
In an even higher TIMEFRAME THE FLAG would still be valid and forming the flag itself too.
📊 [ b]CHECKOUT the MONTHLY chart for the example. 📉
Anyway we will see what the next 48 hours🕦 hold but no doubt this one is on our RADAR this week.
✴️ 2.048 to hold otherwise a potential for current low of this year to be tested.
✴️ Alternatively if support starts to form on the 240min chart at current levels last weeks high could expected to be tested
✴️ if so Xrp could easily give a multiday upside trending move.
Now like a NINJA we wait and stalk...
As always ladies and gentlemen whilst Seeking Pips 🌍 SeekingPips 🌎 says
" NO TRIGGER NO TRADE"
& "STICK TO YOUR PLAN"✅️
👍 Have a GREAT WEEK and we will see you soon with an UPDATE...

Long trade
1Hr TF overview
📘 Trade Journal Entry
BTCUSD (Buyside Trade)
Date: Saturday, 7th June 2025
⏰ Time: 5:00 AM (NY Time)
📍 Session: London AM
📈 Timeframe: 1Hr
📊 Market Structure Tool: Break of Structure + FVG Entry
🧠 Confirmation Tool: Clean Bullish Momentum
🔹 Trade Details:
Entry Price: 104,993.53
Take Profit: 106,180.50 (+1.13%)
Stop Loss: 104,687.73 (−0.29%)
Risk-Reward Ratio: 3.88
🔹 Technical Breakdown:
Market Structure:
Clean bullish market structure with higher highs and higher lows.
Break of previous structure and retrace into a bullish FVG confirmed intent.
