Long trade
30min TF
📘 Trade Journal Entry
PEPEUSD (Buyside Trade)
🗓 Date: Saturday, 7th June 2025
⏰ Time: noon (NY Time)
📍 Session: New York PM
📈 Timeframe: 30 minutes
📊 Market Structure Tool: Break of Structure
🧠 Confirmation Tool: Bullish Continuation + Range Expansion Setup
🔹 Trade Details:
Entry Price: 0.00001150
Take Profit: 0.00001204 (+4.70%)
Stop Loss: 0.00001138 (−1.04%)
Risk-Reward Ratio: 4.5
🔹 Technical Breakdown:
Market Structure:
Trade entered after confirmation of bullish structure break and higher low formation.
Price pulled back into a discounted range, respecting a prior accumulation zone.
Candlestick Analysis

BTCUSD analysiswaiting for confirmation (low volume) in weekend - btc have potencial for long bullish but let's see in the following days

XRPUSD SCALPING XRPUSD – Scalp Setup: Buy Into Sell (AUTH Liquidity Framework)
XRPUSD is presenting a two-phase scalp opportunity based on liquidity behavior — first a buy-side reaction, followed by a sell-off from premium liquidity.
🔹 Buy Phase – Liquidity Rebound Setup
Price has swept a key sell-side liquidity pocket below recent equal lows, triggering a reactive move.
• Buy Entry: After lower timeframe confirmation (M5–M15 bullish shift)
• Target: Short-term rally toward internal highs where buy-side liquidity rests
• Exit Zone: Prior to major resistance or supply zone to secure profits
🔹 Sell Phase – Reversal From Overhead Liquidity
Once internal highs are cleared and liquidity is taken, a reversal setup forms.
• Sell Entry: Upon rejection from premium zone or after liquidity sweep above key highs
• Confirmation: Bearish structure shift or strong rejection wick
• Target: Value area retrace or inefficiency fill toward lower structure
📌 Follow for a free intro class on the AUTH Masterpiece System — learn how to spot precision setups like this using liquidity, structure, and value alignment.
Disclaimer: This idea is for educational purposes only and does not constitute financial advice. Trade at your own risk.

Is Ethereum Back In Business? A Confluence of Bullish Patterns Is Ethereum Back In Business? A Confluence of Bullish Patterns, Brutal Liquidations, and Fundamental Strength
The cryptocurrency market is a theater of perpetual drama, a relentless cycle of fear and greed, innovation and volatility. In this unforgiving arena, Ethereum, the world’s second-largest digital asset, has once again captured the spotlight. After a period of underperformance that left investors questioning its momentum, a confluence of technical signals, market-shaking liquidations, and strengthening fundamentals has ignited a fierce debate: Is Ethereum truly back in business? The answer is not a simple yes or no but a complex narrative woven from bullish chart patterns, the chaotic fallout of political spats, and the quiet, inexorable growth of its underlying network.
At the heart of the bullish thesis lies a classic technical analysis signal: the Morningstar candlestick pattern. For traders and analysts who scour charts for clues about future price movements, the appearance of a Morningstar on Ethereum's monthly chart is a development of profound significance. Simultaneously, the market has been violently shaken by an $800 million liquidation event, a brutal culling of leveraged positions in both Bitcoin and Ether, reportedly triggered by a public feud between political and tech titans Donald Trump and Elon Musk. This event serves as a stark reminder of the market's fragility and its susceptibility to external shocks.
Yet, beneath this surface-level chaos, a different story is unfolding. On-chain metrics point to a network that is not just surviving but thriving. Institutional interest is surging, evidenced by substantial inflows into newly approved spot Ethereum Exchange Traded Funds (ETFs). Whales, the market's largest players, are sending mixed but largely accumulative signals. And technological upgrades continue to enhance the network's scalability and utility. This article will delve into these competing narratives—the hopeful story told by the Morningstar pattern, the cautionary tale of massive liquidations, and the quietly confident hum of Ethereum's fundamental growth—to paint a comprehensive picture of where the pioneering smart contract platform stands today.
The Morningstar's Dawn: A Technical Harbinger of a Bullish Reversal
In the lexicon of technical analysis, candlestick patterns provide a visual language for market sentiment. The Morningstar is one of the most revered bullish reversal patterns, a three-candle formation that often signals the end of a downtrend and the beginning of a new upward climb. Its appearance on a high-timeframe chart, such as the monthly chart for Ethereum, carries significant weight, suggesting a major shift in market psychology from bearish despair to bullish optimism.
To understand its power, one must first understand its structure. The pattern consists of three distinct candles appearing after a prolonged price decline. The first is a long bearish candle (typically colored red or black), which confirms the continuation of the downtrend and reflects the sellers' firm control. The second candle is the "star" of the pattern—a small-bodied candle that can be either bullish or bearish. This candle often gaps down from the previous one, indicating a moment of acute indecision in the market. The selling pressure that characterized the first candle has waned, but buyers have not yet seized full control. It represents a point of equilibrium, a pause where the prevailing trend loses its momentum. The third and final candle is a long bullish candle (typically green or white) that closes well into the body of the first bearish candle. This final candle is the confirmation; it signifies that buyers have decisively taken over, overwhelming the sellers and initiating a reversal.
The psychology behind the Morningstar pattern is a story of a power shift. The long bearish candle shows sellers are confident. The small middle candle reveals that confidence is cracking; a battle for control is underway. The final strong bullish candle declares the buyers as the victors, signaling that the path of least resistance is now upwards.
Recently, several crypto analysts have highlighted the formation of this very pattern on Ethereum’s monthly chart. After a period of consolidation and price decline, the emergence of a Morningstar suggests that the bottom of the recent downtrend may be in. Analysts see this as a macro reversal signal, a technical foundation for a potential rally. Some have set initial price targets around $3,300, viewing the current resistance levels as temporary hurdles that will likely be broken in the face of this powerful bullish formation. When combined with other indicators, such as trading volume, which ideally should increase during the formation of the third candle, the Morningstar provides a compelling technical argument that Ethereum is gearing up for a significant move higher. While no technical pattern is infallible, its appearance on a macro scale has undeniably injected a strong dose of optimism into the market, suggesting that Ethereum’s period of slumber may be coming to an end.
The $800 Million Purge: A Tale of Liquidations and Political Tremors
Just as technical analysts were celebrating the bullish omens on the charts, the market delivered a brutal reminder of its inherent volatility. A massive liquidation event, totaling over $800 million and by some estimates approaching $1 billion, swept through the cryptocurrency markets, disproportionately affecting leveraged traders in Bitcoin and Ethereum. In a span of just 24 hours, hundreds of thousands of traders saw their positions forcibly closed, a cascade of selling that sent prices tumbling.
Liquidations are the boogeyman of leveraged trading. When a trader uses borrowed funds (leverage) to amplify their position, they must maintain a certain amount of collateral. If the market moves against their position and their collateral falls below a required threshold, the exchange automatically closes the position to prevent further losses. This forced selling creates a domino effect. As prices fall, more long positions hit their liquidation points, triggering more selling, which in turn drives prices down further, liquidating even more positions. This is a liquidation cascade, and it can lead to rapid and violent price drops.
Recent data showed that long positions accounted for the overwhelming majority of these liquidations, indicating that the market was caught off guard by the sudden downturn. Exchanges like Bybit and Binance were at the epicenter of this financial storm, with Bybit alone reportedly accounting for nearly $354 million in liquidations. The largest single liquidation order was a multi-million dollar position, underscoring the high stakes involved.
What triggered this sudden market panic? Many analysts pointed to an unlikely source: a public and increasingly acrimonious feud between former U.S. President Donald Trump and Tesla CEO Elon Musk. The dispute, reportedly stemming from disagreements over a major tax and spending bill, spilled out onto social media, creating a storm of uncertainty that rattled investors. In today's interconnected world, high-profile clashes between powerful figures can have an immediate and tangible impact on financial markets, particularly on assets perceived as "risk-on," such as cryptocurrencies.
The public fallout was seen as a destabilizing event, injecting political uncertainty into an already fragile market. The fear was that the conflict could have broader economic implications or affect the regulatory landscape for technology and digital assets. This sentiment sparked a broad-based sell-off, not just in crypto but across traditional equities as well. For a market driven heavily by narrative and sentiment, the Trump-Musk tussle provided a powerful bearish catalyst, spooking investors and triggering the cascade of liquidations that sent Bitcoin and Ethereum prices sharply lower. The event serves as a crucial counterpoint to the bullish technical picture, highlighting how susceptible the crypto market remains to macroeconomic and political shocks, regardless of its own internal fundamentals.
The Bullish Undercurrent: On-Chain Metrics and Institutional Adoption
While the liquidation event painted a picture of chaos and fear, a deeper dive into Ethereum's on-chain data and ecosystem developments reveals a much more optimistic and resilient narrative. These fundamental metrics, which track the health and growth of the network itself, often provide a clearer long-term signal than the noise of short-term price fluctuations.
A Thriving and Growing Network
One of the most reliable indicators of a blockchain's long-term value is its network activity. On this front, Ethereum is showing undeniable strength. The number of unique active addresses interacting with the blockchain has been on a steady rise. Recent data shows a significant surge, with weekly active addresses surpassing 17 million, a testament to growing engagement and adoption. This isn't just speculative trading; it reflects genuine usage across Ethereum's vast ecosystem, including decentralized finance (DeFi), non-fungible tokens (NFTs), and Layer 2 scaling solutions.
Furthermore, the growth in new users joining the network is a powerful leading indicator of future demand. The rate of new address creation has been on an upward trajectory, signaling that Ethereum's value proposition continues to attract a broader audience. This organic growth is the lifeblood of any network, creating a flywheel effect: more users attract more developers, who build more valuable applications, which in turn attract even more users.
The Rise of Layer 2 and Technological Upgrades
A key driver of this network growth has been the maturation of Layer 2 scaling solutions like Arbitrum, Optimism, and Base. These networks handle transactions off the main Ethereum chain, allowing for faster speeds and dramatically lower fees while still inheriting Ethereum's security. The explosion of activity on these Layer 2s has been a game-changer, alleviating congestion on the main network and making Ethereum accessible to a wider range of users and applications.
Simultaneously, core protocol upgrades continue to enhance Ethereum's capabilities. The recent Pectra upgrade, for example, has improved scalability and further refined the network's deflationary mechanics. Since the implementation of EIP-1559, a portion of every transaction fee is "burned," or permanently removed from circulation. This, combined with the vast amount of ETH locked in staking contracts, creates a dynamic where the supply of available ETH is constantly shrinking. This principle of decreasing supply coupled with increasing demand is a fundamental recipe for long-term price appreciation.
The Arrival of Institutional Capital
Perhaps the most significant bullish development for Ethereum in recent times has been the approval and successful launch of spot Ethereum ETFs in the United States. This provides a regulated and accessible on-ramp for institutional investors to gain exposure to ETH, unlocking a potential wave of new capital. The early data is promising. In May 2025 alone, spot Ethereum ETFs recorded net inflows of over half a billion dollars, a sharp increase from the previous month.
This institutional validation is a powerful signal. It signifies that some of the world's largest financial players view Ethereum not just as a speculative asset, but as a foundational technology with long-term strategic value. This flow of "sticky" institutional money is expected to provide a strong support floor for the price and reduce volatility over the long run.
The Whale Watch: Accumulation and Confidence
The behavior of "whales"—large holders of Ethereum—provides another crucial, albeit sometimes conflicting, layer of insight. On one hand, there have been reports of significant accumulation by these large players. Data shows massive transfers of ETH from exchanges to private wallets, a classic sign of long-term holding, as it reduces the immediately available supply for selling. One notable transaction involved Galaxy Digital moving hundreds of millions of dollars worth of ETH into a private wallet, suggesting strong institutional confidence. Over the past month, data from on-chain analytics firms has shown that whale wallets have increased their holdings, while retail holdings have slightly decreased, a pattern often seen before a bullish market run.
However, the picture is not entirely one-sided. There have also been instances of long-term whales selling off portions of their holdings, contributing to short-term price drops. This reflects the diverse strategies among large holders. Some may be taking profits, while others are positioning for a long-term hold. Despite the mixed short-term signals, the broader trend appears to be one of accumulation and a net outflow of ETH from exchanges, which is a fundamentally bullish indicator. With exchange balances hitting seven-year lows, the potential for a supply squeeze is becoming increasingly real.
Conclusion: Navigating the Storm Towards a Bullish Horizon
So, is Ethereum back in business? The evidence suggests a resounding, if complex, "yes." The current market environment is a fascinating juxtaposition of short-term turmoil and long-term strength. The public spat between Trump and Musk, and the subsequent $800 million liquidation event, underscore the market's vulnerability to sudden shocks and the perils of leveraged trading. These events serve as a healthy dose of caution, reminding investors that the path forward will undoubtedly be volatile.
However, when we look past the immediate noise, the underlying picture is one of robust and accelerating health. The Morningstar pattern on the monthly chart provides a powerful technical signal that a macro trend reversal is underway, suggesting that the recent period of bearish sentiment has exhausted itself. This technical optimism is strongly supported by fundamentals. Ethereum's network is growing at a remarkable pace, fueled by the success of Layer 2 solutions and continuous protocol improvements that enhance its scalability and economic model.
The most compelling evidence, however, comes from the demand side. The launch of spot Ethereum ETFs has opened the floodgates for institutional capital, a structural shift that will likely define Ethereum's market for years to come. This, combined with the steady accumulation by whales and a shrinking available supply due to burning and staking, creates a powerful bullish cocktail.
Ethereum is navigating a perfect storm of conflicting signals. The violent waves of short-term liquidations and political drama can be disorienting. But beneath the surface, the deep currents of network growth, technological innovation, and institutional adoption are flowing strongly in one direction. For investors who can look beyond the immediate horizon, the story told by Ethereum's fundamentals, supported by classic bullish chart patterns, is not just one of being "back in business"—it's a story of a platform solidifying its position as a cornerstone of the decentralized future.

BULLISH The price is aiming for structural liquidity. It tapped on a support level and gave a clear confirmation on the trend reversal (buys).

Island Reversal?I don't know yet. There is a big open window above us. It means that there was a big bearish momentum but it has been neutralized yesterday already. The harami today is indicating that this may become an Island Reversal with some upward potential.
Whether this will become a real retracement of the April rise is not sure of course but a close of the window is possible anyway.

XAUUSD Short idea for todayWe are now in an bearish imbalance in 4H TF and now looking for break of structure on m15 to validate the idea to short as per the chart, still waiting for confirmation in the form of break of structure or 15m imbalance.

Analysis and layout of the latest gold trend in the evening📰 Impact of news:
1. The United States issues new sanctions on Iran
2. Trump continues to criticize the Federal Reserve
📈 Market analysis:
The 1H moving average of gold has shown signs of turning downward. If a death cross structure is formed subsequently, it will open up further downward space. From the market point of view, the price of gold rebounded to around 3364 after the release of non-agricultural data. This position constitutes a short-term key resistance level. If the rebound is under pressure here during the US trading session, short selling on rallies can still be considered. Although the price of gold has started to decline, it has not been able to fall below the important support of 3,300, so the long-term direction remains unchanged. At the same time, we need to pay attention to the effectiveness of the 3310 support line in the short term, and consider long trading only after the bottom is confirmed. For short-term trading, consider shorting at 3340-3350, and look to 3320-3310
🏅 Trading strategies:
SELL 3340-3350
TP 3320-3310
If you agree with this view, or have a better idea, please leave a message in the comment area. I look forward to hearing different voices.
TVC:GOLD FXOPEN:XAUUSD FOREXCOM:XAUUSD FX:XAUUSD OANDA:XAUUSD

Nifty Analysis EOD – June 6, 2025 – Friday🟢 Nifty Analysis EOD – June 6, 2025 – Friday 🔴
🎯 25K Now, What's Next?
Nifty opened on a neutral tone, cautiously awaiting the outcome of the RBI Monetary Policy. As the event unfolded and the repo rate cut of 0.5% was announced, the celebration began on Dalal Street—and the charts reflected it.
What followed was a clean, powerful rally, breaking through key levels and carrying the index all the way to the psychological milestone of 25,000, where it closed almost flat on the round number at 25,003.05.
Today’s close is just shy of the May 26th high, and a few hurdles still remain:👉 25,060–25,070👉 25,115–25,130👉 25,180–25,212
These levels will decide whether the breakout from the box range—which we’ve discussed in earlier reviews—truly sustains. As long as there’s no negative trigger over the weekend, bulls may carry the momentum into next week.
🛡 5 Min Chart with Levels
🕯 Daily Time Frame Chart
🕯 Daily Candle Breakdown
Open: 24,748.70
High: 25,029.50
Low: 24,671.45
Close: 25,003.05
Net Change: +252.15 (+1.02%)
📊 Candle Structure Breakdown
Real Body: 254.35 pts (Strong Green)
Upper Wick: 26.45 pts
Lower Wick: 77.25 pts
🔍 Interpretation
A session that began quietly turned into a bullish sprint.
The small upper wick shows there was minimal rejection at higher levels.
The lower wick reflects early dip buying.
The strong green body signals dominant intraday momentum, with bulls in charge from start to finish.
🔦 Candle Type
🟢 Bullish Marubozu–like candle– Almost a full body with small wicks, indicating powerful follow-through buying and confidence among bulls.
📌 Key Insight
25,000 breakout looks clean and technically sound.
Holding above 24,900–24,950 in the coming session could lead to further upside exploration.
All eyes on volume confirmation and whether we can conquer the next resistance band near 25,130+.
🛡 5 Min Intraday Chart
⚔️ Gladiator Strategy Update
ATR: 274.31
IB Range: 91.90 → Medium IB
Market Structure: Balanced
Trades:✅ 10:05 AM – Long Triggered → Target Achieved (1:1.4)✅ 10:40 AM – Long Triggered → Target Achieved (1:2)
📌 Support & Resistance Zones
Resistance Levels
25,062 ~ 25,070
25,116 ~ 25,128
25,180 ~ 25,212
Support Levels
24,972
24,920 ~ 24,894
24,800 ~ 24,768
24,727 ~ 24,737
24,660
💭 Final Thoughts
Momentum is back.Bulls not only broke free from consolidation—they made a statement. The RBI’s surprise move might just be the fuel Nifty needed to launch toward unexplored zones.
📌 “Big breakouts don’t ask for permission. They just happen—when doubt is highest.”
✏️ Disclaimer
This is just my personal viewpoint. Always consult your financial advisor before taking any action.

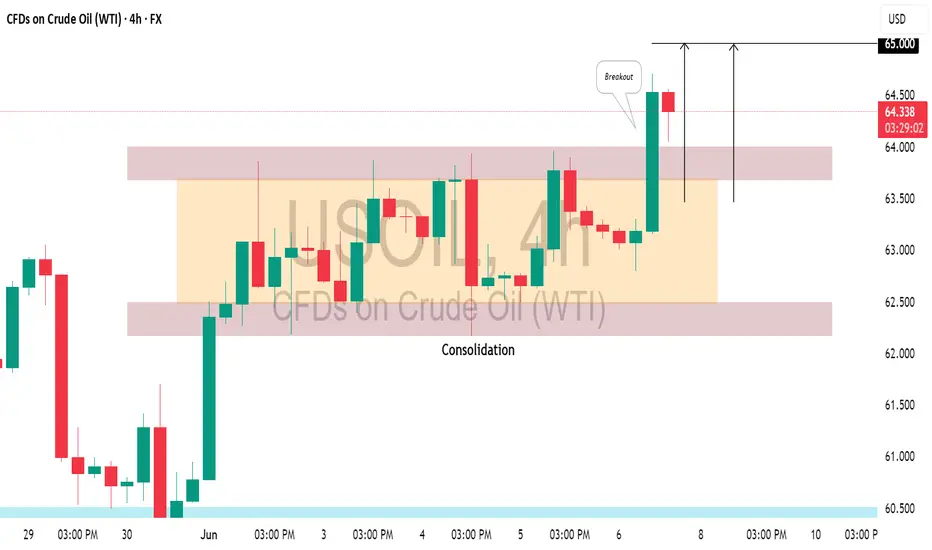
US CRUDE OIL(#WTI) : Bullish Trend Continues📈USOIL is trading in a bullish trend on a 4H time frame.
After a prolonged upward movement, it started to consolidated within a horizontal range for a while.
Recently, the resistance of this range was breached, indicating strong buyer momentum.
I believe the upward movement may persist, potentially leading the market to reach the 65.00 level soon.
The rebound is not strong, and gold still has room to fallThere is no good entry point to participate in the transaction at present, but the highlight of today is the NFP market, so there is no need to rush to enter the market when there is no trading opportunity.
Although gold rebounded slightly after touching 3340 overnight, to be honest, the rebound strength is far less than expected, and as long as gold remains below 3365-3375, gold will remain weak in the short term, so I think gold still has room to fall. First, pay attention to the support near 3330, followed by the support near 3310. However, in trading, we must pay attention to guard against the trend of falling after rising in the NFP market.
Trading strategy:
1. Consider continuing to short gold in the 3375-3385 area, TP: 3360-3350;
2. Consider trying to go long gold in small batches in the 3325-3315 area, TP: 3340-3350

Long positions have made profits, focus on support📰 Impact of news:
1. The United States issues new sanctions on Iran
2. Trump continues to criticize the Federal Reserve
📈 Market analysis:
At present, the gold price has touched 3340. If it stabilizes here, we can arrange to go long. However, the gold price is constantly testing downwards, which is why I did not arrange to go long immediately. At the same time, we need to be vigilant about whether the gold price will fall below the important support of 3330. If it really falls below 3330, the gold price may test the support of the integer mark of 3300, which will also determine the future market trend.
🏅 Trading strategies:
SELL 3400-3370
TP 3340-3330-3300
BUY 3335-3330
TP 3350-3370
SELL 3325-3320
TP 3310-3300
If you agree with this view, or have a better idea, please leave a message in the comment area. I look forward to hearing different voices.
OANDA:XAUUSD FX:XAUUSD FOREXCOM:XAUUSD FXOPEN:XAUUSD TVC:GOLD

USDJPY: Pullback From Support📈USDJPY responded well to the highlighted intraday support zone on a 4H timeframe.
The price formed a double bottom pattern on that and violated its horizontal neckline.
There's a strong likelihood that the price will continue to rise and hit the 146.00 resistance level.

USDJPY Wave Analysis – 6 June 2025
- USDJPY reversed from the support area
- Likely to rise to the resistance level 146.00
USDJPY currency pair recently reversed from the support area between the support level 142.50 (which has been reversing the price from the end of April) and the lower daily Bollinger Band.
The price earlier formed multiple consecutive Japanese candlesticks reversal patterns near the support level 142.50 – Bullish Engulfing, Morning Star and Pricing Line,
Given the strength of the support level 142.50, USDJPY currency pair can be expected to rise to the next resistance level 146.00.

50 bps Repo Rate Cut boosts Nifty. Can it fly further now?The market was expecting a Repo Rate Cut From RBI. The expectation was for 25bps but what we got today from RBI was a bumper 50 bps rate cut. This propelled Nifty to close above much coveted level of 25K as Nifty managed to close at 25003. Now Nifty has entered a critical resistance zone. This zone starts from around 25037 to 25146. Closing above 25146 is mandatory for Nifty to fly further and gain further momentum. Last 4 weeks or so Nifty has been returning back from this zone. We can see this in the weekly chart of Nifty. With rate cut the chances for Nifty to fly above this most important levels has increased a lot.
The resistances for Nifty Now Remain at: 25037, 25146 (Important Trend line Resistance, Bulls will be very active above this level.), 25473, 25804 and 26277. Further levels will be given once we get a closing above 26277.
The supports for Nifty remain at: 24642, 24425, 23904, 23597 (Most important Mother Line of Weekly Candles). Below this level Nifty will become very week again and bears can drag Nifty further down towards 23201 (Important Trend Line Support). If this is broken in unlikely global or local geo-political event then Nifty can further fall to 22169 or even 21671 levels in unlikely scenario of major geo-political event unfolding.
Disclaimer: The above information is provided for educational purpose, analysis and paper trading only. Please don't treat this as a buy or sell recommendation for the stock or index. The Techno-Funda analysis is based on data that is more than 3 months old. Supports and Resistances are determined by historic past peaks and Valley in the chart. Many other indicators and patterns like EMA, RSI, MACD, Volumes, Fibonacci, parallel channel etc. use historic data which is 3 months or older cyclical points. There is no guarantee they will work in future as markets are highly volatile and swings in prices are also due to macro and micro factors based on actions taken by the company as well as region and global events. Equity investment is subject to risks. I or my clients or family members might have positions in the stocks that we mention in our educational posts. We will not be responsible for any Profit or loss that may occur due to any financial decision taken based on any data provided in this message. Do consult your investment advisor before taking any financial decisions. Stop losses should be an important part of any investment in equity.

GBPCAD SHORT Market structure bearish on HTFs DW
Entry at both Weekly and Daily AOi
Weekly Rejection at AOi
Daily Rejection At AOi
Previous Structure point Daily
Around Psychological Level 1.86000
H4 EMA retest
H4 Candlestick rejection
Rejection from Previous structure
Levels 4.78
Entry 100%
REMEMBER : Trading is a Game Of Probability
: Manage Your Risk
: Be Patient
: Every Moment Is Unique
: Rinse, Wash, Repeat!
: Christ is King.
