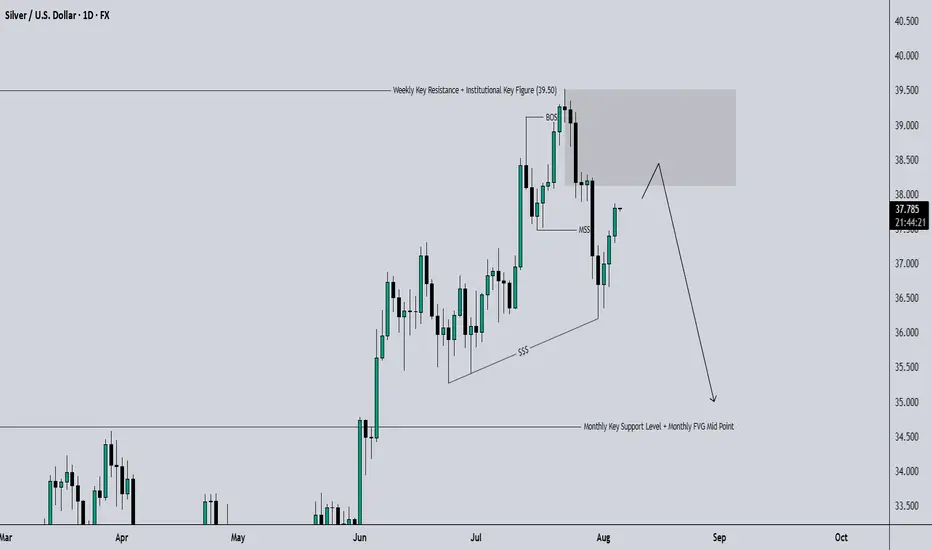
XAGUSD SWING: SHORT-TERM BEARISH OPPORTUNITY Hi there,
For Silver, I am long term bullish but we have a set up for some short opportunity.
As annotated, we are primed to see lower prices... between 34 - 34.5
If this happens, I'd resume looking for massive long opportunities.
You might want to keep this on your radar.
Cheers,
Jabari
Candlestick Analysis
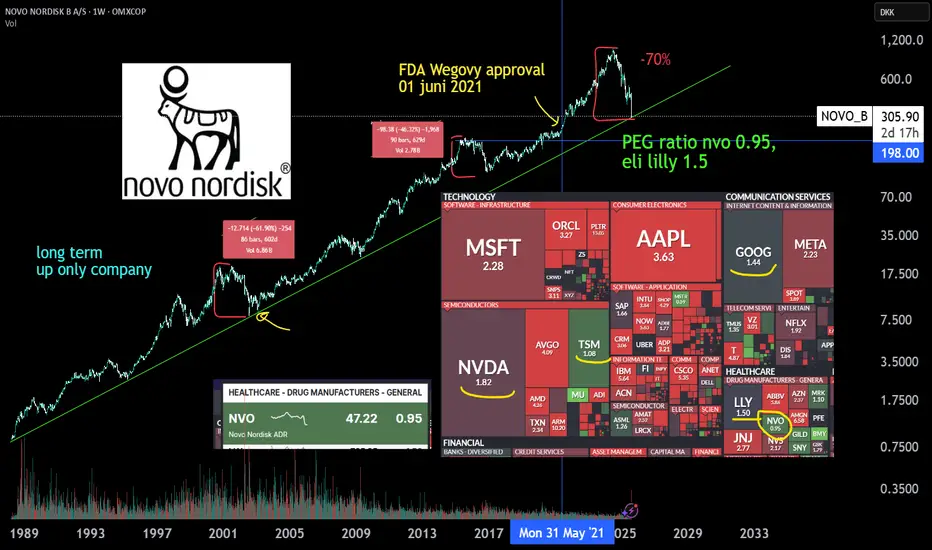
NovoNordisk, LT dirt cheap | GLP-1 a misunderstood growth marketNovo Nordisk stock has lost quite some weight since the release of Eli lilly's drug Zepbound and Mounjaro and since the rise of compounded, or generic copycat GLP-1 alternatives. The growth of the company has slown down a bit, but the overall GLP-1 market growth is still impressive and misunderstood. Both Lilly and NVO have become some of the cheapest PEG stocks in the markets and compettitors, of which most known, Hims en hers health also took a slice of growth of this market by telehealth GLP-1 descriptions.
The copycat descriptions could be dangerous due to unvalidated low quality GLP-1 or agonist GLP-1 substances. Therefore a lot of law suits have been initiated by NVO.
Where Oral Wegovy still has to be FDA approved withinin ~4, 7 months in USA, the company also has new medication approvals awaiting in the pipeline, medications like Cagrisema. (Phase 3 clinical trials, approval in late 2025 or early 2026)
Amycretin - a unimolecular long-acting GLP-1 and amylin receptor agonist.
Where investors have already praised Lilly for the better drug, GLP-1 demand is surging harder than production for both companies.
Where Wegovy and Ozempic are approved by The FDA to sell, many costs for the patients themselfs aren't covered by the health insurance yet. Wegovy or Zepbound isn't covered for mainstream when prescribed by your physician yet. it's only covered for severe obisty for example. Therefore penetration rates of the drug aren't very high yet and will get higher where it will be coverd for more people. Also due to the high cost many copycat GLP-1 agonist market have arisen.
There is some improvement in cost coverage for these types of medicine Which will boost the revenue due to prescribtion sales.
Next these facts, there are still new markets for GLP-1 to be approved like in india and Japan where worldwide demand is much greather than production capacity. Both Lilly and NVO are expanding fast. Many new production volume is created and Needed!, NVO is expanding production sites in brazil and china.
I'm exited for the earnings today. NVO has had many dumps before but has proven to be a up only company. The profits of the company have doubled from $7B to >$14B since Wegovy FDA approval. from the top shares have dumped 70% where there is still >10% growth. Since the FDA approval (june 2021), other markets excluded the share is just +40% up. The stock is much cheaper now with double the profits and revenue, and still >10% growth.
Let's see what happens with earnings. Good luck.
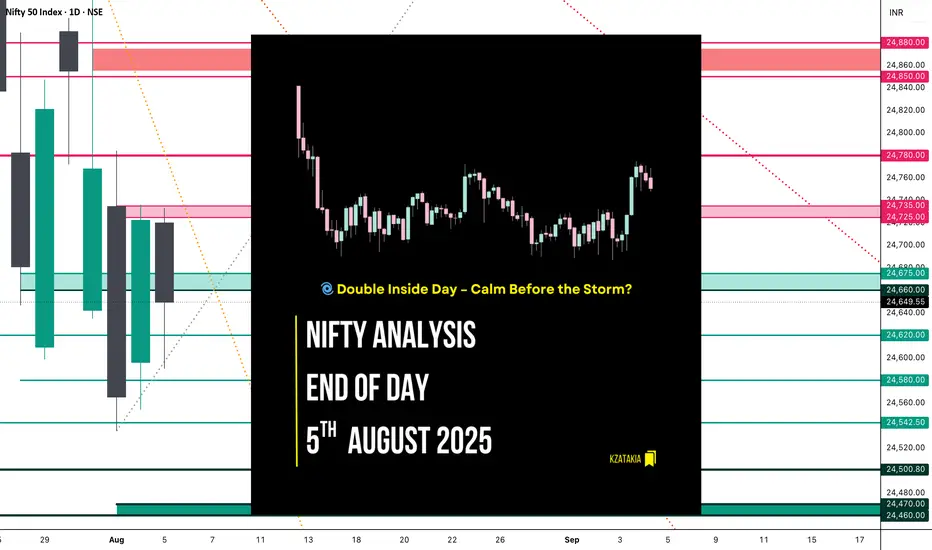
Nifty Analysis EOD – August 5, 2025 – Tuesday 🟢 Nifty Analysis EOD – August 5, 2025 – Tuesday 🔴
🌀 Double Inside Day – Calm Before the Storm?
📊 Nifty Summary
In the wind of negative news, yet Nifty starts neutral at the resistance zone of 24,725 ~ 24,735 but was unable to hold there and fell 140 points within the first 45 minutes.
After this initial sell-off, Nifty found support around 24,590, which coincided with yesterday's Fib 0.786 level, R1, and Previous Week Low (PWL).
These levels were well-defended throughout the session. Near the end, the index recovered ~80 points and closed at 24,649.55, close to yesterday’s Fib 0.5.
Can we consider today's move a retracement or a pullback of yesterday's move?
Same as Monday, today’s action stayed inside the previous session’s range, forming an Inside Bar. Now it appears as a Double Inside Bar on the daily chart.
📉 5 Min Time Frame Chart with Intraday Levels
📉 Daily Time Frame Chart with Intraday Levels
🕯 Daily Candle Breakdown
Open: 24,720.25
High: 24,733.10
Low: 24,590.30
Close: 24,649.55
Change: −73.20 (−0.30%)
Candle Structure Breakdown:
🔴 Red Candle (Close < Open):
24,720.25 − 24,649.55 = 70.70 points
🔼 Upper Wick:
24,733.10 − 24,720.25 = 12.85 points
🔽 Lower Wick:
24,649.55 − 24,590.30 = 59.25 points
Interpretation:
After a flat open, the index tried to move higher but faced resistance near 24,730, then reversed.
Buying interest was seen near the 24,590 zone, but sellers remained in control.
It closed below the open with a decent lower wick, indicating some buying support but overall weakness.
Candle Type:
🕯 A pullback candle with a moderate real body and long lower wick – suggests buyers attempted to support the fall, but sellers dominated.
🛡 5 Min Intraday Chart
⚔️ Gladiator Strategy Update
ATR: 202.71
IB Range: 139.95 → 🟠 Medium
Market Structure: Balanced
Trade Summary:
❌ No entry triggered by system
📌 Support & Resistance Levels
🔼 Resistance Zones:
24,725 ~ 24,735
24,780 ~ 24,795
24,860 ~ 24,880
🔽 Support Zones:
24,675 ~ 24,660
24,620
24,542 ~ 24,535
24,500
24,470 ~ 24,460
🧠 Final Thoughts
Today's double inside bar structure signals contraction and indecision — markets are waiting for a decisive breakout.
“The tighter the coil, the bigger the breakout.”
Keep an eye on these tight ranges. Patience before power!
✏️ Disclaimer
This is just my personal viewpoint. Always consult your financial advisor before taking any action.
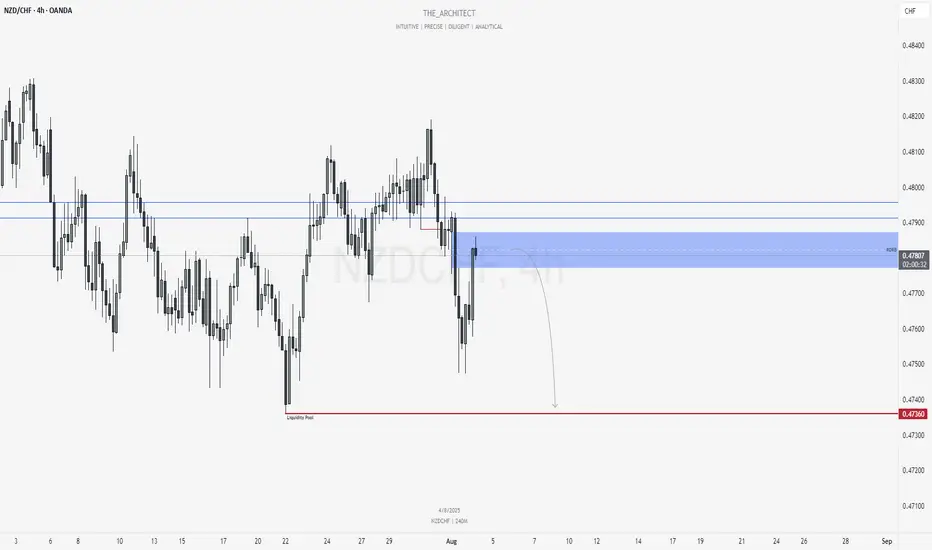
NZDCHF: Bearish Continuation from Re-Delivered Re-Balanced ArrayGreetings Traders,
In today’s analysis of NZDCHF, recent price action confirms the presence of bearish institutional order flow. As a result, we aim to align ourselves with this directional bias by identifying strategic selling opportunities.
Key Observations on H4:
Bearish Market Structure Shift: The H4 timeframe has recently confirmed a bearish shift in market structure, providing us with a clear framework to seek short setups in line with institutional momentum.
RDRB Resistance Zone: Price has retraced into a Re-Delivered Re-Balanced (RDRB) array—an area where prior institutional selling took place and has now been re-engaged. This region is expected to serve as resistance, offering a high-probability zone for confirmation entries to the downside.
Trading Plan:
Entry Strategy: Monitor lower timeframes (M15 and below) for bearish confirmation setups within the RDRB array.
Target Objective: The current draw on liquidity remains the liquidity pool residing at deeper discount levels, which aligns with our short bias.
For a detailed market walkthrough and in-depth execution zones, be sure to watch this week’s Forex Market Breakdown:
As always, stay disciplined, wait for clear confirmations, and manage your risk responsibly.
Kind regards,
The Architect 🏛️📉
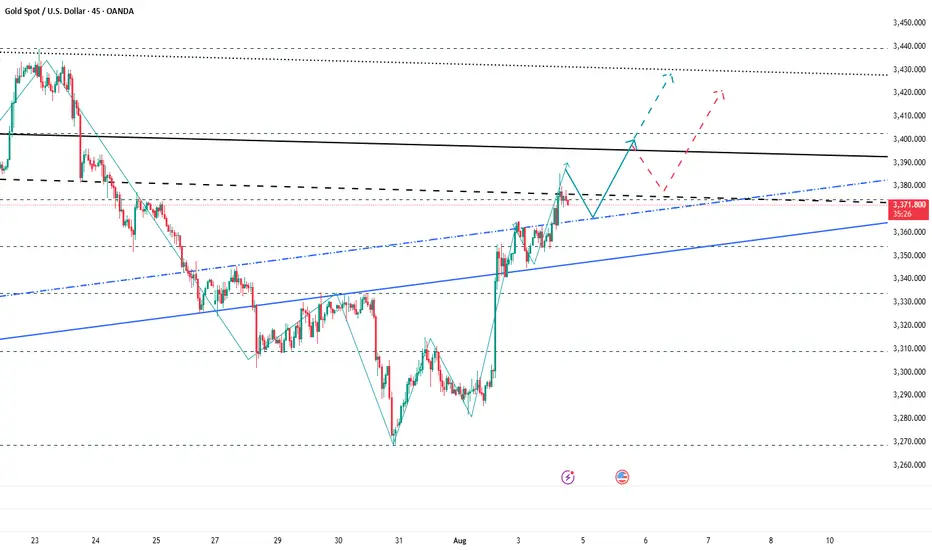
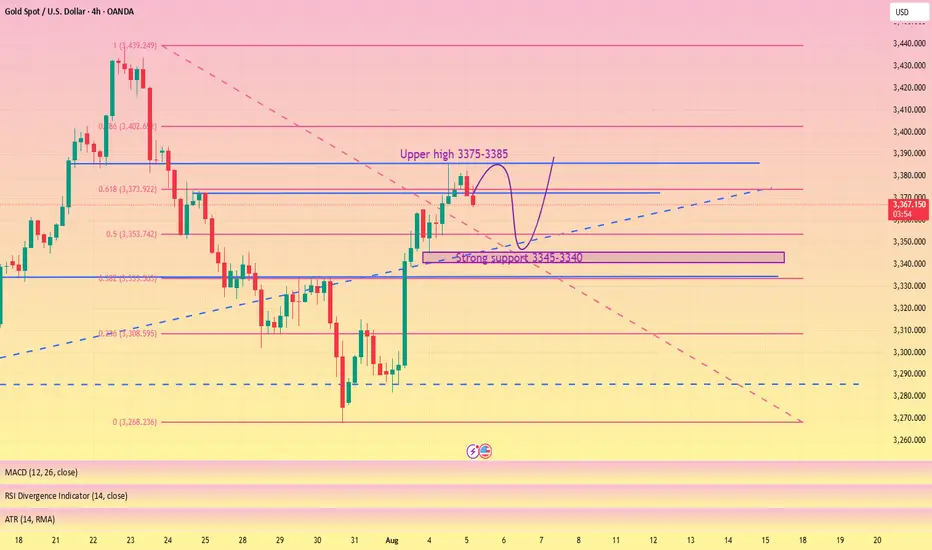
Next Stop 3420? Gold Bulls Push the LimitBecause the U.S. non-farm payroll report performed worse than expected, gold rebounded strongly last Friday and recovered half of its losses in one fell swoop. The bulls returned strongly. Today, after consolidating at a high level, gold continued to choose to break upward, reaching a high of around 3385.
There is no doubt that bullish forces still hold the upper hand. From a fundamental perspective, the Federal Reserve is currently facing greater pressure to cut interest rates; and it can also be clearly seen from the candlestick chart that a significant "W"-shaped double bottom structure has been constructed near 3268 and 3280, which has limited the gold's retracement space while also playing a key structural support role in the rise of gold. With the combined effects of news and technical factors, gold still has the potential to continue its upward trend. And I think there is still a great possibility that gold will test the 3400 mark again. Once gold stabilizes at 3400, it will definitely hit the 3420-3430 area.
As the center of gravity of gold gradually shifts upward, the lower support area also moves up. The current short-term support is obviously in the 3365-3355 area, while the relatively strong support is in the 3345-3335 area. According to the current pattern structure, the bulls may not allow gold to retreat to the 3345-3335 area. So in terms of short-term trading, we first consider the opportunity to enter long positions in the 3365-3355 area!
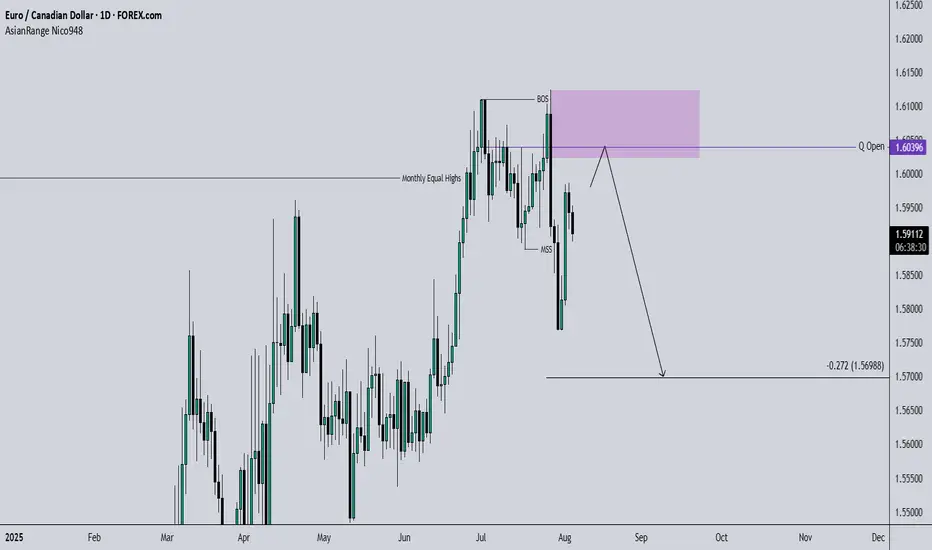
EURCAD SWING: SHORT-TERM SHORT OPPORTUNITYHi there,
Been a while... I was motivated resume sharing my trade ideas by a follower turned Pal (Shloydo). I say this to say - I'd be sharing my thoughts on price more often.
After running equal highs on the monthly chart, price created a MSS and I'd like to see a short-term bearish movement in price.
Once price trades into the highlighted key level (which aligns with the quarterly open price), I'd be looking for a setup to go short.
You could add this to the pairs on your radar.
Cheers,
Jabari
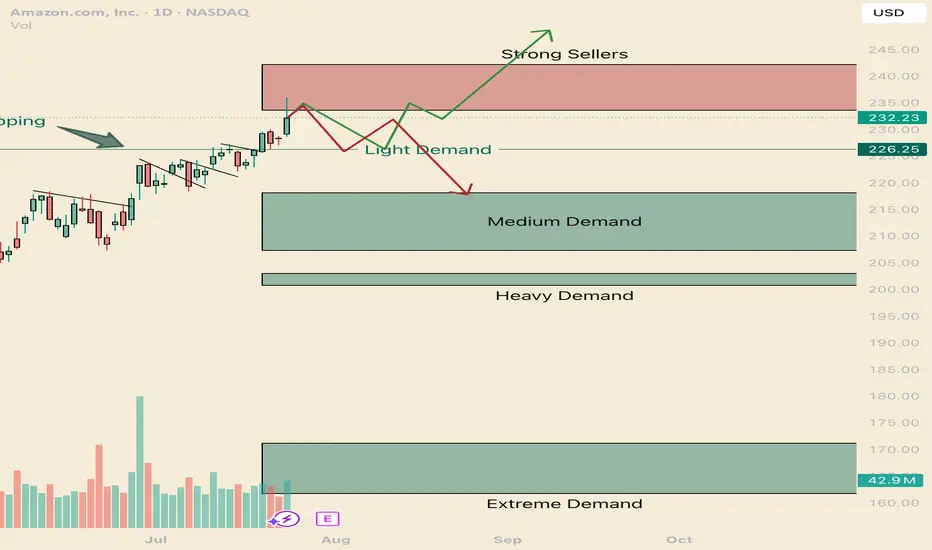
How to navigate the Amazonian Squeeze. AMZNHello I am the Cafe Trader.
This week has been a deep dive on the MAG 7 and today AMZN is up next.
We are going to look at long term and short term opportunities.
We are near the All Time Highs, with one final Seller to get through before making the break.
Today we tested to see if those sellers are there still (and indeed they are). Today was a key reaction, I'm going to give you the keys to profit.
Long Term
It's important to consider how aggressive you would like to be with pricing. This list of prices should align with your conviction with Amazon.
Aggressive: $226 is where the current aggressive players are sitting. They are going to look to buy again at this level, although they should be the weakest of the buyers.
Fair sentiment: 203-210 is where stronger buyers are sitting. I think this price is still realistic to get to.
Conservative: 161 - 171 Is a great price, buyers have shown to buy this with extreme demand. Amazon at this price is a fantastic purchase, if you are holding from here or lower, congradulations.
Short term
Testing the supply and rejecting tells us that sellers are still really active in this zone. We will see how tomorrow closes, if we do not close in the supply zone, there is a good chance that net week will have some bearish winds and a great chance of testing the light demand at 226. this brings us to the two trading ideas.
1 Green line
I think we will test those sellers by next week. and i think its very possible that we break trend and touch the light demand line. If its a slow drag down to the light demand, Shorts will have to cover as soon as any real demand shows up (Light Demand Line).
Entry 226.50
Stop 221.50
Partial TP 233, or you can hold for a test of the highs (242 would suffice)
2 Red Line
If we get a Hot reaction from the supply zone, or if we close below 233.50 tomorrow, Look for a retest and short entry off the supply zone. If the reaction starts to be slow (more than 5 days of red bars) it's likely this will turn into the green scenario.
Entry 233.5
Stop 237
Partial TP 226.5
Full TP 218
That's all for AMZN Follow for more!
Also comment if you would like me to chart a stock you are considering.
@thecafetrader
Wait for a pullback and then test the previous high#XAUUSD
The gold market closed positively on the daily chart, with strong support near 3345-3340 below. The market trend is still dominated by bulls,🐂 but the daily moving average support is too far from the high point. It is not ruled out that it may retreat to the moving average support near 3345-3340,📊 and then rise again.🚀
From the monthly chart, 🌙although the monthly chart closed positive, the market is generally converging at a high level. Upper resistance remains, and a breakout is unlikely without breaking through this resistance level (no further discussion will be given).📉
Judging from the weekly chart, the Bollinger Bands have shrunk, and the MACD indicator has formed a death cross with large volume, indicating weak fluctuations at the weekly level.😩
Judging from the daily chart, 📊the current technical indicators are tending to the zero axis, and the rapid upward correction of the smart indicator indicates that the price fluctuation tends to rebound. The current focus is on yesterday's high around 3385. It is expected to break through 3430. The lower support Bollinger band middle track and moving average tend to stick together around 3346-3340.🌈
Judging from the hourly chart and 4H chart, 📊the overall rhythm tends to fluctuate and fall. The short-term pressure from above is around 3375-3385, and a break above will definitely lead to an increase.📈
On the whole, pay attention to yesterday's NY starting point near 3365-3360, and the strong support below is 3346-3340. The hourly and 4H charts tend to fluctuate and fall, so for short-term trading we need to short on rallies. 📉
Intraday trading suggestions are as follows:
1. Consider going long currently around 3365-3360📈, targeting 3374-3380🎯. If it breaks through, look for 3400.
2. Go long if it retraces below 3355-3340, targeting 3375-3385. Wait for further adjustments.🐂
3. If the price first reaches the resistance level of 3375-3385 and holds, consider going short with a small position and anticipate a pullback towards 3365-3355.🐻
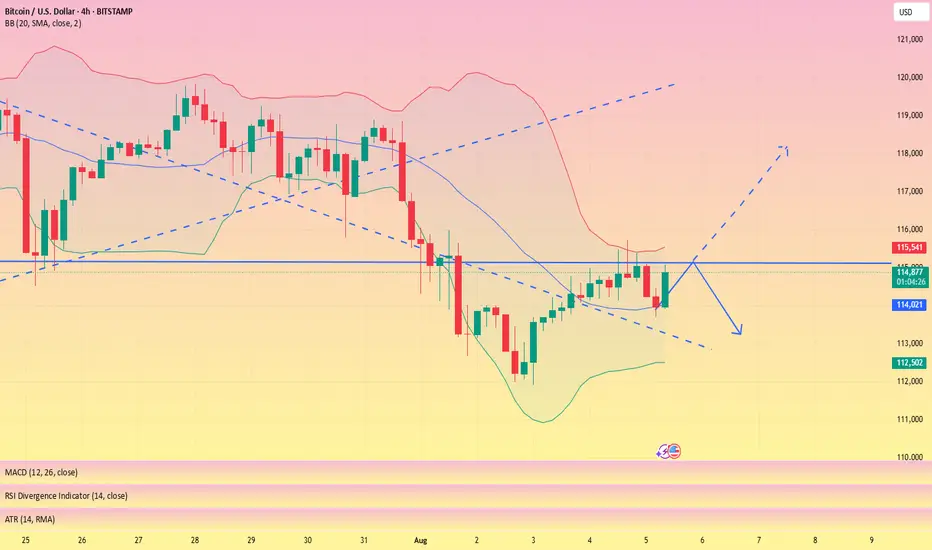
BTC intraday strategy analysis and operation layout#BTCUSD
Currently, BTC rebounded again to test the upper resistance area of 115000-116000, indicating that buyers are still defending this structure, but it is still suppressed by the upper resistance. From a derivatives perspective, open interest has fallen by 0.91% over the past 24 hours, while options trading volume has also fallen by over 13%, indicating a decrease in speculative activity. Despite a 34.28% increase in 24-hour trading volume to $61.71 billion, the long-short ratio has fallen below 1.0, reflecting cautious market sentiment.
As long as BTC maintains above 114,000-113,000, the short-term structure remains neutral. If it fails to break through the overhead resistance and stabilize above 116,500, bulls may lose control of the lower trendline of the channel, triggering a renewed bearish push.
If BTC can successfully hold above 116,500, it could potentially return to 118,000 or even challenge the macro resistance level of 120,000. On the contrary, if BTC finds it difficult to break through the short-term resistance level, it will still return to the 114,000-113,000 area.
🚀 BUY 116,500-117,000
🚀 TP 118,000-119,000
COIN: Retesting Broken Resistance - Decision Point IncomingCOIN (Coinbase) has pulled back sharply after its breakout run to ~420 and is now retesting the prior resistance zone near 310–315, which previously acted as a lid during Q1.
This area now becomes a classic support-turned-resistance flip and serves as a major decision point for price:
Technical Levels & Setup:
310 horizontal zone = former resistance from February/March → now being retested
Buyers stepping in here would confirm a bullish retest, keeping the breakout structure intact
Failure to hold opens the door for a deeper flush toward 220-250
Price currently sitting on the zone with indecision - watch for confirmation candle (hammer / bullish engulfing)
Measured breakout continuation still targets 450+ if support holds
Is COIN simply back-testing the breakout before another leg higher - or is this the start of a larger reversal?

AUDUSD: Short entry triggerGood morning everyone,
today I am sharing a Short signal received now via alert from the LuBot Ultimate indicator.
Entry made on correction (approximately 50% of the trigger candle).
In this case I will follow the levels suggested by the indicator regarding both the TP and SL. Levels that will update as the trade progresses.
The signal is confirmed by the negative structure (red candles) that has just started on the 4H and a bearish trend confirmed by the signal a few candles back (Bear Trend signal).
The predictum also shows a bearish signal, therefore predicting a negative situation for the current month.
👍 If you want to see other similar posts, like/boost
🙋♂️ Remember to follow me so you don't miss my future analyses
⚠️ Disclaimer: This post is for informational purposes only and does not constitute financial advice. Always do your research before making investment decisions.

EURUSD TRADING IDEA 08 05 25Here's another one:
Looking for a strong rejection in the discount zone before going long.

CHFJPY: Pullback Confirmed?! 🇨🇭🇯🇵
CHFJPY may pull back from a key daily support.
A formation of a bullish imbalance candle on an hourly time frame
with a bullish CHoCH provide a reliable confirmation.
Goal - 182.45
❤️Please, support my work with like, thank you!❤️
I am part of Trade Nation's Influencer program and receive a monthly fee for using their TradingView charts in my analysis.

EURUSD: Time For PullbackThe 📉EURUSD pair reacted significantly to the highlighted intraday resistance zone following the market's opening on Monday.
After testing this blue structure, the market began to consolidate, creating a horizontal trading range on the hourly chart.
A bearish breakout below its support level signals a strong downward trend, suggesting a potential pullback from the resistance level, with a target of 1.1473.

BTC sounded the alarm, 115,000 became the key point#BTCUSD
Last week, as global risk sentiment deteriorated, the cryptocurrency market came under pressure, pushing BTC back from its recent highs. This correction was significant, and while BTC has subsequently rebounded, technically, the bearish divergence signaled by the daily MACD indicates weakening short-term rebound momentum. The Bollinger Bands on the 4-hour chart are trending downward, indicating that the market remains in a period of volatile correction.
If BTC cannot effectively break through the upper resistance of 115,000 in the short term, the bears may continue to exert their strength. You can consider shorting with the target at 114,000-113,000.
🚀 SELL 115,000-116,000
🚀 TP 114,000-113,000

Technical indicators are bullish across the boardInfluenced by the NFP data, gold prices rose strongly, fully recovering last week's losses. The current gold market has broken the previous bull-bear equilibrium and remains in a strong upward trend. We are currently bullish but will not chase the rise. We will wait for gold to fall back and stabilize before trying to go long. Gold is currently in a sideways consolidation. If gold touches the upper short-term resistance of 3365-3370 again in the European session and encounters resistance and pressure, you can consider shorting with a light position and waiting for a pullback. If the gold price breaks up strongly, pay attention to the key suppression level above 3375-3385.
As the price of gold continues to rise, the support has moved up. Pay attention to the short-term support of 3345-3330 below. If it retreats and stabilizes, you can consider going long. Independent traders must strictly implement trading plans, and those who are not sure about the market must set stop-loss orders.
OANDA:XAUUSD

USDCAD: Strong Bearish Signal?!The 📈USDCAD pair appears to be bullish following more than a month of consolidation.
The bullish breakout from a sideways range support serves as a strong confirmation signal.
Indicating an expected upward movement towards at least the 1.3950 support level.

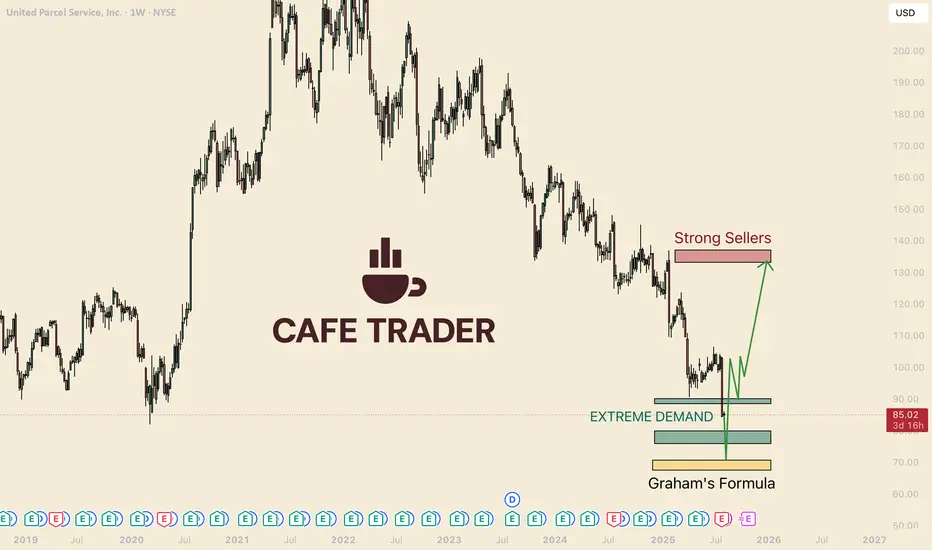
Warren Buffet and UPSHello I am the Cafe Trader.
There have been some wild days, and it's not over. Amidst all the stormy seas, and the major successes, I wanted to bring to your attention a stock that I think is becoming of great value.
UPS has been getting beat down for over three years, why?
Beatdown
- Trump Tariffs contributing to China slowdown. (35% of deliveries comes from China).
- Guidance downgraded due to uncertainties with the macroglobal scale, "spooking investors".
- UPS cutback dealings with amazon to increase profitablity (but also reducing volume and revenue.)
Just to name a few...
If such bad news, why buy?
Fundamentally their business model is strong, and the dividend is PAYING.
Dividends and Warren Buffett.
Buffett is still known to use a model by his mentor, Benjamin Graham. (if you don't know, take a little youtube shallow dive).
This has been used to build a large portion of how buffet evaluates a stock. Using his formula, the Maximum intrinsic value of UPS is $69.87
As of writing this article, UPS sits roughly 21% higher than that number. If we get close, even the fundamentalists may have a hard time passing this up.
Dividends
At 1.68 Dividend a quarter, that put's UPS at almost 7.91% yield!
So my thought process is; even if you lose 8% from Graham's buy price, you make up on the dividend in a year. (although I would be surprised if it touched that golden zone).
TLDR LONG TERM
Aggressive buy: $88 (we are below that right now)
Great Price: $75.50 - 80.50
Graham's STEAL: $71 or Below.
NOTE: Graham took other things about a stock into consideration as we, as you should as an investor. This article is meant to assist your own DD.
-Since this is charted on a weekly chart I have charted a probable 4-6 month swing. (almost 50% gain).
-It really does depend on where this bounces, we have already broke through some major levels.
-I have a feeling UPS drivers might be cashing out their 401k and panic selling.
That's all for UPS!
I hope you enjoyed the article, thank you for your time.
If you enjoyed please consider a follow and a boost!
@thecafetrader
Altcoins Recovering: TOTAL3 Bounces from Key Support ZoneIn my previous analysis on TOTAL3, I mentioned that I'm working with two possible bullish scenarios for altcoins. It now seems we're firmly in Scenario #2.
📉 The price dropped exactly into the highlighted support zone, then yesterday we saw a clean recovery and reversal starting right from that area — a textbook technical reaction.
📈 At the time of writing, TOTAL3 sits at $986B, and a break above the $995B–$1T resistance could trigger a new leg up for altcoins.
🎯 Short- and mid-term targets remain:
• $1.08T (recent top)
• $1.15T
• Potential for new all-time highs if momentum builds
✅ As long as price holds above the $920–$930B support zone, bulls remain in control. This keeps the door open for selective altcoin entries — ideally, projects with real structure, strong tokenomics, and clear momentum.

EURJPY ANALYSISAfter seeing the previous weekly candle close bearish and the daily from Monday close below the low of the last bearish candle which is a sign of sellers strength, we could expect further sells to continue but a simple retracement on the 4hr back to an area of interest for a potential LH structure point before further sells

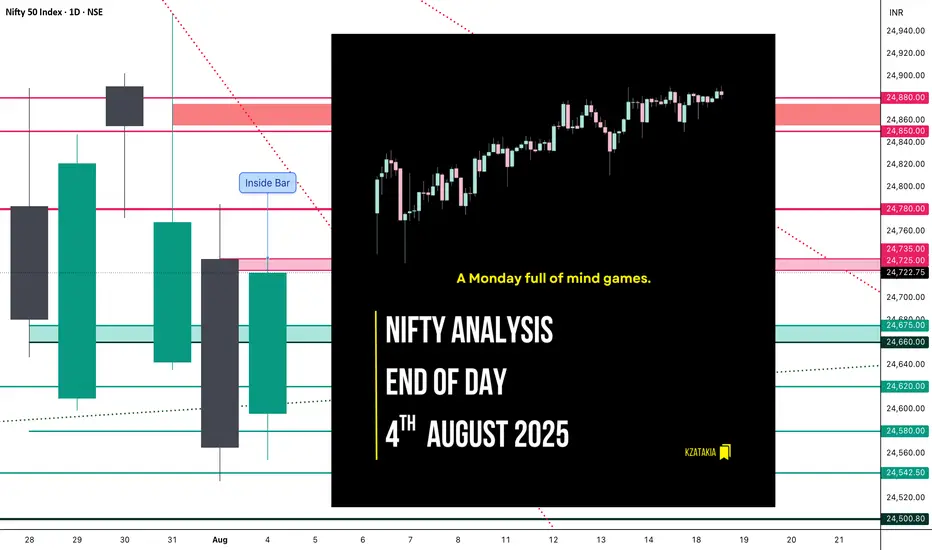
Nifty Analysis EOD – August 4, 2025 – Monday🟢 Nifty Analysis EOD – August 4, 2025 – Monday 🔴
A Monday full of mind games.
Nifty opened with a slight positive gap and immediately tested the TC of CPR, but that optimism didn’t last long — sharp rejection took it to day’s low (24,554). What followed was a rollercoaster: a 100-point recovery, a 50-point pullback — all within 10 minutes. This wild price action defined the rest of the day.
Throughout the session, Nifty remained trapped within the CPR zone. Both sides experienced multiple fakeouts, especially around initial balance (IB) zones. Even when prices nudged toward R1, repeated failed attempts to break above reflected the market’s indecisiveness. The day finally closed near the high, but conviction was still lacking.
Many option buyers likely struggled due to deceptive shadows and unexpected fractal breakouts. The entire price action stayed within Friday’s range — forming an Inside Bar structure on the daily chart. This suggests a potential range breakout trade tomorrow.
The market faced resistance near the Fibonacci 0.618–0.786 retracement of the prior fall — aligning with 24,740–24,780 zones. A close above 24,780 tomorrow could shift momentum back in the bulls’ favour. If not, bears still hold the upper ground.
📈 5 Min Time Frame Chart with Intraday Levels
📉 Daily Time Frame Chart with Intraday Levels
📊 Daily Candle Breakdown
Open: 24,596.05
High: 24,736.25
Low: 24,554.00
Close: 24,722.75
Change: +157.40 (+0.64%)
Candle Type:
🟢 Bullish Marubozu-like — reflects a strong control by buyers after early weakness.
Structure Breakdown:
Real Body: 126.70 pts (Bullish)
Upper Wick: 13.50 pts (Minor resistance near close)
Lower Wick: 42.05 pts (Early dip got bought aggressively)
Key Insight:
Closed near the high of the day — positive bias for tomorrow
Inside Bar formed – Expect a breakout trade
24,780+ closing will turn sentiment bullish
🛡 5 Min Intraday Chart
⚔️ Gladiator Strategy Update
ATR: 209.36
IB Range: 115.95 → Medium
Market Structure: Balanced
Trade Summary:
🕚 11:30 AM – Long Entry → SL Hit
🕛 12:30 PM – Long Entry → SL Hit
🕐 13:10 PM – Short Entry → SL Hit
Tough day — strategy got chopped in noise-heavy moves.
🔍 Support & Resistance Levels
Resistance Zones:
24,725 ~ 24,735
24,780 ~ 24,795
24,860 ~ 24,880
Support Zones:
24,675 ~ 24,660
24,620
24,542 ~ 24,535
24,500
24,470 ~ 24,460
💭 Final Thoughts
"Markets love to test your patience before they reward your conviction."
Today was a lesson in restraint — avoid overtrading when structure lacks clarity. Inside bar gives us a clean slate for tomorrow. Let price lead.
✏️ Disclaimer
This is just my personal viewpoint. Always consult your financial advisor before taking any action.
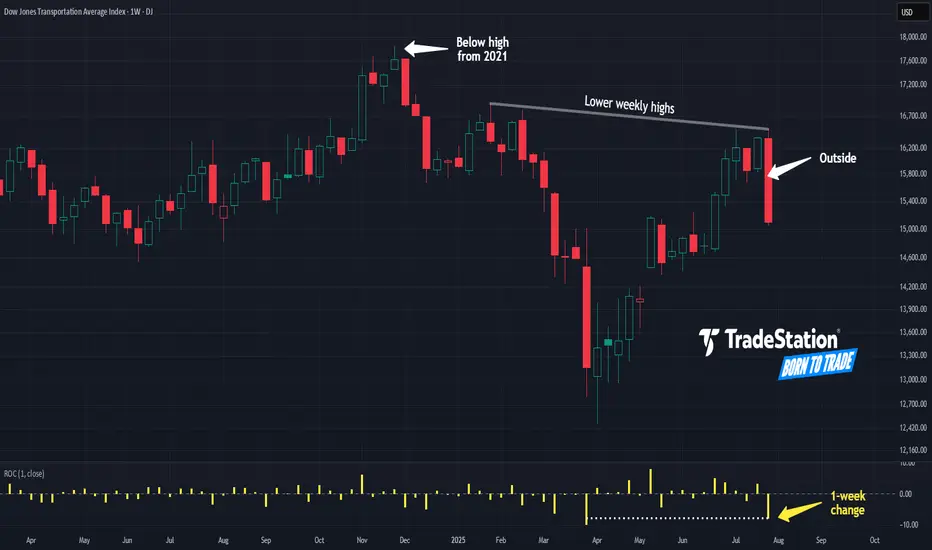
Transports: Non-Confirmation for Stocks?The S&P 500 SP:SPX hit new all-time highs last week. But one noteworthy part of the market didn’t participate: transportation stocks.
Today’s weekly chart of the Dow Jones Transportation Average shows how prices inched to a new high but failed to hold. They instead reversed and closed at the lowest level in over a month. The resulting bearish outside candle is a potential reversal pattern.
Second, DJT peaked last November below its previous all-time high from 2021. That’s a potential sign of poor relative strength.
Third is the series of lower weekly highs since late 2024. Why aren’t buyers driving the group to new records?
Fourth, rate of change in the lower study reveals the Transports lost 7.7 percent of their value last week. Aside from the extreme volatility around “Liberation Day,” it was the biggest weekly drop since September 2022.
Finally, there could be implications for the broader market because DJT is often seen as a bellwether for business and the economy in general. (This is often known as “Dow Theory.”) Given apparent weakening of the labor market last week, some investors may see a warning sign in DJT’s price action.
TradeStation has, for decades, advanced the trading industry, providing access to stocks, options and futures. If you're born to trade, we could be for you. See our Overview for more.
Past performance, whether actual or indicated by historical tests of strategies, is no guarantee of future performance or success. There is a possibility that you may sustain a loss equal to or greater than your entire investment regardless of which asset class you trade (equities, options or futures); therefore, you should not invest or risk money that you cannot afford to lose. Online trading is not suitable for all investors. View the document titled Characteristics and Risks of Standardized Options at www.TradeStation.com . Before trading any asset class, customers must read the relevant risk disclosure statements on www.TradeStation.com . System access and trade placement and execution may be delayed or fail due to market volatility and volume, quote delays, system and software errors, Internet traffic, outages and other factors.
Securities and futures trading is offered to self-directed customers by TradeStation Securities, Inc., a broker-dealer registered with the Securities and Exchange Commission and a futures commission merchant licensed with the Commodity Futures Trading Commission). TradeStation Securities is a member of the Financial Industry Regulatory Authority, the National Futures Association, and a number of exchanges.
TradeStation Securities, Inc. and TradeStation Technologies, Inc. are each wholly owned subsidiaries of TradeStation Group, Inc., both operating, and providing products and services, under the TradeStation brand and trademark. When applying for, or purchasing, accounts, subscriptions, products and services, it is important that you know which company you will be dealing with. Visit www.TradeStation.com for further important information explaining what this means.
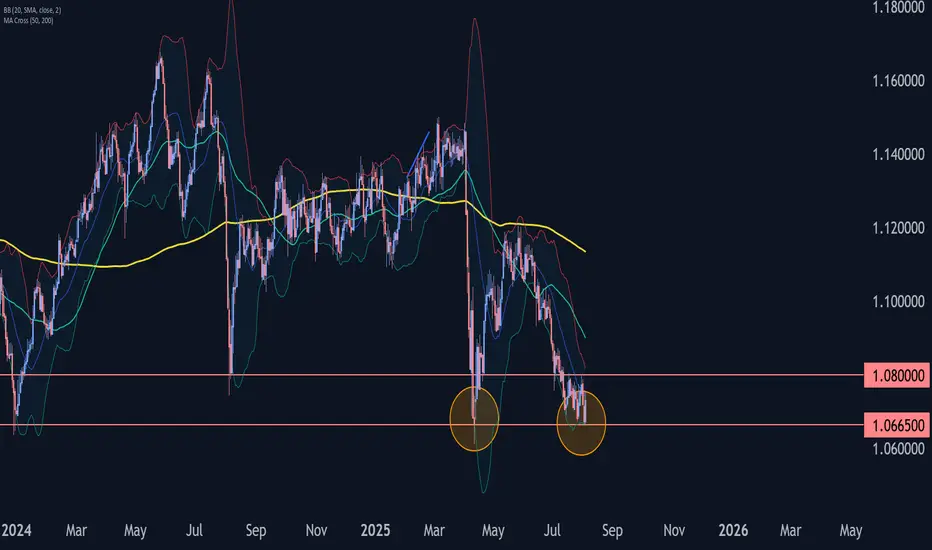
GBPCHF Wave Analysis – 4 August 2025
- GBPCHF reversed from key support level 1.0665
- Likely to rise to the resistance level 1.0800
GBPCHF currency pair recently reversed from the support zone between the pivotal support level 1.0665 (former strong support from April) and the lower daily Bollinger Band.
The upward reversal from this support zone will likely form the daily Japanese candlesticks reversal pattern Bullish Engulfing, if the pair closes today near the current levels.
Given the strength of the support level 1.0665 and the bullish divergence on the daily Stochastic, GBPCHF can be expected to rise to the next resistance level 1.0800 (which stopped earlier corrections (ii) and ii).