GBPJPY: More Growth is Coming! 🇬🇧🇯🇵
GBPJPY will likely bounce from a key daily support,
following a formation of a double bottom pattern
on an hourly time frame.
I think that the price will reach 196.7 level soon.
❤️Please, support my work with like, thank you!❤️
I am part of Trade Nation's Influencer program and receive a monthly fee for using their TradingView charts in my analysis.
Candlestick Analysis

SILVER (XAGUSD): Bullish Reversal from Support Silver reacted significantly to the highlighted intraday resistance level during Friday's New York session.
I noticed a small double bottom pattern and the emergence of a bullish engulfing candle. I anticipate a pullback to the 37.72 level.

EURUSD: Pullback From Resistance 🇪🇺🇺🇸
EURUSD strongly reacted to the underlined intraday
resistance area after the market opening.
I see a tine double top pattern on that and a formation
of a bearish engulfing candle.
I expect a retracement to 1.154 level.
❤️Please, support my work with like, thank you!❤️

#GBPUSD: Pullback Trade Confirmed?!📈GBPUSD rebounded from the highlighted key support level,
As a confirmation signal i observed a strong bullish Change of Character (CHoCH) on the 4-hour timeframe following its test.
The target is set at 1.3350.


04/08/25 Gold Swing LevelsBack to Gold but with daily swing levels.
Monday 04/08/25 levels are marked; depending on if market opens with a gap, price should continue upwards.
Trade parameters
Entry on 5 min chart
Sl: 30-50pips
TP: 2-4x SL

XAUUSD sclping setupXAUUSD M15 create double doji evning shoting star.
Sell below: 3361.00
Stop Loss: 3364.00
1st TP: 3355
2nd TP: 3351
3rd TP: 3347
4th TP: 3341
If breakout rising trendline and 3340 then gold more downward move 3330, 3318 and 3302.

USD/JPY(20250804)Today's AnalysisMarket News:
① The US non-farm payrolls rose by 73,000 jobs in July, far below the expected 110,000; the previous two months saw a significant downward revision of 258,000 jobs, prompting traders to fully price in two Fed rate cuts before the end of the year.
② The US ISM Manufacturing PMI for July unexpectedly fell to 48, below the expected 49.5 and the lowest level since October 2024.
③ The University of Michigan Consumer Confidence Index for July reached a five-month high.
Technical Analysis:
Today's Buy/Sell Levels:
148.53
Support and Resistance Levels:
152.12
150.78
149.91
147.15
146.28
144.94
Trading Strategy:
If it breaks above 148.53, consider entering a buy position, with the first target price being 149.91. If it breaks below 147.15, consider entering a sell position, with the first target price being 146.28.

Doge is a LaggerHello I am the Cafe Trader.
Today we are looking at DOGE.
Normally I refuse to look at "Meme Coins" but with a 33 Billion Dollar Market cap, I don't think it falls into it's own category.
Doge, like many Crypto, have come alive. If this is one you are looking at, here are the Keys:
Short Term
A new seller did prevail as of July 23rd. It's important to note that they are still not in control of this rally. We need to see a key buyer get taken out first. This leads us to the scenario I have drawn.
Green Machine
Big buyers move markets... A lot. They can't buy what they want to buy on the open market without a reaction, so what do they do? Simple
Buy... then wait... then buy again near where they bought before.
So your "Strong buyer" is that area.
You have passive buyers looking to get a good price at 19.223 This would offer the greatest position for a reversal and a continuation.
Long
Entry - .19.250
Stop - .17.050
1st TP .24.050
2nd TP .28.600
Final TP .38.250
This should take at least a month. Be prepared to not look at it everyday.
Long Term
These prices should reflect your sentiment on DOGE.
Aggressive = .20.650
Good Price = .18.900 - 19.250
STEAL = 13.950 - 14.550
Thanks for reading, Don't forget to Boost and Follow !
Happy Trading
@thecafetrader

Long trade www.tradingview.com
🟢 Buyside Trade
Pair: LINKUSD
Date: Saturday, 5th July 2025
Time: 8:00 PM
Session: Tokyo Session PM
Time Frame: 4Hr TF Entry
🔢 Trade Metrics
Entry Price: 13.161
Take Profit (TP): 25.814 (+96.14%)
Stop Loss (SL): 12.984 (−1.34%)
Risk-Reward Ratio: 70.32: 1
📈 Chart Analysis
Structure: Price broke the previous consolidation zone and retested key support levels near the 13.16 area before launching upward.
Indicators:
200 WMA (Yellow) & 50 EMA (Blue) both support continuation.
Break of market structure confirmed prior resistance as new support.

Bitcoin Outlook – Early August🟩 1M Timeframe (Monthly Overview)
The August monthly candle has just begun forming, so it’s too early to draw solid conclusions. While there’s selling pressure visible, it’s not yet a confirmed reversal on the higher timeframe.
🟨 1W Timeframe (Weekly View)
On the weekly chart, structure leans bearish. If momentum continues, a mid-term downside target of $105,000 remains in play.
🟧 1D Timeframe (Daily Perspective)
The daily chart shows some buying interest around $108,500, suggesting a possible short-term rebound.
However, if price fails to hold above this level, it may drop to retest the $105,000 zone.
A break below that would open the door for a move toward $102,000.
⸻
🧭 Key Notes:
1. If the bearish view is to remain valid, price must not break above $120,000.
A higher high would indicate potential trend continuation on the bullish side.
2. Rebounds are possible along the way.
Opening a short position in the current zone is viable, but a tight stop-loss around $114,500 ± $500 is advised.
This level is a lower high on the 4H timeframe — a critical pivot that, if held, confirms bearish continuation.
But if price breaks above it, the downtrend scenario weakens, and traders may wait for a re-entry closer to the $120,000 resistance zone.
⸻
🧠 Summary & Strategy:
• Monthly: too early to call
• Weekly: bearish bias, targeting $105,000
• Daily: watch $108,500 for short-term support
• Downside levels: $105,000 → $102,000
• No new high above $120,000 if bears are to stay in control
• Short entries okay here; SL ~ $114,500 ± $500
• Wait to re-short at $120,000 if invalidated

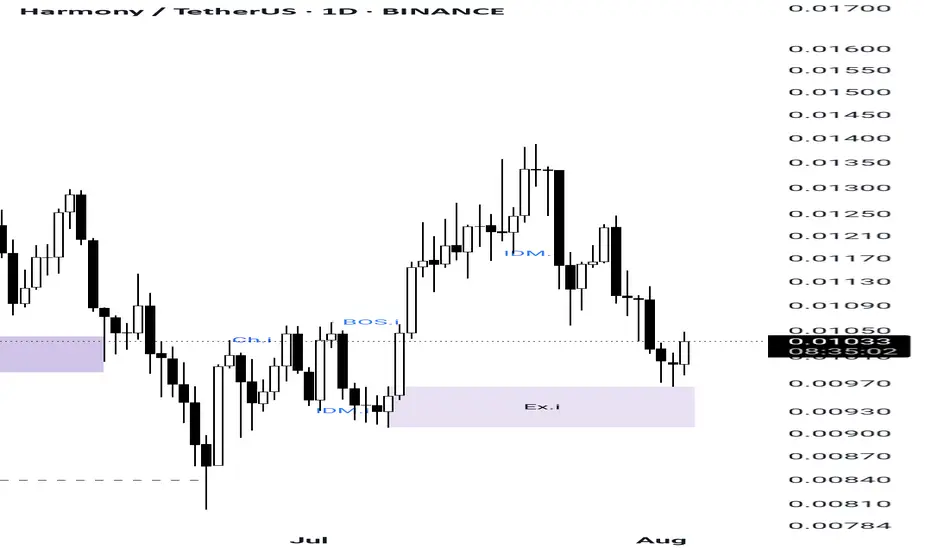
Harmony(ONE) is going to pump...As you can see in ONE Structure it made a minor structure and price touched its minor EX orderblock and for sure it made a SCOB confirmation
So now its ready to pump...
It's my own analysis and it's not investment advise , so DYOR
Gold Outlook for August🔎 Gold Market Outlook — Early August Update
🟩 1M Timeframe (Monthly Overview)
Gold just closed its 1M candle a few days ago, forming a red doji, which is the 4th candle since the All Time High around $3,500/oz.
Although the monthly candle closed red, it’s not yet a confirmed signal that sellers have taken control.
The new candle that opened on August 1st did not make a new low, but strong buying pressure pushed the price up about $60 from the open.
This behavior indicates accumulation from the Buy side in lower timeframes like 1W and 1D.
Because of this, it’s too early to conclude that gold has reversed into a bearish trend. We need to wait for a clear red close on the 1M timeframe — which still has 28 days left to develop.
⸻
🟨 1W / 1D Timeframe (Weekly & Daily Perspective)
Selling pressure was light last week with no follow-through from bears. This suggests the market is more likely to chase buys rather than dump in the coming week.
However, entering orders blindly is risky — we must wait for confirmation signals from the price action on the 1D timeframe to see if price can truly hold support.
⸻
🧭 Key Level to Watch: $3,290
I’m watching the $3,290 area closely.
If price can hold above this support with clear reversal signals from candles or price action, I’ll look to enter Long positions.
⸻
🧠 Summary: Basic Strategy
• Focus on the Long side
• Wait for price to hold above $3,290
• Confirm with candles on 1D before entry
• Be patient — the 1M candle still has time to play out
“In trading, don’t let emotions override your plan, and don’t let the chart fool you into ignoring the bigger picture.”
⸻
❗️Note:
Candles only confirm their signal after closing.
If you want earlier entries, consider drilling down to smaller timeframes like 4H or 1H, but manage your risk carefully.

EURJPY about to enter into a DowntrendRecently EURJPY reached high points in the chart at 173.016
From there it fell and continued downwards.
I took a quick demo trade with an inverse risk to reward. Not the ideal thing to do, but I didn't want to keep my TP higher than 173.016 since we know it's a strong resistance level.
Got a quick win there.
Now, on the 4H, we can see that one huge red candle look out the previous five green candles.
It indicates that selling pressure is incoming.
This would be a good time to sell now. But I do want to see price go below 171.540 just to get that extra confirmation. Just in case, price decides to consolidate or go high for a while.
Have to stay vigilant with this market now.
TP1 will be 171.100.
TP2 will be 170.000
TP3 will be 168.800
Lets see how this trade plays out.

Monday's market forecast and related layout#XAUUSD
Judging from the monthly chart, although July closed with a large positive line, there is still great resistance above 3439-3501. Possible gold price trends for next week are as follows:
1. If gold prices open higher, focus on the previous highs of 3375-3385. If resistance and pressure are encountered, consider shorting, aiming for a volatile decline, retracing Friday's gains.
2. The market is volatile and sideways, so wait and see.
3. Gold fell back. Referring to Friday’s trading strategy, you can consider going long around 3335 to bet on a short-term rebound. Leave yourself some room for participation (the possibility of touching 3338 again and rebounding is not ruled out)

GOLD (XAUUSD): Move Up Ahead?!
Friday's fundamentals made Gold very bullish during the New York session.
The price formed a high momentum bullish candle on a daily,
breaking a minor daily resistance area.
It gives us a confirmed Change of Character CHoCH and indicates
a highly probable bullish continuation next week.
I think that the price will reach 3400 level.
❤️Please, support my work with like, thank you!❤️
I am part of Trade Nation's Influencer program and receive a monthly fee for using their TradingView charts in my analysis.


GBpJpY RETRACEMENT This is a possible retracement
Use a reasonable lot size
Risk only what you can afford
I wish you success

Narayana Hrudayalaya can turnaround from trendline. Narayana Hrudayalaya Ltd. engages in the provision of medical and health care services. It also provides services in the areas of cardiac surgery, cardiology, diabetes and endocrinology, gastroenterology, general surgery, neurosciences, facial surgery, nephrology, obstetrics and gynecology, orthopedics, oncology, pediatrics, transplant, urology, and vascular surgery; and other specialty services, such as dental, dermatology, emergency medicine, ears, nose, and throat, family medicine, general medicine, and genetic.
NH Closing price is 1945.50. The positive aspects of the company are Companies with Zero Promoter Pledge, Company able to generate Net Cash - Improving Net Cash Flow for last 2 years and FII / FPI or Institutions increasing their shareholding. The Negative aspects of the company are high Valuation (P.E. = 50.6), Stocks Underperforming their Industry Price Change in the Quarter, Increasing Trend in Non-Core Income, PEG greater than Industry PEG and MFs decreased their shareholding last quarter
Entry can be taken after closing above 1950 Historical Resistance in the stock will be 2015, 2063 and 2098. PEAK Historic Resistance in the stock will be 2148, 2195 and 2269. Stop loss in the stock should be maintained at Closing below 1863 or 1648 depending upon your risk taking ability.
Disclaimer: The above information is provided for educational purpose, analysis and paper trading only. Please don't treat this as a buy or sell recommendation for the stock or index. The Techno-Funda analysis is based on data that is more than 3 months old. Supports and Resistances are determined by historic past peaks and Valley in the chart. Many other indicators and patterns like EMA, RSI, MACD, Volumes, Fibonacci, parallel channel etc. use historic data which is 3 months or older cyclical points. There is no guarantee they will work in future as markets are highly volatile and swings in prices are also due to macro and micro factors based on actions taken by the company as well as region and global events. Equity investment is subject to risks. I or my clients or family members might have positions in the stocks that we mention in our educational posts. We will not be responsible for any Profit or loss that may occur due to any financial decision taken based on any data provided in this message. Do consult your investment advisor before taking any financial decisions. Stop losses should be an important part of any investment in equity.

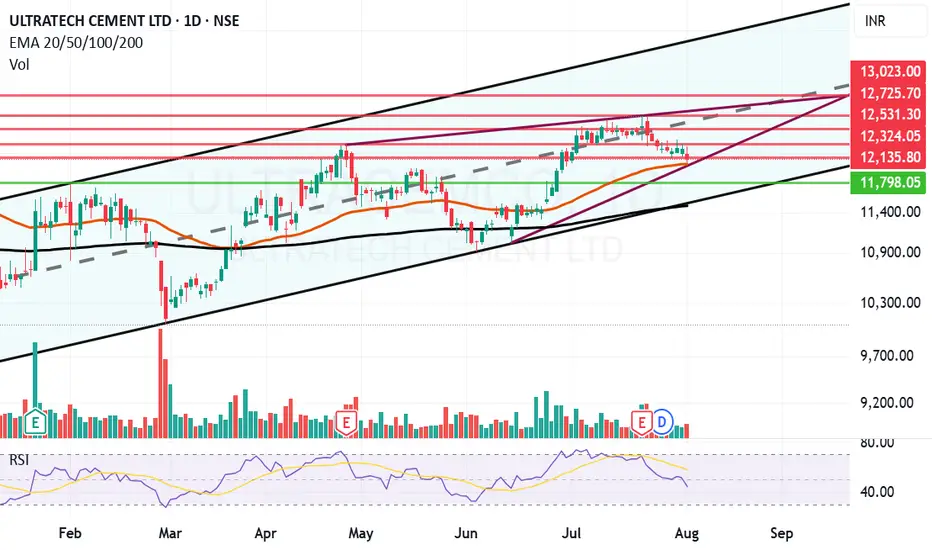
Ultratech can bounce back from Motherline support. UltraTech Cement Ltd. is a holding company, which engages in the provision of manufacture and sale of cement and cement related products.
UltraTech Cement Ltd. Closing price is 12113. The positive aspects of the company are Companies with Zero Promoter Pledge, Companies with Low Debt, FII / FPI or Institutions increasing their shareholding and MFs increased their shareholding last quarter. The Negative aspects of the company are high Valuation (P.E. = 51), Stocks Underperforming their Industry Price Change in the Quarter, RSI indicating price weakness, Increasing Trend in Non-Core Income and Declining Net Cash Flow : Companies not able to generate net cash.
Entry can be taken after closing above 12136 Historical Resistance in the stock will be 12324 and 12531. PEAK Historic Resistance in the stock will be 12725 and 13023. Stop loss in the stock should be maintained at Closing below 11798 or 11492 depending upon your risk taking ability.
Disclaimer: The above information is provided for educational purpose, analysis and paper trading only. Please don't treat this as a buy or sell recommendation for the stock or index. The Techno-Funda analysis is based on data that is more than 3 months old. Supports and Resistances are determined by historic past peaks and Valley in the chart. Many other indicators and patterns like EMA, RSI, MACD, Volumes, Fibonacci, parallel channel etc. use historic data which is 3 months or older cyclical points. There is no guarantee they will work in future as markets are highly volatile and swings in prices are also due to macro and micro factors based on actions taken by the company as well as region and global events. Equity investment is subject to risks. I or my clients or family members might have positions in the stocks that we mention in our educational posts. We will not be responsible for any Profit or loss that may occur due to any financial decision taken based on any data provided in this message. Do consult your investment advisor before taking any financial decisions. Stop losses should be an important part of any investment in equity.
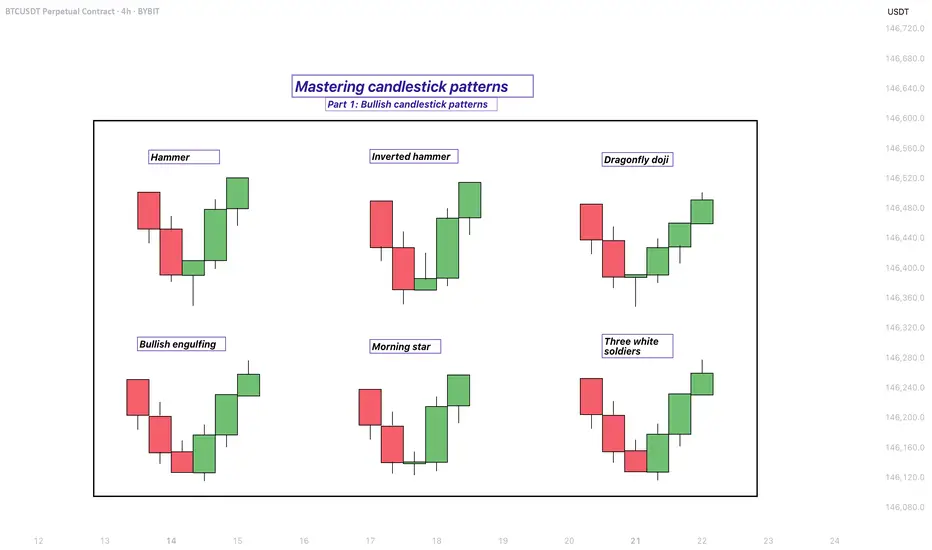
Mastering bullish candlestick patterns - How to use it!In this guide, we will explore some of the most important bullish candlestick patterns used in technical analysis. These patterns are essential tools for traders and investors who want to better understand market sentiment and identify potential reversal points where prices may start moving upward.
What will be explained:
- What are bullish candlestick patterns?
- What is the hammer?
- What is the inverted hammer?
- What is the dragonfly doji?
- What is the bullish engulfing?
- What is the morning star?
- What is the three white soldiers?
- How to use bullish candlestick patterns in trading?
What are bullish candlestick patterns?
Bullish candlestick patterns are specific formations on a candlestick chart that signal a potential reversal from a downtrend to an uptrend. These patterns are used by traders and investors to identify moments when the market sentiment may be shifting from bearish to bullish. Recognizing these patterns can help traders time their entries and make more informed decisions based on price action and market psychology. While no single pattern guarantees success, they can provide valuable clues when combined with other forms of analysis such as support and resistance, trendlines, and volume.
What is the Hammer?
The Hammer is a single-candle bullish reversal pattern that typically appears at the bottom of a downtrend. It has a small real body located at the upper end of the trading range, with a long lower shadow and little to no upper shadow. The long lower wick indicates that sellers drove the price lower during the session, but buyers stepped in strongly and pushed the price back up near the opening level by the close. This shift in momentum suggests that the downtrend could be coming to an end, and a bullish move might follow.
What is the Inverted Hammer?
The Inverted Hammer is another single-candle bullish pattern that also appears after a downtrend. It has a small body near the lower end of the candle, a long upper shadow, and little to no lower shadow. This pattern shows that buyers attempted to push the price higher, but sellers managed to bring it back down before the close. Despite the failure to hold higher levels, the buying pressure indicates a possible reversal in momentum. Traders usually look for confirmation in the next candle, such as a strong bullish candle, before acting on the signal.
What is the Dragonfly Doji?
The Dragonfly Doji is a special type of candlestick that often indicates a potential bullish reversal when it appears at the bottom of a downtrend. It forms when the open, high, and close prices are all roughly the same, and there is a long lower shadow. This pattern shows that sellers dominated early in the session, pushing prices significantly lower, but buyers regained control and drove the price back up by the end of the session. The strong recovery within a single period suggests that the selling pressure may be exhausted and a bullish reversal could be imminent.
What is the Bullish Engulfing?
The Bullish Engulfing pattern consists of two candles and is a strong indication of a reversal. The first candle is bearish, and the second is a larger bullish candle that completely engulfs the body of the first one. This pattern appears after a downtrend and reflects a shift in control from sellers to buyers. The bullish candle’s large body shows strong buying interest that overpowers the previous session’s selling. A Bullish Engulfing pattern is even more significant if it occurs near a key support level, and it often signals the beginning of a potential upward move.
What is the Morning Star?
The Morning Star is a three-candle bullish reversal pattern that occurs after a downtrend. The first candle is a long bearish one, followed by a small-bodied candle (which can be bullish, bearish, or a doji), indicating indecision in the market. The third candle is a strong bullish candle that closes well into the body of the first candle. This formation shows a transition from selling pressure to buying interest. The Morning Star is a reliable signal of a shift in momentum, especially when confirmed by high volume or a breakout from a resistance level.
What is the Three White Soldiers?
The Three White Soldiers pattern is a powerful bullish reversal signal made up of three consecutive long-bodied bullish candles. Each candle opens within the previous candle’s real body and closes near or at its high, showing consistent buying pressure. This pattern often appears after a prolonged downtrend or a period of consolidation and reflects strong and sustained buying interest. The Three White Soldiers suggest that buyers are firmly in control, and the market may continue moving upward in the near term.
How to use bullish candlestick patterns in trading?
To effectively use bullish candlestick patterns in trading, it’s important not to rely on them in isolation. While these patterns can signal potential reversals, they work best when combined with other technical tools such as support and resistance levels, moving averages, trendlines, and volume analysis. Traders should also wait for confirmation after the pattern forms, such as a strong follow-through candle or a break above a resistance level, before entering a trade. Risk management is crucial—always use stop-loss orders to protect against false signals, and consider the broader market trend to increase the probability of success. By integrating candlestick analysis into a comprehensive trading strategy, traders can improve their timing and increase their chances of making profitable decisions.
Thanks for your support. If you enjoyed this analysis, make sure to follow me so you don't miss the next one. And if you found it helpful, feel free to drop a like 👍 and leave a comment 💬, I’d love to hear your thoughts!
SILVER (XAGUSD): More Growth Ahead
It looks like Silver is going to continue growing next week,
following a strong bullish reaction to a key daily horizontal support.
The next strong resistance is 3748.
It will be the next goal for the buyers.
❤️Please, support my work with like, thank you!❤️
I am part of Trade Nation's Influencer program and receive a monthly fee for using their TradingView charts in my analysis.
