GRTUSDT Triangle Coil Tension Builds Bullish Breakout in FocusGRTUSDT is forming a clean symmetrical triangle with price rebounding from the lower trendline which brings an encouraging signal for potential continuation to the upside.
As long as the structure holds, we anticipate a breakout above the triangle, which could ignite strong bullish momentum. The external demand zone remains ideal for strategic accumulation, while the internal supply area should be monitored for signs of short-term rejection.
If buyers absorb pressure at that level, GRT could rally toward the crucial upper supply zone, which marks the next major area for distribution. Let’s see how this unfolds, feel free to share your perspective.
Candlestick Analysis

BTC's latest trading strategy and analysis layout#BTCUSD
BTC's current technical signals show a bull-bear tug-of-war situation.If a golden cross is formed near the zero axis, it may indicate a new wave of rise; if it falls below the zero axis, we need to be wary of a deep correction.
There are certain opportunities for both bulls and bears in the current market, but global regulatory policies have not yet been unified. Policies such as the US "GENIUS Act" may affect BTC and require continued attention. BTC is currently facing significant buying support around 117,500, but the hourly chart shows that there is still potential for a continued pullback. The current trend has not yet finished. Pay attention to the support level of 116,000 below. If it falls below, it may fall into the consolidation range of 116,000-114,000. For aggressive traders, consider going long at 117,500-116,500, with a target of 118,500-119,500. A break above this level could lead to 120,000.
🚀 117500-116500
🚀 118500-119500

European session under pressure 3321 continue to shortI reminded everyone last night that if gold holds the 3300 mark, it will consolidate in the 3300-3345 range in the short term. The current gold price basically fluctuates narrowly between 3320-3310. Judging from the daily chart, the short-term upper pressure is at 3330. Only if the daily line stands firmly above 3330, there is a possibility of a rebound upward in the short term. Judging from the hourly chart, gold is still in a downward trend, and the hourly line is blocked near 3321. In the short term, if it cannot break through 3320-3330, gold will continue to fall. You can consider shorting, with the target at 3310-3300. If the European session is still volatile, maintain high shorts and low longs to participate in the cycle.
My premium privileges are about to expire, and subsequent trading strategies and analysis will be published in the group.

GBPCHF: Bearish Movement Confirmed 🇬🇧🇨🇭
GBPCHF looks bearish after the news today.
The price tested a solid rising trend line on a daily
and formed a confirmed bearish Change of Character
on an hourly time frame.
I think that the price will continue falling and reach 1.0702 level.
❤️Please, support my work with like, thank you!❤️
I am part of Trade Nation's Influencer program and receive a monthly fee for using their TradingView charts in my analysis.

Hindustan Unilever looks strong. Hindustan Unilever Ltd. engages in the manufacture of consumer goods. It operates through the following segments: Home Care, Beauty and Personal Care, Foods and Refreshments, and Others. It is one of leading company in FMCG sector.
Hindustan Unilever Closing price is 2453.60. Dividend Yield @CMP = 1.78%. The positive aspects of the company are Stocks Outperforming their Industry Price Change in the Quarter, Companies with Zero Promoter Pledge, Company able to generate Net Cash - Improving Net Cash Flow for last 2 years, FII / FPI or Institutions increasing their shareholding and MFs increased their shareholding last quarter. The Negative aspects of the company are high Valuation (P.E. = 53.9), Increasing Trend in Non-Core Income, Declining Revenue every quarter for the past 2 quarters and PEG greater than Industry PEG.
Entry can be taken after closing above 2460 Historical Resistance in the stock will be 2498 and 2534. PEAK Historic Resistance in the stock will be 2571 and 2601. Stop loss in the stock should be maintained at Closing below 2391 or 2369 depending upon your risk taking ability.
Disclaimer: The above information is provided for educational purpose, analysis and paper trading only. Please don't treat this as a buy or sell recommendation for the stock or index. The Techno-Funda analysis is based on data that is more than 3 months old. Supports and Resistances are determined by historic past peaks and Valley in the chart. Many other indicators and patterns like EMA, RSI, MACD, Volumes, Fibonacci, parallel channel etc. use historic data which is 3 months or older cyclical points. There is no guarantee they will work in future as markets are highly volatile and swings in prices are also due to macro and micro factors based on actions taken by the company as well as region and global events. Equity investment is subject to risks. I or my clients or family members might have positions in the stocks that we mention in our educational posts. We will not be responsible for any Profit or loss that may occur due to any financial decision taken based on any data provided in this message. Do consult your investment advisor before taking any financial decisions. Stop losses should be an important part of any investment in equity.

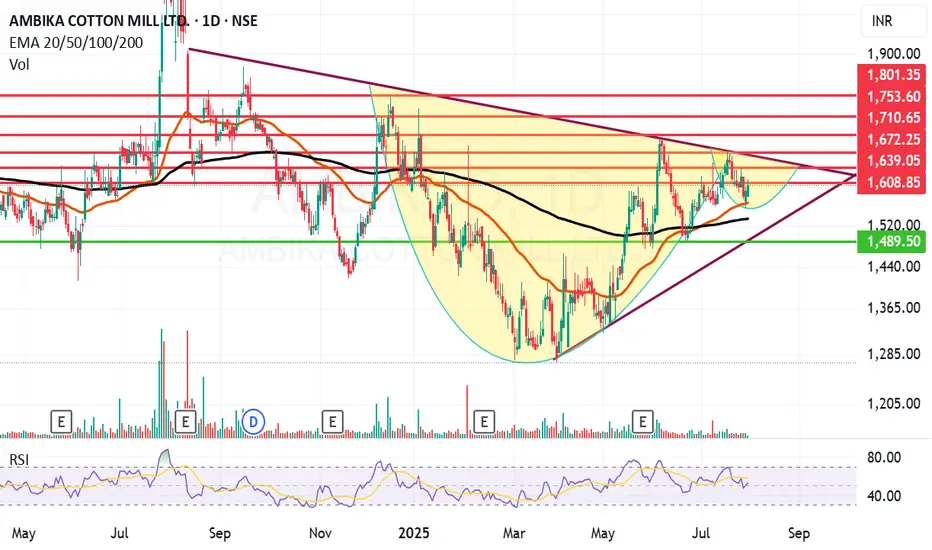
Ambika Cotton looking ambitious on the charts and fundamentally.Ambika Cotton Mills Ltd. engages in the provision of manufacturing and selling of cotton yarn catering to the needs of manufacturers of premium branded shirts and t-shirts.
Ambika Cotton Mills Ltd. Closing price is 1603.20 Dividend Yield @CMP = 2.35%. The positive aspects of the company are attractive Valuation (P.E. = 13.9), Stocks Outperforming their Industry Price Change in the Quarter, Companies with Zero Promoter Pledge, Companies with Low Debt, Rising Net Cash Flow and Cash from Operating activity and FII / FPI or Institutions increasing their shareholding. The Negative aspects of the company are Increasing Trend in Non-Core Income, Fall in Quarterly Revenue and Net Profit (YoY) and Companies with growing costs YoY for long term projects.
Entry can be taken after closing above 1609 Historical Resistance in the stock will be 1631, 1672 and 1710. PEAK Historic Resistance in the stock will be 1753 and 1801. Stop loss in the stock should be maintained at Closing below 1533 or 1489 depending upon your risk taking ability.
Disclaimer: The above information is provided for educational purpose, analysis and paper trading only. Please don't treat this as a buy or sell recommendation for the stock or index. The Techno-Funda analysis is based on data that is more than 3 months old. Supports and Resistances are determined by historic past peaks and Valley in the chart. Many other indicators and patterns like EMA, RSI, MACD, Volumes, Fibonacci, parallel channel etc. use historic data which is 3 months or older cyclical points. There is no guarantee they will work in future as markets are highly volatile and swings in prices are also due to macro and micro factors based on actions taken by the company as well as region and global events. Equity investment is subject to risks. I or my clients or family members might have positions in the stocks that we mention in our educational posts. We will not be responsible for any Profit or loss that may occur due to any financial decision taken based on any data provided in this message. Do consult your investment advisor before taking any financial decisions. Stop losses should be an important part of any investment in equity.
EURUSD Long, 29 JulyReversal Setup from Daily OB + LTF Confluence
Price tapped into a Daily Bullish OB with 50EMA support, signaling potential for a bullish reaction. While structure isn’t perfect, the overextension and DXY correlation offer strong intraday confluence.
📈 HTF Confluence:
✅ Sitting inside a Daily Bullish Orderblock
📍 50EMA in the same area → added support
🟢 Expecting a bounce from this zone, even if HTF trend isn’t clearly bullish yet
📉 LTF Context:
💤 Asia range formed, still unfilled → clean liquidity target
📉 Overextended bearish move into 15m POI
🪞 DXY at its own 15m POI + Asia range to complete → supports EU upside
🎯 Entry Plan:
✅ Clear 1m BOS after reacting from 15m Decisional OB
🎯 Entry taken at 5m OB inside that 15m POI zone
⚠️ Decisional OB isn’t ideal, but stacked confluences justify the risk
🛡 SL: Below 5m OB
📌 TP: Asia high + potential continuation if DXY breaks lower

XAU/USD 29 July 2025 Intraday AnalysisH4 Analysis:
-> Swing: Bullish.
-> Internal: Bullish.
You will note that price has targeted weak internal high on three separate occasions which has now formed a triple top, this is a bearish reversal pattern and proving this zone is a strong supply level. This is in-line with HTF bearish pullback phase.
Remainder of analysis and bias remains the same as analysis dated 23 April 2025.
Price has now printed a bearish CHoCH according to my analysis yesterday.
Price is now trading within an established internal range.
Intraday Expectation:
Price to trade down to either discount of internal 50% EQ, or H4 demand zone before targeting weak internal high priced at 3,500.200.
Note:
The Federal Reserve’s sustained dovish stance, coupled with ongoing geopolitical uncertainties, is likely to prolong heightened volatility in the gold market. Given this elevated risk environment, traders should exercise caution and recalibrate risk management strategies to navigate potential price fluctuations effectively.
Additionally, gold pricing remains sensitive to broader macroeconomic developments, including policy decisions under President Trump. Shifts in geopolitical strategy and economic directives could further amplify uncertainty, contributing to market repricing dynamics.
H4 Chart:
M15 Analysis:
-> Swing: Bullish.
-> Internal: Bullish.
H4 Timeframe - Price has failed to target weak internal high, therefore, it would not be unrealistic if price printed a bearish iBOS.
The remainder of my analysis shall remain the same as analysis dated 13 June 2025, apart from target price.
As per my analysis dated 22 May 2025 whereby I mentioned price can be seen to be reacting at discount of 50% EQ on H4 timeframe, therefore, it is a viable alternative that price could potentially print a bullish iBOS on M15 timeframe despite internal structure being bearish.
Price has printed a bullish iBOS followed by a bearish CHoCH, which indicates, but does not confirm, bearish pullback phase initiation. I will however continue to monitor, with respect to depth of pullback.
Intraday Expectation:
Price to continue bearish, react at either M15 supply zone, or discount of 50% internal EQ before targeting weak internal high priced at 3,451.375.
Note:
Gold remains highly volatile amid the Federal Reserve's continued dovish stance, persistent and escalating geopolitical uncertainties. Traders should implement robust risk management strategies and remain vigilant, as price swings may become more pronounced in this elevated volatility environment.
Additionally, President Trump’s recent tariff announcements are expected to further amplify market turbulence, potentially triggering sharp price fluctuations and whipsaws.
M15 Chart:

The latest trend analysis and layout of the day,flexible adoptio#XAUUSD
⚠️News focus on the Sino-US trade talks, which may affect the gold trend.
Since the opening of the market today, gold has been fluctuating in a narrow range in the short term, without giving a clear trading direction🤔, and the short-term trend has not changed much.📊
🚦It remains constrained by resistance and a downward trend. In the short term, we need to pay attention to the 3300 mark below and the support of 3295-3285📈. On the upside, we should pay attention to the short-term suppression level of 3321-3333 and yesterday's high of 3345-3350.📉
In the short term, as long as it does not break through yesterday's high point, the volatile downward trend will not change. 🐂Once it breaks through, the short-term decline will stop, and the market will continue the bull rebound to test 3370~3380 or even 3400 before falling again.
Therefore, short-term trading focuses on the 3300 mark below and the long trading opportunities at 3295-3285. On the upside, defend the 3345-3350 highs and establish short positions.🎯
🚀 BUY 3310-3330
🚀 TP 3321-3333
🚀 BUY 3295-3285
🚀 TP 3310-3330
🚀 SELL 3320-3330
🚀 TP 3310-3300
🚀 SELL 3345-3350
🚀 TP 3330-3285

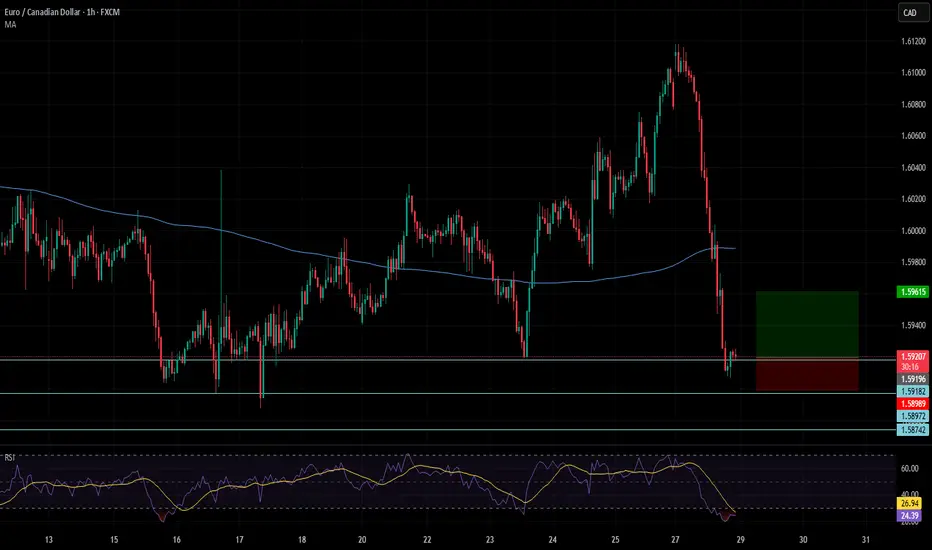
EURCAD 1H longEURCAD 1 H made a beatiful sharp drop, now stalling arround some good support levels.
When such a drop happens with no pullback formed yet I'm happy to buy the way down.
Because the pullback has to come soon buyers step in at the support levels.
My plan is simple I open a manual grid at the support levels I draw and aim for a 2R profit
Current grid 3 levels
1 market order
2 buy limits
Tp 2R
extra confirmation RSI is oversold
Euro Futures Idea.From HTF direction to LTF direction, this is my Trade Idea for the week of 28 July - 1 Aug.
Key Things in this trade idea, HTF PDAs, Liquidity of news high and daily swing and MMSM going on.

GJ SHORT (Scalp)I have a Supply zone lined at 198.345, found on the 15min. It also correlates with previous hourly resistance found towards the end of June.
I don't expect a massive falloff from this point so I'm just targeting at 1:2RR.
If extreme bearish momentum is to be found, I personally would wait for the unfilled gap at 199.500 to be filled first.
However, by the time you could consider a shift to bullish structure.
For now, I'm focusing on my 1:2 short today.

US CRUDE OIL(WTI): Very Bullish Pattern📈USOIL has reached a significant horizontal demand zone on the daily chart, leading to price consolidation and the formation of a double bottom pattern with a higher low.
Yesterday, the market rebounded, creating a new local higher high that broke above the pattern's neckline.
This suggests a typical bullish reversal, and the oil price is expected to rise towards 64.40.

EURAUD: Bullish Move After a Trap 🇪🇺 🇦🇺
There is a high chance that EURAUD will rise from the underlined support.
A confirmed liquidity grab and a consequent bullish imbalance
provide a strong confirmation.
Goal - 1.7794
❤️Please, support my work with like, thank you!❤️

GBPUSD: Bearish Reversal Coming?!The 📉GBPUSD pair formed a significant head and shoulders pattern on the daily chart.
The neckline was violated yesterday, with a daily candle closing below it. I anticipate a downward movement.
With the next support level at 1.3170.

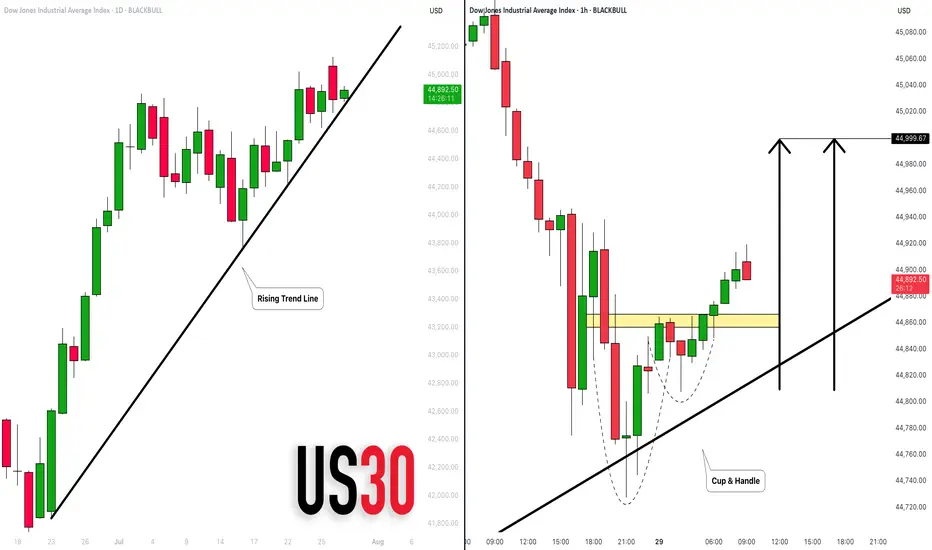
DOW JONES INDEX (US30): Bullish Move From Trend Line
There is a high probability that US30 will continue rising today,
following a test of a solid rising trend line on a daily.
As a confirmation, I see a cup & handle on that after its test
on an hourly time frame.
Goal - 45000
❤️Please, support my work with like, thank you!❤️
EURJPY ANALYSISAfter seeing the previous daily candle close as an engulfing and trading below the moving average we could be looking for further sell off but with the fundamentals coming out for the day we could see slowed movement till the news comes out

GBPUSD SELL After seeing the previous daily close below the low of the weekly bullish support we could expect this pair to continue its move down following the 4hr structure now at a low point we could see a retracement into the Fibonacci area

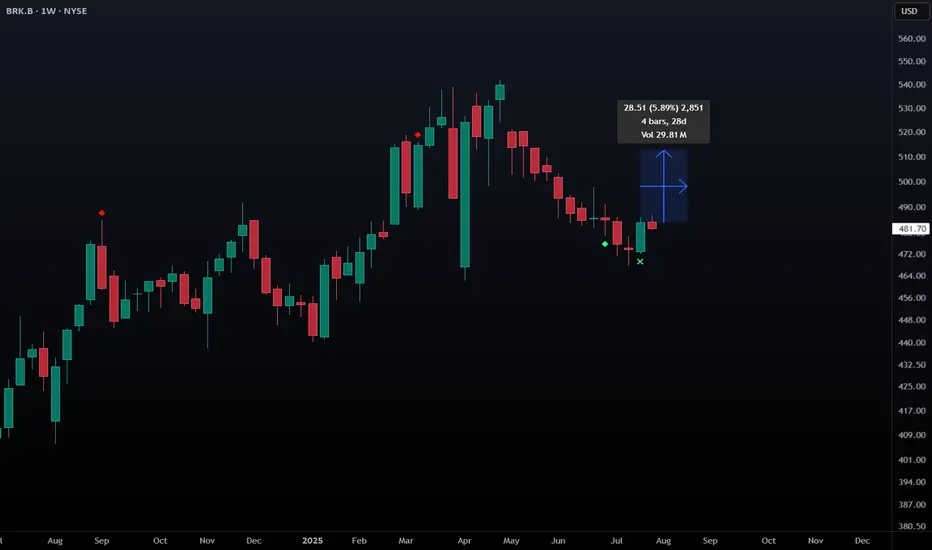
BRK.B - L2 Bullish Weekly Exhaustion SignalNYSE:BRK.B NYSE:BRK.A has triggered a level 2 bullish exhaustion signal on the weekly. This signal has triggered just 3 times in the stock's history with a 100% win rate and avg move of 5.89% over the following 5 candles.
USD/JPY(20250729)Today's AnalysisMarket news:
After gold prices soared to an all-time high of more than $3,500 an ounce in April, the latest report from the Commodity Futures Trading Commission (CFTC) showed that fund managers have increased their bullish bets to the highest level in 16 weeks.
Technical analysis:
Today's buy and sell boundaries:
148.19
Support and resistance levels:
149.23
148.84
148.59
147.78
147.53
147.14
Trading strategy:
If the price breaks through 148.59, consider buying, the first target price is 148.84
If the price breaks through 148.19, consider selling, the first target price is 147.78

$BTC Daily OutlookBINANCE:BTCUSDT.P
Weekly Chart:
Bitcoin has now printed three consecutive weekly closes above the former higher-high threshold at $111 960. That series is enough to confirm a clean breakout of the prior HH-HL range and keeps the long-term bias pointed firmly higher.
That said, a near-term pullback is still on the table:
• First support — the breakout shelf at $111 960 (re-test of structure).
• Deeper support — the next V-level around $98 115.
Why the caution?
Last week’s candle left a small Failed Auction just above the new high, and Footprint data shows a cluster of aggressive buy-delta trapped in that wick. Those buyers may need to get washed out before the trend resumes.
Big picture: weekly structure is bullish; any dip into the levels above is a potential reload zone while the breakout holds.
Daily Chart:
Price action remains firmly bullish: multiple Failed-Auction rejections at the $116 860 higher-low vLevel keeps supply thin and reinforce the up-trend toward the prior ATH.
That said, remember Auction Market Theory rule #5: “When time or volume builds at the edge of balance, price often pushes through.”
• Each failed auction is absorbing resting bids.
• If sellers lean in again with size, the level can flip from support to resistance very quickly.
In practice that means:
•Base case – continuation to the highs while the Daily structure holds.
•Risk scenario – a clean break of $116 860 would open room for a deeper weekly pullback toward $107456.0
For now we treat the current weekly pullback as a fresh opportunity: scouting intraday longs as price reacts to the 1-Hourly zone.
From the footprint read-out, today’s bar finished with a neutral delta, but note where the profile is stacked: both the Value Area Low and the POC sit right at the bottom of the candle. That tells us the bulk of volume printed down at the session lows and it skewed negative, sellers were leaning hard, trying to extend the move lower.

Nifty Analysis EOD – July 28, 2025 – Monday 🟢 Nifty Analysis EOD – July 28, 2025 – Monday 🔴
⚡️ Bears Bite Back After a Hopeful Morning Surge
📊 Nifty Summary
Nifty opened with a minor gap-down of 32 points and slipped an additional 67 points in the first 3 minutes, testing the critical support zone of 24,755 ~ 24,729. After marking a day low at 24,732.70, it witnessed a sharp recovery breaching key levels — CDO, Gap, PDC — and touched the CPR BC level. Rejection from there caused a retracement to the mean, followed by another successful attempt breaching CPR BC and IB High. However, it couldn’t sustain above, as profit booking and pressure from a higher time frame bearish trendline dragged the index below the CPR zone and even past the PDL.
Support at 24,780 offered brief relief, but a bearish triangle formed between the HTF trendline and that support and The breakdown at 12:40 led to a clean move, with the pattern target achieved.
🕯 5 Min Time Frame Chart with Intraday Levels
🔁 Trend & Zone Update
📍 Resistance Zone Shifted To: 25,100 ~ 25,120
📍 Support Zone Shifted To: 24,520 ~ 24,480
🧭 What If Plans – 29th July Outlook
🅰️ Plan A (Contra Long Setup)
If market opens inside the previous day range and finds support at 24,700 ~ 24,729,
→ Potential targets: 24,780, 24,815, 24,840
🅱️ Plan B (Trend is Friend – Short Continuation)
If market opens inside range and faces resistance around 24,830 ~ 24,815,
→ Aim for: 24,780, 24,720, 24,640, 24,580
🔄 On-the-Go Plan
If market Gaps Up/Down outside previous day’s range,
→ Wait for IB formation and act based on structure & S/R levels.
🕯 Daily Time Frame Chart with Intraday Levels
🕯 Daily Candle Breakdown
Open: 24,782.45
High: 24,889.20
Low: 24,646.60
Close: 24,680.90
Change: −156.10 (−0.63%)
🕯 Candle Structure Breakdown:
Real Body: 101.55 pts (Red candle, bearish)
Upper Wick: 106.75 pts (Long — rejection from highs)
Lower Wick: 34.30 pts (Defended slightly)
🕯 Interpretation:
Tried to rally above 24,880 but faced aggressive selling. Closed well below open, forming a bearish rejection candle resembling a shooting star. Bears clearly took control after the intraday bounce attempt.
🕯 Key Insight:
Selling pressure visible from 24,880–24,900 zone.
Close below 24,700 keeps bearish tone intact.
Next Support: 24,650–24,620.
Bulls' challenge: Reclaim and close above 24,850.
🛡 5 Min Intraday Chart
⚔️ Gladiator Strategy Update
ATR: 197.91
IB Range: 122 → Medium
Market Structure: Imbalanced
Trades Triggered:
09:27 – Long Entry → 🎯 Target Hit (1:1.5 R:R)
12:40 – Short Entry → 🎯 Target Hit (1:2.5 R:R)
🧱 Support & Resistance Levels
Resistance Zones:
📍 24,729
📍 24,780
📍 24,815 ~ 24,830
📍 24,850
📍 24,920
Support Zones:
📍 24,640
📍 24,580
📍 24,520 ~ 24,480
💭 Final Thoughts
🧠 “Every breakout starts with hesitation — but not every hesitation leads to a breakout.”
Today’s structure showed strong indecision, but sellers used it to dominate.
Monday’s triangle breakdown proved that structure plus patience = power. Keep your bias flexible and trust your levels.
✏️ Disclaimer
This is just my personal viewpoint. Always consult your financial advisor before taking any action.

3300 may fall below, possibly setting a new low#XAUUSD
From the daily chart perspective, gold has a tendency to form a converging triangle, and observing the technical indicators of the daily chart, the downward trend may have just begun📉.
So, how should we plan for the evening?📊 Now there are certainly many outside buyers who will continue to increase their positions and try to recover their losses💰. So, should we continue to be long?📈 My opinion is to wait and see.👀 If the daily chart does not fall below 3300 points, it will consolidate between 3300 and 3350 points in the future. If it falls below 3300 points, we will next focus on the support level of 3295-3285 points, and then consider whether to go long🤔.
If you are more aggressive, you can consider going long near 3305 points and exit after earning $10-20. All opinions have been informed and everyone can choose to adopt them according to their own circumstances.😄
