A Follow up to: “Adjustments for Better Readings & VSA vs BTC"When a trend approaches its end, we typically observe the formation of a buying or selling climax. That was certainly the case during Wyckoff’s era. Everything he described—market manipulation, signals, footprints—remains relevant today. But you know what that also means: if it's out there, it’s old news.
Yes, this is still happening, but we need to acknowledge that this information is no longer exclusive. And when a method becomes well-known—especially among retail traders—it can be used against them. Wyckoff himself hinted at this: the manipulators can and do use these same technical patterns to deceive. His real message?
“Keep an open mind.”
📉 In our current BTC chart, we’re seeing a textbook example of potential manipulation. A selling climax is visible—normally a sign of trend exhaustion and a bullish reversal. But is that really the case here? Did the downtrend truly end?
On the 1-Hour timeframe, both the RSI and volume indicators suggest otherwise: a bearish continuation seems more likely.
🧱 We're also witnessing a real-time formation of a Double Top pattern, taking shape since June 6. Measured by body candle spreads (excluding wicks), we observe four touches within a key price rectangle. These align with a known candlestick pattern: the Tweezer Top, commonly associated with bearish reversals.
What’s more, all of this is happening within a supply zone—actually three marked zones on the chart. The most recent zone shows signs of offloading pressure, amplified by both the Double Top and bearish candlestick formations.
And I haven’t even touched on the rejection wicks or how bearish volume spikes are gaining strength. That’s where the principle of Effort vs. Result comes in—remember, nothing in the market is free.
📊 In line with our past two posts, note how price action (PA) shows equal highs while RSI diverges, reinforcing earlier signals. The signs are stacking up.
So, the critical question now is:
Are we heading below the $100.718 level for a confirmed Head & Shoulders pattern?
Or is this just a retest before another move?
If this way of reading the market resonates with you and you want to go deeper—whether it’s building confidence or spotting signals before they play out—I work with a small circle of traders sharing TA privately on a daily basis. Feel free to reach out.
Till next time be well and trade wisely!
Candlestickpattern


Types of Engulfing Candles!In trading, an Engulfing candle (or Engulfing pattern) is a two-candle reversal pattern that can indicate a potential change in market direction. It is commonly used in technical analysis in both bullish and bearish contexts.
Types of Engulfing Candles
1. Bullish Engulfing Pattern:
Occurs during a downtrend.
The first candle is bearish (red or black), showing continued selling pressure.
The second candle is bullish (green or white) and completely engulfs the body of the first candle (its open is lower and close is higher).
This pattern signals a potential reversal to the upside.
2. Bearish Engulfing Pattern:
Occurs during an uptrend.
The first candle is bullish.
The second candle is bearish and completely engulfs the first candle's body (its open is higher and close is lower).
This pattern signals a potential reversal to the downside.
Key Characteristics
The second candle’s body must fully engulf the first candle’s body (wicks/tails are not necessary to engulf).
The stronger the engulfing candle (in terms of size and volume), the more significant the signal may be.
Often more reliable when confirmed with volume or used in conjunction with other technical indicators (e.g., RSI, support/resistance levels).
Example:
Bullish Engulfing Example:
Day 1: Bearish candle opens at $100 and closes at $95.
Day 2: Bullish candle opens at $94 and closes at $101 — it completely engulfs Day 1's body.
This would suggest a potential shift from sellers to buyers.

What is a Bearish Breakaway and How To Spot One!This Educational Idea consists of:
- What a Bearish Breakaway Candlestick Pattern is
- How its Formed
- Added Confirmations
The example comes to us from EURGBP over the evening hours!
Since I was late to turn it into a Trade Idea, perfect opportunity for a Learning Curve!
Hope you enjoy and find value!

AUD/USD Price Action Analysis – Range Trading Opportunity📉 AUD/USD Price Action Analysis – Range Trading Opportunity 🔁
⚙️ Market Structure Overview:
The AUD/USD pair is currently exhibiting a well-defined range-bound market structure between the Support Zone (0.63800 – 0.64000) and the Resistance Zone (0.65200 – 0.65400).
🟩 Support Zone
📍 Identified by multiple price rejections and bullish reversals (marked with ⬆️ arrows).
💡 This area represents strong buying interest, making it a potential long-entry zone on bullish confirmation.
🟥 Resistance Zone
📍 Marked by two sharp rejections (⬇️ arrows) and upper wicks.
💡 This zone has served as a supply area, where sellers overpower buyers, signaling potential short opportunities.
🔄 Current Scenario:
Price is approaching the support zone again after rejecting the resistance area. Based on historical behavior:
📉 Short-term Bearish Momentum is in play until support is tested.
📈 Potential Bullish Reversal is likely if support holds — aligning with previous bounce behavior.
🔮 Trade Ideas:
📈 Bullish Setup:
📍Entry: Near support zone (~0.63850)
🎯Target: Resistance zone (~0.65250)
🛑Stop-loss: Below support (~0.63650)
📉 Bearish Setup (Breakdown Scenario):
📍Entry: On confirmed break below support (~0.63800)
🎯Target: Lower structure zones (TBD based on breakout leg)
🛑Stop-loss: Above broken support
📅 Key Risk Events:
🔔 Multiple high-impact USD and AUD economic events approaching.
🧭 Traders should monitor fundamentals closely for increased volatility and breakout potential.
🧠 Summary:
📌 The AUD/USD pair is currently respecting a range-bound structure.
🧱 Buying from support and selling from resistance remains the most probable high-probability strategy.
📊 Range trading suits this setup until a confirmed breakout or breakdown occurs.
🔔 Like & Follow for more clean, structured trade setups and zone-based price action ideas!

Professional Analysis: XAU/USD – GOLD Price Forecast :
📈 Professional Analysis: XAU/USD – GOLD Price Forecast 🟡
🗓️ Date: May 28–29, 2025 | ⏱ Timeframe: Intraday (Hourly)
🔍 Instrument: Gold vs. USD (XAU/USD)
📊 Technical Chart Summary
🟥 Resistance Zone:
📌 Level: $3,350 – $3,365
🛑 Price has rejected this zone multiple times, marking it as a strong supply area.
📉 Each test of resistance led to a pullback — showing seller strength 💪.
🟩 Support Zone:
📌 Level: $3,280 – $3,295
🛡 Multiple higher low bounces suggest this zone is being defended by buyers.
🔁 Price has formed 3 reaction lows, indicating accumulation 📥.
🔄 Structure & Pattern Recognition
🔺 Descending followed by Ascending Swings
⛳ Market shows a reversal attempt after forming a potential double bottom / triple test at support.
📈 Bullish structure forming with the latest swing creating a higher low.
📉 Past wave = Bearish Correction
📈 Current projection = Potential bullish impulse if the support holds.
📐 Projection & Price Action Forecast
📍 Current Price: $3,297.175
📈 Expected Move: Bounce off support → climb toward $3,330–$3,350 🔼
🧠 Rationale:
Price testing support again
Market respecting horizontal range
No clean breakdown yet
📊 Bullish Scenario (Primary)
🔁 Rebound off support
🎯 Target: Resistance zone ($3,350)
✅ Entry: Above $3,300 with bullish candle close
🛑 SL: Below $3,280
📉 Bearish Breakdown (Alternate)
❌ Break below $3,280
🎯 Target: $3,260 or lower
⚠️ Wait for confirmation candle
🔚 Conclusion
🟡 Gold (XAU/USD) is trading within a well-defined range with buyers stepping in near $3,290 and sellers near $3,355.
📌 Based on current technicals, there’s a higher probability of an upward move, unless support breaks decisively.
🛠️ Pro Tip:
💡 Use RSI + Volume to confirm momentum on breakout. Look for bullish divergence or volume surge near the bounce.

CADCHF - Sell Short - Trendline and Candle stick confluences. Market is making a series of LH and LLs- Market has rejected from trend line resistance. Bearish Engulfing candle formation is a strong confluence of market bearish trend.
we can instant enter in the market, SL would be slightly above Last confirmed LH and TPs would be with R:R of 1:1 and 1:2 respectively.

Bullish Engulfing Pattern: A Strong Reversal SignalBullish Engulfing Pattern: A Strong Reversal Signal
The bullish engulfing pattern is a two-candlestick formation that suggests a possible reversal from a downtrend to an uptrend in the financial market. This particular pattern holds immense value for traders and technical analysts as it equips them with the means to discern potential buying opportunities. In this article, we will explain how traders implement this pattern in their trading strategies.
What Is a Bullish Engulfing Pattern?
The bullish engulfing is a technical analysis pattern consisting of two candles. This formation emerges when a large bearish candlestick is succeeded by a larger green one that entirely engulfs it.
What does the bullish engulfing mean? The bullish engulfing indicates a potential shift in market sentiment, suggesting that buying pressure might surpass selling pressure in the near future and highlighting a possible reversal from a downtrend to an uptrend.
Traders can find the bullish engulfing candlestick pattern across various financial instruments, including currencies, stocks, cryptocurrencies*, ETFs, and indices.
Bearish Engulfing vs Bullish Engulfing
The bullish engulfing pattern has a counterparty - bearish engulfing. The bearish engulfing pattern occurs during an uptrend, indicating a change in market sentiment and potential price reversal to the downside. It consists of two candles, where the second is larger and bearish and completely engulfs the body of the preceding candlestick.
How Can You Trade the Bullish Engulfing Pattern?
Here are some steps traders consider when trading with the bullish engulfing:
- Identification: Look for a clear bullish engulfing setup on a price chart at the end of a downtrend.
- Entry Point: Although candlestick patterns don't provide precise entry and exit points as chart patterns do, there are general rules you could use.
The entry point could be set slightly above the high of the bullish engulfing formation. In the conservative approach, traders enter the market after several candles close higher. In a risky approach, traders open a buy position after the pattern is formed.
- Exit Point: A stop-loss level could be below the low of the engulfing candle or below a nearby support level. A take-profit level could be based on a trader’s risk/reward ratio or key resistance levels.
- Risk Management: You can consider a risk management strategy to potentially limit losses. Traders focus on appropriate position sizing and risk-to-reward ratios to maintain a balanced approach to trading.
- Trade Monitoring: Once you have entered the trade, monitor price action and market conditions. Pay attention to any sign of reversal confirmation or potential obstacles that may invalidate the signal.
- Stop-Loss and Take-Profit Adjustment: As the trade progresses, you may consider adjusting your stop-loss level to protect potential returns. Similarly, you may consider adjusting your take-profit level if the price signals a strong uptrend.
Live Market Example
Let's consider an example of a bullish engulfing on the forex chart. The bullish engulfing candle in the example below is marked with 1 and 2. The trader sets the entry point above the green candle and a stop-loss level below it. The take profit is at the closest resistance level.
How Do Traders Confirm a Bullish Engulfing Candlestick Pattern?
Confirming this pattern enhances the reliability of its signals and helps traders make informed decisions. Here are key steps to confirm it:
- Volume Analysis: Traders typically look for increased buying trading volume accompanying the candle. Higher volume suggests stronger buyers’ interest and validates the reversal signal.
- Follow-Up Candlesticks: Waiting for subsequent closes can confirm the upward momentum. A series of higher closes strengthens its credibility.
- Support Levels: If it forms near a significant support level, this adds context to the reversal, as buyers are stepping in at a critical price point.
- Technical Indicators: Complementary indicators like the Relative Strength Index (RSI), Stochastic Oscillator, or a pair of moving averages can confirm the shift in sentiment.
- Market Context: Traders assess the overall market trend and news to ensure the formation aligns with broader market conditions.
Bullish Engulfing and Other Patterns
Let’s take a closer look at how this pattern compares to other chart formations, like the piercing and harami.
What Is the Difference Between a Bullish Engulfing and a Piercing Pattern?
A bullish engulfing pattern occurs when a large bearish bar is followed by a larger candlestick that completely overtakes the former's body. This indicates a strong potential reversal from a downtrend to an uptrend.
In contrast, a piercing formation also signals a potential reversal but is slightly weaker. It forms when a bearish candle is followed by a bullish candle that closes above its midpoint but doesn’t envelop it entirely.
What Is the Difference Between a Bullish Engulfing Pattern and a Bullish Harami Pattern?
The bullish harami pattern consists of a large red candle followed by a smaller green candle that is completely contained within the body of the red candle. This formation suggests a potential reversal but is generally considered less strong than the bullish engulfing candle pattern, as the latter completely envelops the previous bearish bar, showing more decisive buying pressure.
Final Thoughts
While this pattern offers valuable insights into potential trend reversals, it's essential to complement it with technical indicators and robust risk management for effective use. Also, be sure to explore other patterns as they may look very similar but provide different signals.
FAQ
What Is a Bullish Engulfing Pattern?
A bullish engulfing pattern is a two-candlestick formation in technical analysis that suggests a potential reversal from a downtrend to an uptrend. It occurs when a large bearish candlestick is followed by a larger bullish candlestick that completely engulfs the body of the preceding bearish candle.
How Reliable Is the Bullish Engulfing Pattern?
The reliability of the bullish engulfing pattern as a reversal signal depends on various factors, including the overall market context, confirmation from other technical indicators, and the timeframe being analysed. While it can be a strong indication of a potential trend reversal, it is not foolproof and should be used in conjunction with other tools and fundamental analysis.
What Is a Bullish Engulfing Candle Trading Strategy?
The bullish engulfing candle strategy involves identifying this pattern at the end of a downtrend as a signal for a potential sentiment shift. Traders typically enter a buy position slightly above the high of the closing bar, with stop-loss levels set below the low or beneath nearby support levels. Take-profit levels are determined based on risk/reward ratios or key resistance levels.
Do Wicks Matter in Engulfing Candlesticks?
Yes, wicks matter in the formation. The wicks provide insights into price rejection and volatility. For a strong confirmation, the absence of long upper wicks suggests sustained buying pressure, reinforcing its validity as a reversal signal.
*Important: At FXOpen UK, Cryptocurrency trading via CFDs is only available to our Professional clients. They are not available for trading by Retail clients. To find out more information about how this may affect you, please get in touch with our team.
This article represents the opinion of the Companies operating under the FXOpen brand only. It is not to be construed as an offer, solicitation, or recommendation with respect to products and services provided by the Companies operating under the FXOpen brand, nor is it to be considered financial advice.

AUDCAD - SNIPER PRECEISE SHOT SELLING ENTRY - FIB GOLDEN LEVELHI Guyz, Based on sentiments of traders across the globe , 93 % of the traders are currently looking at selling the AUDCAD. I anticipate this would retrace to the 0.382 Level of FIB and take this opportunity to short sell.
Formation of Shooting Star candle stick pattern further confirms the possibility that HH is formed and now it will take corrective move.
STOP LOSS and TP1, TP2 and TP3 are defined with R:R of 1:1, 1:2 and 1:3 respectively.
Happy Trading and Thanks Me later !
Regards,
ProTradeProfessor!

Hammer Candlestick: Meaning and SignalsHammer Candlestick: Meaning and Signals
Technical analysis is a commonly used approach in the financial markets. It involves studying historical price data to make informed trading decisions. Among the various tools and formations employed in technical analysis, the hammer candlestick pattern stands out as a powerful tool. This article will delve into the meaning of the hammer candlestick pattern and explain how traders can interpret it on a forex, stock, and crypto* price chart.
What Is a Hammer Candle?
A hammer is a candlestick that is found on trading charts. It occurs at the end of a downtrend and acts as a bullish reversal signal.
To identify a bullish hammer candle on a price chart, traders do the following:
- Look for a significant downward movement: They begin by searching for a notable decline in an asset’s price.
- Observe the candle shape: The setup is characterised by a small body near the top of the candle and a long lower shadow. The lower shadow must be at least two times the length of the body. The colour of the candle doesn’t matter, but if it’s a green hammer candlestick, meaning it closed higher than it opened, the signal may be stronger.
- Analyse the context: Traders usually look for areas of support nearby as they may increase the setup's reliability.
Bullish Hammer Pattern: Trading Rules
Here are the common steps traders take when trading with a hammer:
- Confirm validity: Traders ensure that the hammer meets the criteria discussed earlier, such as a significant market decline followed by a candle with a small real body near the top and a large lower wick.
- Determine the entry point: Once the bullish hammer candlestick is confirmed, traders identify an appropriate entry point. Candlesticks don’t provide specific entry points. However, traders usually wait for the subsequent bar to close above and enter the trade if the market moves higher.
- Set stop-loss and take-profit levels: Traders place a stop-loss order below the low of the hammer to potentially limit risks. Traders determine a suitable take-profit level based on their trading approach, such as at the nearest resistance level or in accordance with the risk/reward ratio.
Trading Example
A trader spots a hammer on the hourly chart of the EURUSD pair. They wait for the candle to close above the hammer to enter the market. Their stop loss is below the hammer’s lower shadow, with the take profit calculated in accordance with the 1:2 risk/reward ratio.
How Can You Confirm the Hammer Candlestick?
Confirming the hammer candlestick pattern enhances the reliability of trading decisions. Beyond its basic identification, several techniques and indicators help validate its potential bullish reversal signal.
- Volume Analysis: A significant increase in trading volume during the formation of the hammer candlestick suggests stronger confirmation. Higher buying volume indicates heightened interest and participation, reinforcing the potential reversal.
- Support Levels: The presence of a strong support level near the hammer adds credibility to the pattern. Support levels act as psychological barriers where buying interest may increase, boosting the likelihood of a reversal.
- Subsequent Candlesticks: Observing the price action of the next few candlesticks after the hammer can provide further confirmation. A bullish candle closing above the high of the hammer enhances its validity.
-Double Hammer Pattern: While rare, a double hammer candlestick pattern where two candles appear consecutively can offer strong confirmation of a bullish movement.
- Trend Indicators: Utilising trend indicators like moving averages can help confirm the hammer. A rising moving average confirming the upward trend or a hammer forming in line with a broader trend adds weight to the potential reversal.
- Divergence: Identifying divergence between the price and momentum indicators, such as the Relative Strength Index (RSI) or Moving Average Convergence Divergence (MACD), can strengthen the pattern's reliability.
Hammer and Other Candlestick Patterns
Let’s compare the hammer to other candle formations you can spot on price charts.
Inverted Hammer
The inverted hammer is similar to the hammer but has a different appearance. It is characterised by a small body near the bottom of the candle and a long upper wick. The inverted hammer signals a potential bullish reversal as buyers start to gain strength and push the market up. The small body and small lower shadow reflect the rejection of lower prices, suggesting a shift in market sentiment from bearish to bullish.
Doji
In contrast to the red or green hammer candlestick pattern, the doji features a small real body with equal or close opening and closing prices and long upper and lower wicks. It represents market indecision, where neither buyers nor sellers have gained a clear advantage. While the hammer is potent during the downtrend, the doji can occur after both uptrends and downtrends, and it signals market consolidation or a potential trend reversal.
Shooting Star
The shooting star formation emerges at the top of an uptrend and suggests a potential bearish reversal. It is identified by a small real body near the bottom of the candle and a long upper wick, implying a rejection of higher prices and potential exhaustion of buying pressure.
Hanging Man
The hanging man emerges after an uptrend and suggests a potential bearish reversal. It resembles the hammer with a small real body near the top and a long lower wick, but the crucial difference is that it occurs in an uptrend. The hanging man implies that sellers are starting to exert influence, potentially leading to a reversal in the market.
Limitations of the Hammer Pattern
While the hammer is a valuable tool in technical analysis, it is not without its limitations.
- False Signals: It can sometimes produce false signals, leading to premature or incorrect trade entries. In certain market conditions, such as strong downtrends or highly volatile environments, the hammer may be less effective. Its success rate can vary across different assets and market scenarios.
- Dependence on Confirmation: The reliability of the hammer significantly depends on additional confirmation tools and indicators. Without these, alone it might not provide sufficient confidence for trading decisions.
- Short-Term Nature: The hammer primarily signals short-term price movements and typically can’t be used to anticipate medium or long-term price trends.
The Bottom Line
Successful implementation of the hammer formation requires experience, practice, and the use of additional technical analysis tools and indicators. Traders never rely solely on the hammer’s signals but integrate it into a comprehensive trading strategy.
FAQ
What Is a Hammer Candlestick?
A hammer is a specific setup found in charts that indicates a potential reversal to an uptrend. It is formed when a financial instrument opens at a certain price and experiences a significant decline during the trading period but eventually rallies back and closes near its opening price.
Is a Hammer Candlestick Pattern Bullish?
Yes, the hammer candlestick pattern is generally considered bullish. It signifies a potential trend reversal after a downtrend, as buyers enter the market and drive the price higher from its lows. The long lower shadow indicates that the buying pressure is strong and can potentially lead to further upward movement in the market.
Can a Hammer Candle Be Bearish?
A hammer candle is generally considered a bullish reversal signal, signalling a potential upward price movement after a downtrend. There is no bearish hammer. If the market continues to move lower after it forms, it just means that bearish market conditions were stronger and didn’t allow buyers to change market sentiment.
What Is the Hammer Candle Rule?
The hammer candle rule states that it must occur after a significant downtrend, have a small real body near the top of the candle, and feature a long lower shadow at least twice the length of the body. This pattern indicates a potential bullish reversal if confirmed by subsequent price action.
What Is the Hammer Strategy?
The hammer trading strategy involves identifying a candlestick at the end of a downtrend, confirming its validity with additional indicators or signals, and then entering a long position. Traders typically set stop-loss orders below the hammer's low and determine take-profit levels based on risk/reward ratios or nearby resistance levels.
*Important: At FXOpen UK, Cryptocurrency trading via CFDs is only available to our Professional clients. They are not available for trading by Retail clients. To find out more information about how this may affect you, please get in touch with our team.
This article represents the opinion of the Companies operating under the FXOpen brand only. It is not to be construed as an offer, solicitation, or recommendation with respect to products and services provided by the Companies operating under the FXOpen brand, nor is it to be considered financial advice.

$BNB Surprised $678 Price Mega Big pumping & Touch to $700+ ✨ CRYPTOCAP:BNB Surprised $678 Price Mega Big pumping & Trying to $700+ Milestone again.
💫 From Breaking News:
• BNB Eyes $700 as CZ Pushes 90% Binance Chain Fee Cut
•Bhutan Partners with Binance Pay and DK Bank to Launch the World’s First National Crypto-Based Tourism Payment System
BNB price surged over 10%, hitting $642.92 after CZ’s 90% BSC gas fee cut proposal.
RSI reached 78.42, confirming strong bullish momentum and overbought conditions.
BNB may test $700 if Binance validators approve the proposed BEP-336 transaction model.
On May 9, Binance Coin (BNB) climbed to $642.92, rising over 10% in 24 hours. The price rally followed a proposal from Binance founder Changpeng Zhao (CZ) to cut gas fees on Binance Smart Chain (BSC) by 90%.
#Write2Earn #bnb #BinanceSquareFamily #MarketRebound #SUBROOFFICIAL
Disclaimer: This article is for informational purposes only and does not constitute financial advice. Always conduct your own research before making any investment decisions. Digital asset prices are subject to high market risk and price volatility. The value of your investment may go down or up, and you may not get back the amount invested.

Morning Star formationMorning Star formation
Weekly Closing above 125 would be positive.
However, 143 - 144 is the resistance zone.
Crossing it with Good Volumes will move the
price towards 155 - 160.

$MSTR regretting the missed shortJust steadily up the last month. Reversal candles coming in. Wish I had puts. I’m an idiot. Retrace to $350-$360.

NZDCAD 1 Hour Looking for CandleStick Patterns Three Black CrowsNZDCAD 1 Hour Looking for CandleStick Patterns Three Black Crows
For better entry at Lower High levels

Candlestick Patterns + Trend and Momentum: A Perfect CombinationCandlestick patterns provide valuable insights into price action, showing potential reversals, continuations, or market indecision. However, to significantly improve their effectiveness, combining candlestick analysis with trend and momentum indicators is essential. Here’s how you can use these combinations to trade with more confidence and accuracy.
1. Why Candlestick Patterns Matter
Candlestick patterns visually represent traders’ psychology through price movements, including four key prices: Open, Close, High, and Low. Some of the most common and useful patterns include:
Doji: Indicates market indecision and potential reversals.
Hammer & Hanging Man: Signals possible trend reversals at support or resistance.
Engulfing Pattern: Often marks the beginning of a significant reversal.
Morning/Evening Star: Combination patterns that strongly suggest a trend reversal.
2. Adding Trend and Momentum Indicators
Candlestick patterns alone might lead to false signals or confusion. By pairing them with other technical tools, such as moving averages, RSI (Relative Strength Index), or MACD (Moving Average Convergence Divergence), you gain crucial context to confirm the reliability of the patterns.
Here’s how:
Trend Alignment:
Using moving averages, such as the 20 or 50-period EMA, helps confirm whether a bullish candlestick pattern appears in an uptrend (strengthening the signal) or countertrend (potentially weaker signal).
Momentum Confirmation:
Oscillators like the RSI or MACD can confirm the underlying momentum behind a candlestick pattern. For instance, a bullish engulfing pattern becomes more reliable if it coincides with RSI moving upward from oversold territory or MACD showing a bullish crossover.
Volume Analysis:
Higher volume on the candle that forms the pattern typically confirms increased market interest and strengthens the validity of the signal.
3. Practical Example: Bullish Engulfing + RSI
Imagine you spot a bullish engulfing pattern forming at a clear support level after a downtrend:
Step 1: Identify the Pattern: Confirm the bullish engulfing visually.
Step 2: Check RSI: Ensure RSI is below 30 or rising, signaling oversold conditions and potential bullish momentum.
4. Why This Approach Works
Enhanced Accuracy: Combining candlestick signals with trend and momentum indicators increases signal reliability.
Improved Risk Management: Clearer signals mean more confident entries and better-defined stop-loss levels.
Reduces False Signals: Multiple confirmations reduce the risk of false breakouts or reversals.
5. Final Tips
Always look for multiple confirmations (trend, momentum, volume) before making trade decisions based solely on candlestick patterns.
Be patient—waiting for full confirmation can help avoid premature trades.
Regularly backtest and practice recognizing these combined signals to strengthen your trading strategy.

Morning Star Formation on Bigger Tf.Morning Star Formation on Bigger Tf.
14.35 - 14.75 is a Very Important Support level.
However, 15.80 - 15.90 is a Very Strong Resistance
as of now.
If this level is Crossed & Sustained with Good Volumes,
we may witness 17.50 - 18 & then around 19.

Wait for a Proper Support!Wait for some Bullish Candles to appear at Support level with Good Volumes.

Wait for a Bullish Sign!Important Support Zone
166 - 184
Somewhat Bullish on Monthly TF,
But if 180 breaks,we may witness
further selling pressure.

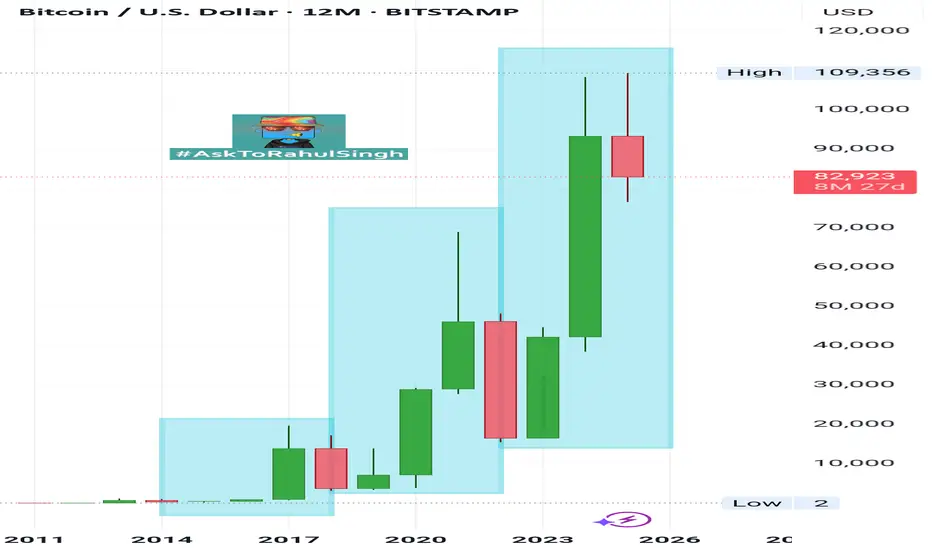
#Bitcoin Yearly Analysis #Bitcoin Trading around $83.6k
Now, As per Weekly Chart Analysis-
If you go for Bitcoin 4 years of Cycle of #Halving to #Halving, it includes always #Bullish #Bearish & Stable Zones of Bitcoin & #Altcoins tradings..
Now, as per yearly cycle..
Bitcoin moved always as per 3 Green & 1 Red Cycle, as per that scenario 2023, 2024 & 2025 is Green Candles year & 2026 will be Red Candle year of #BearishZone.
So, this seasons #BullRun last phase will be starts around August onwards to Dec-Jan. 2026 and after that market will be go under deep #BearishZone.
So, don't be panic at hard, that's the last opportunity time frame of 120/150 days, in which you will be make your again entry points on hard max. time around june-July 2025 at last for #Bitcoin Last time Lower-Low of approx. FWB:65K -67k.
Anyways,
Always #DYOR and Trade Wisely by using of #StopLoss strategy... 🙏
Morning StarBeautiful Morning Star formation on Weekly basis.
Immediate Resistance is around 33 & then 36.
It should not Break 26.50 now otherwise, we may
witness More Selling Pressure.

Silver (XAG/USD) – Rising Wedge Breakdown & Retest📌 Overview of the Chart
The chart illustrates a classic Rising Wedge pattern that has broken down, signaling a potential bearish continuation. The price action respected technical structures, including support and resistance levels, trendlines, and key psychological zones.
The breakdown of the rising wedge led to a sharp decline, followed by a retest of the previous support as resistance, confirming further downside momentum. Traders analyzing this setup can identify clear entry points, stop-loss placements, and target objectives based on price action behavior.
🔹 1️⃣ Understanding the Rising Wedge Pattern
A Rising Wedge is a bearish pattern that forms when price moves upward within converging trendlines. It indicates that buying momentum is slowing, and a potential reversal or breakdown is imminent.
✔ Characteristics of the Rising Wedge on This Chart:
📈 Higher Highs and Higher Lows: The price was trending upwards, but the narrowing structure indicated exhaustion.
📊 Decreasing Momentum: Volume likely started declining as the price approached resistance.
📉 Bearish Breakdown: Price broke below the lower trendline, confirming the pattern’s bearish nature.
🔻 What Happened Next?
The price dropped sharply after the wedge breakdown.
A retest of the broken trendline acted as a confirmation of resistance.
The downtrend continued, targeting a lower support level.
🔹 2️⃣ Key Support & Resistance Levels
🔵 Major Resistance – 34.27 USD (All-Time High & Supply Zone)
This level served as a strong supply zone, rejecting multiple bullish attempts.
Price struggled to break this level, leading to a sell-off.
The stop-loss for short trades is placed above this zone to minimize risk.
🟠 Support Level – 32.80 USD (Previous Support Turned Resistance)
This was a key support zone before the wedge breakdown.
Once broken, price retested this level and faced rejection, confirming a trend shift.
⚫ Trendline Support (Now Broken)
The lower support trendline was a crucial guide for bulls.
Once price broke below, it signaled strong bearish control.
A retest of the trendline was unsuccessful, confirming a bearish continuation.
🟢 Target Zone – 31.93 USD (Projected Breakdown Target)
The measured move target of the rising wedge aligns around 31.93 USD.
If selling pressure continues, price may reach this level.
🔹 3️⃣ Trading Strategy – Short Setup & Execution
This setup provides a high-probability short trade based on the pattern breakdown.
📉 Short (Sell) Entry Criteria:
✅ Entry Zone: After the price broke below the wedge and retested the trendline (~33.80 USD).
✅ Confirmation:
Bearish candlestick formations (Doji, Engulfing, or Pin Bars).
Increased volume on bearish moves.
🚫 Stop-Loss Placement:
🔹 Above the resistance level (34.27 USD) – If price breaks above this, the setup is invalid.
🔹 Reasoning: Protects against unexpected bullish reversals.
🎯 Take-Profit Target:
🔻 Target Price: 31.93 USD (based on measured move projection).
🔻 Risk-Reward Ratio: At least 2:1 (adjusted based on volatility).
🔹 4️⃣ Market Psychology & Price Action Analysis
Understanding trader sentiment is crucial:
📌 Before the Breakdown:
Bulls were in control, pushing price higher.
However, momentum slowed down, forming the rising wedge.
Traders who identified this pattern anticipated a potential trend reversal.
📌 After the Breakdown:
Sellers overpowered buyers, causing a rapid break of structure.
The price retested the previous support as resistance, confirming further downside.
The market sentiment shifted to bearish, aligning with technical confirmations.
🔹 5️⃣ Alternative Scenarios & Risk Factors
🔄 Bullish Reversal (Invalidation of Bearish Bias)
🚨 If price reclaims 34.00-34.27 USD, it invalidates the bearish setup.
📌 A break above this level could trigger a new bullish wave, targeting higher highs.
⚠️ Key Risk Factors:
Unexpected macroeconomic events (e.g., Fed policy, inflation data, geopolitical tensions).
Strong bullish rejection at lower support zones (~32.00 USD).
Volume divergence (if selling volume dries up, bears may lose control).
📢 Conclusion: High-Probability Bearish Trade with Clear Risk Management
This rising wedge breakdown provides a strong short setup, with technical confirmations and price structure supporting further downside movement.
📉 Bearish Bias Until 31.93 USD
A breakdown retest suggests sellers remain in control.
Price is expected to continue lower unless bulls regain 34.00+ levels.
🔍 Key Trading Question:
Will Silver (XAG/USD) continue to its measured target of 31.93 USD, or will bulls defend key support and push prices higher?
Let’s discuss! 🚀👇

EUR/GBP (1H) Symmetrical Triangle Breakdown – Trade SetupThe EUR/GBP 1-hour chart presents a symmetrical triangle formation that has now broken to the downside, signaling a bearish continuation. This pattern is widely recognized in technical analysis and often acts as a continuation or reversal pattern, depending on the breakout direction. In this case, the price has breached the lower support boundary, indicating that sellers have taken control of the market.
In this detailed analysis, we will explore the chart structure, key technical levels, potential trade setups, and risk management strategies to navigate this move efficiently.
1️⃣ Understanding the Symmetrical Triangle Formation
A symmetrical triangle occurs when price action creates lower highs and higher lows, forming two converging trendlines. This reflects a period of market indecision, where buyers and sellers are evenly matched until a breakout occurs.
📌 Key characteristics of this triangle:
✅ Converging Trendlines – Representing lower highs and higher lows, suggesting market compression.
✅ Price Consolidation – The pair traded within this structure, awaiting a catalyst for breakout.
✅ Breakout Direction – A breakdown from the support level confirms a bearish move.
Pattern Psychology:
A symmetrical triangle often precedes a significant price move. Traders and investors monitor the breakout direction to determine the next trend. Here, the breakdown below the lower boundary signals a continuation of the prevailing bearish trend.
2️⃣ Key Levels & Chart Structure
🔹 Resistance Zone (Upper Boundary) – 0.84227
The upper trendline acted as a strong resistance level, preventing price from breaking higher multiple times.
The yellow-highlighted area represents a supply zone, where selling pressure was dominant.
Price attempted to break above this region but failed, confirming bearish dominance.
🔹 Support Level (Lower Boundary) – 0.83500
The lower boundary of the triangle previously held as support, where buyers attempted to push the price higher.
However, once price broke below this support, it confirmed a bearish trend continuation.
The blue horizontal support line represents a potential retest area, where sellers may step in again.
🔹 Breakout Confirmation & Price Action
The chart clearly shows a bearish breakout, as price broke through the lower trendline.
Retest Probability: Many breakouts experience a pullback to the broken support (now resistance) before resuming the downtrend.
The dashed black lines illustrate the expected bearish move, with a potential decline towards 0.82815.
3️⃣ Trading Plan & Entry Strategy
Based on this setup, traders can capitalize on the bearish move using a structured trading plan:
📌 Bearish Trading Setup (Short Position)
✔ Entry Strategy:
Traders can enter a short position either immediately after the breakout or after a retest of the broken support at 0.83500 - 0.83700.
The ideal confirmation would be bearish candlestick patterns, such as an engulfing candle or pin bar rejection on the retest.
✔ Stop-Loss Placement:
To mitigate risk, a stop-loss should be placed above the previous resistance level (0.84227).
This ensures protection against fake breakouts or sudden reversals.
✔ Target Price (Take Profit Level):
The measured move of a symmetrical triangle breakout is typically equal to the height of the triangle.
Based on this projection, the expected target is around 0.82815, a significant support level.
Traders may also scale out at intermediate levels (0.83000) to lock in profits.
✔ Risk-Reward Ratio (RRR):
A well-structured trade here presents an attractive RRR of approximately 1:3, meaning the potential reward is three times the risk.
A higher RRR enhances the probability of profitability over multiple trades.
4️⃣ Market Context & Fundamental Analysis
🔍 Why Is EUR/GBP Dropping?
While technical patterns are valuable, traders must also consider fundamental factors that drive currency pairs.
🟢 Possible Bearish Catalysts for EUR/GBP:
GBP Strength: If the British Pound (GBP) strengthens due to strong economic data or hawkish Bank of England (BoE) policy, EUR/GBP may continue declining.
EUR Weakness: The Euro (EUR) may be under pressure due to weak GDP growth, higher inflation, or dovish European Central Bank (ECB) statements.
Geopolitical Events: Any negative news impacting the Eurozone (e.g., political instability) could trigger further selling pressure on EUR/GBP.
5️⃣ Risk Management & Alternative Scenarios
While the current outlook favors a bearish move, traders must remain prepared for alternative scenarios.
⚠ Alternative Scenarios: 📌 False Breakdown:
If price closes back above the support level (0.83500 - 0.83700), it could indicate a failed breakout, potentially leading to a bullish reversal.
In this case, a breakout above 0.84227 would invalidate the bearish setup.
📌 Sideways Consolidation:
If the price stalls around 0.83300 - 0.83500, the market may range before the next move.
Traders should wait for clear confirmation before entering new trades.
6️⃣ Summary & Key Takeaways
✅ Pattern Identified: Symmetrical Triangle Breakout (Bearish).
✅ Breakout Direction: Price has broken below support, confirming a downtrend.
✅ Trade Setup:
Sell below 0.83500 (or on retest at 0.83700).
Stop Loss: Above 0.84227 (previous resistance).
Take Profit: Targeting 0.82815 based on the pattern’s measured move.
✅ Risk-Reward: Favorable, offering 1:3 or higher RRR.
✅ Fundamental Drivers: GBP strength or EUR weakness could accelerate the downtrend.
📢 Final Thoughts
This symmetrical triangle breakdown offers a high-probability trading opportunity for short sellers, with a clear technical structure supporting the bearish move. However, traders should remain cautious of false breakouts and adjust stop-loss levels accordingly.
For best results:
✔ Wait for price action confirmation (retest rejection or bearish candle formations).
✔ Follow proper risk management (stop-loss placement and profit-taking levels).
✔ Monitor key economic events impacting EUR and GBP movements.
By combining technical analysis, fundamental insights, and sound risk management, traders can enhance their profitability and navigate the markets with confidence. 🚀📉

CHF/USD Trading Setup – Triple Bottom Reversal & Breakout Setup🔍 Overview of the Chart Setup
The CHF/USD (Swiss Franc vs. U.S. Dollar) 1-hour timeframe chart reveals a classic Triple Bottom pattern, which is a well-known bullish reversal signal. This pattern indicates that sellers have attempted to break the support level three times but failed, suggesting a potential shift in momentum from bearish to bullish.
Traders closely watch this structure as it often leads to a strong upward breakout once key resistance levels are breached. The current setup provides an excellent risk-to-reward trading opportunity, especially for those looking to capitalize on the breakout.
📊 Key Levels in the CHF/USD Chart
1️⃣ Support and Resistance Zones
🟢 Support Level (~1.1300 - 1.1280 Zone)
This zone has been tested three times, confirming strong buying interest at this price level.
The formation of long wicks on candlesticks signals strong demand and buyer dominance.
A breakdown below this level would invalidate the bullish setup and may indicate a continuation of the bearish trend.
🔴 Resistance Level (~1.1415 - 1.1430 Zone)
This level acts as a price ceiling, where previous bullish attempts were rejected.
A break and retest above this zone would confirm the Triple Bottom breakout.
🎯 Target Level (~1.1457 Zone)
The projected target is based on the height of the pattern, which is measured and added to the breakout point.
This level aligns with previous price action zones and acts as a natural take-profit area for traders.
🚨 Stop-Loss Level (~1.1243 Zone)
A stop-loss is placed below the support zone to protect against false breakouts or an invalidation of the pattern.
📉 Understanding the Triple Bottom Pattern
The Triple Bottom is a strong bullish reversal formation that occurs at the end of a downtrend. It signals that sellers are exhausted, and buyers are gradually taking control.
🔹 Breakdown of the Triple Bottom Formation
✅ Bottom 1 (First Low)
The first bottom forms when the price hits the support level and bounces back.
Sellers are still active, so price declines again to test the same support zone.
✅ Bottom 2 (Second Low - Confirmation of Support)
The second test of the support zone validates the demand area.
Buyers step in again, pushing the price upward.
The market still lacks enough momentum for a breakout, leading to a third retest.
✅ Bottom 3 (Final Low and Strong Rejection)
The third bottom is crucial because it signals the last test of support before a breakout.
The failure to break lower creates a higher probability of an upside move.
📌 Breakout Confirmation & Price Action Signals
🔵 The breakout is confirmed when:
The price closes above the resistance zone (1.1415 - 1.1430) with strong momentum.
Volume spikes during the breakout, indicating institutional buying interest.
A successful retest of the resistance zone as new support further validates the trend reversal.
If the breakout lacks volume or gets rejected, traders should be cautious of a fakeout or potential retracement.
📈 Trading Strategy & Execution Plan
🔹 Conservative Entry (Safe Approach)
Enter after a confirmed breakout above 1.1415, ensuring a strong candle close above resistance.
Look for a retest of the breakout level before entering the trade.
🔹 Aggressive Entry (Early Positioning)
Enter near the third bottom (~1.1300 - 1.1320) with a tight stop-loss.
Higher risk but better reward if the price moves upward without retesting.
🔹 Stop-Loss Placement
Conservative traders: Place the stop-loss below the support zone (~1.1243).
Aggressive traders: Place a tight stop below the recent swing low for better risk management.
📌 Profit Target Projection
Take Profit Target: 1.1457, based on the height of the pattern.
📌 Risk-to-Reward Ratio
Risk: ~60 pips (from entry to stop-loss).
Reward: ~150 pips (from entry to target).
Risk-to-Reward Ratio: 1:3, making it a high-probability trade.
📡 Additional Confirmation Indicators for Stronger Trade Setup
📊 1. Volume Analysis
A spike in volume at the breakout level suggests strong buyer interest.
Low volume on the breakout may indicate a potential fakeout.
📈 2. RSI (Relative Strength Index) Confirmation
RSI should be above 50 and trending upward to confirm bullish momentum.
If RSI is overbought (>70), watch for a pullback before entering the trade.
📉 3. Moving Averages Support
If the 50-period or 200-period moving average supports the breakout level, it adds extra confirmation.
A moving average crossover may further validate the trend reversal.
🔍 4. Beware of Fake Breakouts
If the price briefly moves above resistance but fails to hold, it may be a bull trap.
Always wait for a candle close above resistance and a potential retest before confirming the entry.
🛠️ Alternative Scenarios & Market Risks
🔺 Bullish Scenario (Breakout & Rally to Target)
Price breaks above 1.1415, confirming a trend reversal.
A retest of resistance as support gives additional buying confidence.
Price reaches 1.1457 target before facing new resistance.
🔻 Bearish Scenario (Fakeout & Breakdown Below Support)
Price fails to hold above resistance and falls back below support.
A breakdown below 1.1243 invalidates the pattern, triggering a bearish continuation.
Traders should cut losses quickly if the setup is invalidated.
⚠️ Fundamental Risks to Watch
U.S. Dollar news events (FOMC, NFP, CPI reports) can increase volatility.
Swiss economic data may impact CHF strength.
Unexpected geopolitical events can influence currency movements.
🔎 Summary of the Trading Plan
📌 Trading Strategy Checklist
✅ Pattern: Triple Bottom (Bullish Reversal).
✅ Entry Strategy: Buy after breakout confirmation above 1.1415.
✅ Take Profit Target: 1.1457.
✅ Stop-Loss Level: Below 1.1243.
✅ Risk-to-Reward Ratio: 1:3 (High-Profit Potential with Proper Risk Management).
💡 Final Thought:
This setup provides a high-probability bullish trade with strong technical confluence. However, always remain cautious of market news, economic reports, and sudden volatility that could influence price action.
🚀 Patience & discipline are key—wait for confirmation before entering! 📊
