SUSHI USDT BULLISH TREND IN I HR TFBINANCE:SUSHIUSDTPERP Bullish Trend 1 HR TF, wait for break the level.
Candlestickpattern

CAD/jPY Is Bullish trend.OANDA:CADJPY CAD/JPY is This is a bullish trend that will lead to another higher high in the near future. According to Candle stick pattern.

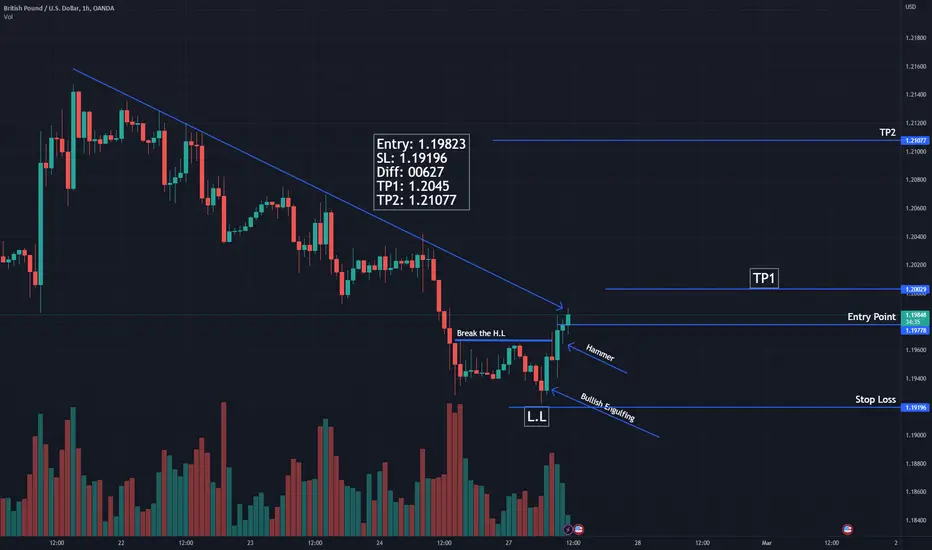
GBPUSD Bullish Trend Start in 1 HR TF.OANDA:GBPUSD On this chart, the first candle is a Bullish Engulfing Candle, and the second candle is a Hammer Candle. Mean buyers dominate the market at this time. GBP IUSD Break of previous Higher Low
The drop on EURUSD continues At the beginning of the week EURUSD heading towards support level at 1,0515.
These are suitable levels for correction before the next decline.
Upon a breakout of this zone the goal will be reaching 1,0440.
Up to these levels we will be looking to exit the sell trades and will be watching if there is a good opportunities for buys.

Perfect Bullish and Bearish EngulfsIt identifies Bull Engulfs and Bear Engulfs With minimal upper or lower wicks. Candles are highlighted yellolw for bear engulf and sky blue for bull engulfs

GBPAUDHi guys!"
GBPAUD has been examined in different dimensions:
1- Strong supply and demand levels that I identify with my own indicator and system.
2- The structure of recently formed waves
3- Current market momentum
4- The structure of classical and price patterns
In this idea, I identified the direction of the market in different ways and in the second step, I analyzed the potential of continuation or reversal. Usually, paying attention to the trend and strength of the trend can greatly increase the accuracy of the analysis.
In general, I tried to describe the continuation of the movement in the simplest possible way in the diagram.
⚠️ Disclaimer:
This is a personal opinion and you are responsible for any trading decisions.

THETAUSDT BULLISH TREND 30 MIN CHARTBINANCE:THETAUSDT The bullish trend continues. A new higher high is expected after I break the previous higher high.

CADCHF high potential to reach lower pricesIf the Canadian banks do not create a big demand, it is very likely that the strength of the Canadian dollar will decrease compared to the franc, and we will see the fall of this chart in the coming hours.
CADCHF has been examined in different dimensions:
1- Strong supply and demand levels that I identify with my own indicator and system.
2- The structure of recently formed waves
3- Current market momentum
4- The structure of classical and price patterns
In this idea, I identified the direction of the market in different ways and in the second step, I analyzed the potential of continuation or reversal. Usually, paying attention to the trend and strength of the trend can greatly increase the accuracy of the analysis.
In general, I tried to describe the continuation of the movement in the simplest possible way in the diagram.
⚠️ Disclaimer:
This is a personal opinion and you are responsible for any trading decisions.

Take Profits on EURUSDYesterday EURUSD reached its first target at 1,0585.
It's a good time for getting part or the whole profit.
We're now looking for a correction and confirmation of the new sell trade aiming 1,0515.
As long as the movement remains bearish these will be the only trades we will look at.
By partially closing and re-entering after a correction, the aim is to lower risk and maximize profit from the move.

4 HR ANALYSIS - Will GBPJPY FINALLY break out of this Flag?Hey guys,
So, on my last post I said I wanted to see price come up to 163.500 to fill that imbalance on the left and also retrace deeper into the higher time frame bearish fib (it was already hit but I wasn't convinced that that was enough I needed it to at least pull up to the .618 level.
So now that price has given us that, we just need to plan accordingly and see what price wants to do from here onwards. :)
As always - I have more than 1 option just in case, but I would like to see GJ pull back before trending higher even if its temporarily.
Option 1: Bullish
Price may come down to either 159.500 or 160.500 to remove liquidity and accumulate sellers before it reverses and takes off bullish. It just looks too good to be true if it only trends bullish from where we are now or if it just reverses and drops straight from there Aswell.
Remember - If it looks too good to be true, it usually is, and we know that the markets don't work like that obviously. Also, the overall sentiment is bearish for GJ so it makes sense to keep accumulating sellers and luring them in and then reverse from there.
Option 2: Bearish
Price may just want us to think its manipulating us to go bullish and may actually go bearish in the end so we can't completely write this additional perspective off because it is very possible. It may come down to 159.500 or 160.500 and then retrace from there and accumulate buyers only then to drop and continue bearish removing all liquidity from the previous lows over the last few months.

TSLA: Bullish Reaction Inside a Trap Zone.• TSLA broke yesterday’s high, which was a Hammer candlestick pattern, and it is trying to react this morning;
• The stock has been correcting since it hit the $214 area, but it is still above its key support levels;
• TSLA could easily climb to the $214 again, but only a true breakout would make it resume the bullish bias again;
• The area around $180s is a triple support level, made by: 1) 21 ema; 2) $187 (previous bottom, trigger point of a Double Top pattern); and 3) $182.50 (previous resistance/support);
• As long as TSLA remains in the area between the resistance at $214 and the triple support area, nothing meaningful will happen, and probably we'll just see erratic movements. This is why it is called Trap Zone.
Remember to follow me to keep in touch with my daily analyses!

DOJI CANDLE ON THE $AAPL DAILY CHARTYesterday's choppiness & market direction indecision in the tech sector can be summarized by this DOJI candle on the APPLE daily chart formed off the 200 day MA and closed just above the 21 EMA. Possible reversal to retest and break $150: LONG. Level of support of 146.75 area, break below: SHORT

EURUSD drop continues Yesterday we saw another bottom during the news.
Today there is news again. The news is about US quarterly GDP. They will have an impact in case of values other than expected.
Technically, the downside move continues and is heading towards first level at 1,0585.
Upon breakout the target will be 1,0512 , all the while watching for run-out.
All sell trades should now be with reduced risk.


EURNZDEURNZD has been examined in different dimensions:
1- Strong supply and demand levels that I identify with my own indicator and system.
2- The structure of recently formed waves
3- Current market momentum
4- The structure of classical and price patterns
In this idea, I identified the direction of the market in different ways and in the second step, I analyzed the potential of continuation or reversal. Usually, paying attention to the trend and strength of the trend can greatly increase the accuracy of the analysis.
In general, I tried to describe the continuation of the movement in the simplest possible way in the diagram.
⚠️ Disclaimer:
This is a personal opinion and you are responsible for any trading decisions.

Aggressive Shorting Opportunity within the Sell ZoneAn aggressive shorting opportunity present itself within the sell zone.
Shorting is consider trend trading in this trading setup, so why does it consider as aggressive?
That is because the market is now traded on the tip of the box. It presents the Best Profit Factor(Reward:Risk) but in the most risky setup(very close in breaking the Sell Zone).
One can choose to stay out of the trade.

EURUSD heading towards 1,0585Today will be announced FOMC minutes. This news may lead to bigger fluctuations.
Yesterday EURUSD failed to reach the sell zone and pulled back from lower values.
We expect bearish move to continue towards 1,0585, and in case of breakout to reach 1,0515.
Enormous fluctuations are possible during the news , that’s why lower your risk.

METV has fallenFinally, METV has fallen into the buy zone within the Bullish Bat pattern but has invalidated the Bat Pattern setup.
Let see if the level stands within the buy zone.

SPX: Bullish Rejection Structure.• The SPX is doing a bearish reversal structure, as it lost our two main support levels: The 21 ema and the 4,060;
• Last Friday it tried to react, as it did a Dragonfly Doji, just above the 21 ema – However, today’s reaction rejects this bullish attempt completely;
• Now it seems the SPX is seeking the next support, at 4,015;
• Since the index lost the 21 ema, and it did a lower high/low, the mid-term bias is bearish again. Only a very good bullish pattern, followed by a bullish reversal structure would put an end to this bearish sentiment;
• So far, there’s no such sign, but let’s keep our eyes open around the 4,015 area. I’ll keep you updated on this.
Remember to follow me to keep in touch with my daily analyses!

Sell zone at EURUSD No change in expectations since yesterday.
The more likely direction remains to the downside, as we will look for sales on reaching and pushing back from the zone.
There are no grounds for buys next to the zone!
On a rise and pushback, look for a sell entry with a stop above 1.0805.
The goal is to reach and break 1.0620!

Bitcoin price compressionHi Guys.
Im in 1H timeframe and i think BTC price compressed between two line i drawn on my chart.
Also we can see a weak Divergence between RSI and Price action too.
This will lead the price to the lower line and despite there is a strong support line there , in 24000
the price will bouce back and go approch upper line.
So we can take 2 trades here:
1- Now with SL upper than latest minor peak
2- after reaching lower line and the bounce verified.
The price action around 24000 was very strong because you see two long shadowed candle in this area historically.
After this price compression ends , we shuold analysis again to see what will happen.
But in some extent , I think we break this Triangle upward and go toward 26000 target.
Hope you enjoy , thats just my idea NOT a trading Advice.
Trade on your own strategy but take ideas from others.
THANK YOU ALL

New sell zone on EURUSD Last Friday EURUSD reached 1,0611 and pullback from the level.
The rise may continue to 1,0730, where we will be looking for sell opportunities again.
An entry is made only after pullback from the zone.
The target is test and breakout of the last week’s low.
The scenario breaks down on moving above 1,0805.

USDJPY********************MEGAPHONE PATTERN********************
This is a personalized analysis based on trends, strength of drives and potential moves.
