A Triple Top Pattern: Signals and StrategiesA Triple Top Pattern: Signals and Strategies
Traders are always on the lookout for reliable analysis tools that can help them make informed trading decisions. One such tool is the triple top trading pattern. It is a bearish reversal formation that can help traders identify potential trend reversals and take advantage of market opportunities.
In this FXOpen article, we will explore what the triple top pattern is, what it indicates, and how to identify it on price charts. Keep reading to find examples that will help you understand how to use it in a trading strategy.
What Is a Triple Top Pattern?
A triple top is a technical analysis pattern that signals a potential reversal in a trend. Is the triple top bullish or bearish? It’s a bearish formation. The pattern occurs when the price of an asset hits the same resistance level three times, failing to break above it on each occasion. This indicates that buyers are losing strength and sellers are starting to dominate the market. It is often seen after a sustained uptrend.
Identifying a triple top involves spotting three distinct peaks at roughly the same price level, separated by two troughs. The peaks are formed when the price hits resistance but fails to push through, while the troughs occur when the price retraces after each failed attempt.
To confirm a valid triple top, the peaks should be close in height, and the troughs should create a roughly horizontal neckline. The pattern is confirmed when the price breaks below the neckline, signalling that sellers have overtaken buyers.
Triple Top Chart Pattern Trading Strategy
Once traders have identified the triple top formation, they can use various trading strategies to take advantage of it. However, there are common rules that are used as the basis:
- Entry: Traders enter a short position when the price breaks below the neckline, which is the level that connects the two troughs that separate the peaks. This level is a critical support level, and when it is broken, it confirms the triple top candlestick pattern and indicates that the trend is reversing.
- Stop Loss: To manage risk, traders place a stop-loss order above the neckline. If the price starts to rise again, the stop-loss order will limit potential losses. The theory states that traders can place a stop-loss on the neckline. However, the price often retests the support level after a breakout, so the risk of an early exit rises.
- Take Profit: There are several ways of determining a profit target. The most common technique is to measure the distance between the tops and bottoms and subtract it from the triple top breakout point.
Another strategy is to identify the target based on the closest support levels. However, this may limit potential returns if the support is too close to the entry point. Therefore, traders sometimes use trailing stops to lock in potential profits as the price continues to fall.
Trading Example
In the chart above, the price formed the triple top. We could have entered a short position once the price broke below the neckline and closed it either at the point equal to the distance between the peaks and the neckline or at the closest support level, as the levels are almost equal. However, selling volumes were low (1) at the breakout level, so we could have expected an upcoming bullish reversal. Therefore, we wouldn’t have kept the position beyond the initial take-profit target.
How Traders Confirm the Triple Top
To confirm the triple top pattern and ensure its validity, traders use a combination of technical tools and indicators. These help confirm that the trend is indeed reversing and not just experiencing a temporary pullback. Here are the key methods traders use:
- Neckline Break. The most important confirmation comes when the price breaks below the neckline, which is the horizontal level connecting the lows between the peaks. A clean break suggests a stronger reversal.
- Volume Analysis. Volume plays a crucial role in confirming the triple top. Traders look for a surge in selling volume when the price breaks the neckline. If the volume is low during the breakout, the pattern may not be reliable, and a bullish reversal could follow.
- Momentum Indicators. Traders often use momentum indicators like the Stochastic Oscillator or Moving Average Convergence Divergence (MACD). When these indicators show bearish divergence, it signals a potential downward reversal. A negative crossover in the MACD or Stochastic adds further confirmation.
- Retest of Neckline. Sometimes, after breaking the neckline, the price may retrace and retest this level as resistance. A failed retest, where the price does not move back above the neckline, confirms that sellers are in control.
Triple Top vs Triple Bottom
It is important to distinguish between the triple top and the triple bottom chart patterns, as the former is the bearish setup, while the latter is a bullish reversal formation. The triple bottom setup forms when the price hits a particular support level three times and fails to break through it. It suggests that the sellers have lost their strength, and the buyers are starting to take control. The bottoms are separated by two peaks, which occur when the price retraces some of its gains from the support level.
Traders use the same principles to trade the triple bottom as they would the triple top but vice versa. They enter a long position when the price breaks above the neckline and set a stop-loss order below it. The take-profit target might equal the distance between bottoms and peaks or be set at the closest resistance level.
Triple Top Challenges
While the triple top pattern is a valuable tool for spotting reversals, it has its limitations. Traders should be aware of the following challenges:
- False Breakouts. The price may break below the neckline only to quickly reverse back, leading to a false signal. This can cause traders to enter losing positions if they act too quickly without further confirmation.
- Extended Sideways Movement. Sometimes, the price can stay near the neckline after a breakout, leading to indecision and uncertain market behaviour. This sideways movement can make it difficult to determine if the trend has truly reversed.
- Retests Leading to Reversals. After the initial breakout, the price may retest the neckline and move back above it, invalidating the triple top pattern. Traders need to be cautious and set appropriate stop-loss orders to help potentially mitigate risk.
Final Thoughts
The triple top pattern offers traders a powerful tool for identifying potential market reversals. However, it’s crucial to confirm the pattern and integrate it with other forms of analysis to avoid false signals. Ready to put these insights into action? Open an FXOpen account today, and trade with a broker offering tight spreads, low commissions, and advanced trading platforms.
FAQ
What Does a Triple Top Mean in Trading?
The triple top pattern meaning refers to a bearish reversal formation indicating a potential end to an uptrend. It forms when the price reaches the same resistance level three times without breaking through, suggesting weakening buying momentum and increasing selling pressure. This pattern signals that the asset's price may soon decline.
How Do You Confirm the Triple Top Pattern?
To confirm a triple top pattern, traders watch for a decisive break below the neckline, which connects the lows between the peaks. Increased trading volume during the breakout strengthens the confirmation, indicating strong seller interest. Technical indicators like the Stochastic Oscillator showing bearish divergence can provide additional validation.
Is a Triple Top Bullish?
No, a triple top is not bullish; it is a bearish reversal pattern. It signifies that the asset's price has repeatedly failed to surpass a resistance level, indicating diminishing upward momentum. Traders see this as a cue to consider short positions or to exit existing long positions.
Is a Triple Top Stronger Than a Double Top?
A triple top is generally considered stronger than a double top pattern because the price has failed to break resistance three times instead of two. This extra failed attempt reinforces the strength of the resistance level and increases the likelihood of a significant reversal. However, both patterns are important and should be analysed with other market factors.
This article represents the opinion of the Companies operating under the FXOpen brand only. It is not to be construed as an offer, solicitation, or recommendation with respect to products and services provided by the Companies operating under the FXOpen brand, nor is it to be considered financial advice.
Candlestickpattern

BHARTI AIRTEL give Shorting Opportunityif BHARTI AIRTEL create today candle is Hanging Man so we have a create shoring trade. add in your watchlist.

Capturing Market Moves with the Special Candle SetupOverview
The Special Candle Setup Indicator has once again proven its effectiveness in detecting high-probability candlestick formations. In this chart, a bearish pattern was identified at the top, providing an early indication of a potential downside move. This setup allowed traders to position themselves accordingly, capturing the downward trend efficiently.
How It Worked Here
🔹 Precise Bearish Signal – The indicator detected a bearish pattern at a key resistance level, signaling a potential reversal.
🔹 Well-Defined Key Levels – The automatically plotted blue support line and green resistance line provided crucial reference points for trade management.
🔹 Trend Continuation Confirmation – The setup was followed by further bearish price action, validating the accuracy of the signal.
Key Takeaways
✅ Early Signal Accuracy – The indicator highlighted the reversal before the major drop, reinforcing its reliability.
✅ Multi-Market Application – These candlestick formations are not limited to expiry days; they are observed across crypto, forex, stocks, and indices.
✅ Customizable for Different Strategies – Users can enable or disable specific pattern types (bullish/bearish or reversal setups) based on their trading style.
Why This Matters?
Price action remains one of the most powerful trading tools, and this indicator helps traders automate pattern detection while integrating dynamic support and resistance levels for added confluence.

How Can You Use a Spinning Top Candlestick Pattern in Trading?How Can You Use a Spinning Top Candlestick Pattern in Trading?
The spinning top candle is a key tool in technical analysis, highlighting moments of market indecision. This article explores what spinning tops represent, how they differ from similar patterns, and how traders can interpret them to refine their strategies across various market conditions.
What Does a Spinning Top Candlestick Mean?
A spinning top is a candlestick pattern frequently used in technical analysis. It consists of one candle with a small body and long upper and lower shadows of approximately equal length. The candle’s body symbolises the discrepancy between the opening and closing prices during a specified time period, while the shadows indicate that volatility was high and neither bulls nor bears could take control of the market.
This pattern signifies market indecision, where neither buyers nor sellers have gained dominance. It suggests a state of equilibrium between supply and demand, with the price oscillating within a narrow range. The spinning top may indicate continued sideways movement, particularly if it appears within an established range. However, if it forms after a bullish or bearish trend, it could signal a potential price reversal. Traders always look for additional signals from confirming patterns or indicators to determine the possible market direction.
It’s important to note that the spinning top candle is neutral and can be either bullish or bearish depending on its context within the price chart. The colour of the candle is not important.
Spinning Top vs Doji
Doji and spinning top candlesticks can be confused as they have similar characteristics. However, the latter has a small body and upper and lower shadows of approximately equal lengths. It indicates market indecision, suggesting a balance between buyers and sellers without a clear dominant force. Traders interpret it as a potential reversal signal, reflecting a possible change in the prevailing trend.
The doji candlestick, on the other hand, has a small body, where the opening and closing prices are very close or equal, resulting in a cross-like shape. If it’s a long-legged doji, it may also have long upper and lower shadows. A doji candle also represents market indecision but with a focus on the relationship between the opening and closing prices. Doji patterns indicate that buyers and sellers are in equilibrium, and a potential trend reversal or continuation may occur.
How Do Traders Use the Spinning Top Pattern?
Traders often incorporate the spinning top candle pattern into their analysis as a way to interpret moments of market indecision. Whether the pattern appears during a trend or at key turning points, its context plays a significant role in shaping trading decisions.
In the Middle of a Trend
When a spinning top forms in the middle of an ongoing trend, traders often view it as a signal of potential market hesitation. This indecision can indicate a pause in momentum, suggesting either a continuation of the trend or the possibility of a reversal.
Entry
In such cases, traders typically wait for confirmation of the next price move. A break above the high of the spinning top may signal the trend will continue upward, while a break below the low could suggest the trend may move down. Observing how subsequent candles interact with the spinning top can help a trader gauge the market’s intentions.
Take Profit
Profit targets might be aligned with key price levels visible on the chart, such as recent highs or lows. For traders expecting trend continuation, these targets might extend further, while those anticipating a reversal might aim for closer levels.
Stop Loss
Stop-loss orders might be set in accordance with the risk-reward ratio. This placement helps account for the pattern's characteristic volatility while potentially protecting against unexpected movements.
At the Top or Bottom of a Trend
When a spinning top forms at a significant peak or trough, it often draws attention as a potential reversal signal. This appearance may reflect market uncertainty after a prolonged uptrend or downtrend.
Entry
Confirmation from subsequent price action is critical. Traders typically observe if the price breaks above the candle (bullish spinning top) or below the candle (bearish spinning top) to determine the likelihood of a reversal.
Take Profit
Targets could be set at major support or resistance zones. A trader expecting a reversal may look for levels reached during the previous trend.
Stop Loss
Stops could be placed in accordance with the risk-reward ratio, allowing for the volatility often present at trend-turning points while potentially mitigating losses.
Remember, trading decisions should not solely rely on this formation. It's crucial to consider additional technical indicators, market trends, and risk management principles when executing trades.
Live Example
In the EURUSD chart above, the red spinning top candle appears at the bottom of a downtrend. A trader went long on the closing of the bullish candle that followed the spinning top. A take-profit target was placed at the closest resistance level, and a stop-loss was placed below the low of the spinning top candlestick.
There is another bearish spinning top candlestick pattern on the right. It formed in a solid downtrend; therefore, a trader could use it as a signal of a trend continuation and open a sell position after the next candle closed below the lower shadow of the spinning top candle.
A Spinning Top Candle: Benefits and Drawbacks
The spinning top candlestick pattern offers valuable insights into market indecision, but like any tool in technical analysis, it has its strengths and limitations. Understanding these might help traders use it more effectively.
Benefits
- Identifies Market Indecision: Highlights moments where neither buyers nor sellers dominate, providing a clue about potential price reversals or continuations.
- Versatile Across Trends and Markets: Can signal price consolidation, continuation, or reversal depending on its context. It’s also possible to use the spinning top across stocks, currencies, and commodities.
- Quick Visual Insight: The distinctive shape makes it easy to spot on charts without extensive analysis.
Drawbacks
- Requires Confirmation: On its own, the pattern lacks particular signals, needing additional indicators or price action for confirmation.
- Context-Dependent: Its reliability depends heavily on where it forms in the trend, making it less useful in isolation.
- Prone to False Signals: Market noise can produce spinning tops that do not lead to meaningful movements, increasing the risk of misinterpretation.
Takeaway
The spinning top candlestick reflects market indecision and suggests a potential reversal or consolidation. Traders use this pattern as a tool to identify areas of uncertainty in the market. Therefore, it's important to consider the spinning top pattern within the broader context and get confirmation from other analysis tools.
If you want to test your spinning top candlestick trading strategy or apply it to a live chart, open an FXOpen account and start trading with tight spreads from 0.0 pips and low commissions from $1.50. Good luck!
FAQ
What Is a Black Spinning Top?
A black (red) spinning top is a variation of the spinning top candlestick pattern with a small body and equal-length shadows. This is different from the white (green) spinning top, as its body indicates a lower closing price. Traders analyse its context, technical factors, and confirmation from other indicators to interpret its significance.
What Is a Spinning Top Candlestick?
A spinning top candle meaning refers to a pattern characterised by a small body and long upper and lower shadows of roughly equal length. It reflects market indecision, where neither buyers nor sellers hold a clear advantage, and is often used in technical analysis to assess potential trend reversals or consolidations.
Is the Spinning Top Bullish or Bearish?
The spinning top candlestick pattern is neutral by nature. Its significance depends on the context within the price chart. When it appears at the end of an uptrend, it may signal a bearish sentiment, while at the end of a downtrend, it can indicate a potential bullish reversal.
What Does a Spinning Top Candle Indicate?
This pattern indicates a period of indecision and balance between buying and selling pressure. Depending on its position within a trend, it can signal consolidation, continuation, or a reversal in price direction.
What Is the Spinning Top Rule?
There is no fixed "rule" for spinning top trading. Traders typically look for confirmation from subsequent price movements or other technical indicators to decide on a course of action.
Is Spinning Top a Doji?
Although similar, spinning tops and doji candles differ. A spinning top has a small body with visible discrepancies between opening and closing prices, whereas a doji’s body is almost non-existent.
Trade on TradingView with FXOpen. Consider opening an account and access over 700 markets with tight spreads from 0.0 pips and low commissions from $1.50 per lot.
This article represents the opinion of the Companies operating under the FXOpen brand only. It is not to be construed as an offer, solicitation, or recommendation with respect to products and services provided by the Companies operating under the FXOpen brand, nor is it to be considered financial advice.

Mastering Candlestick Patterns for better trades!Candlestick patterns are a powerful tool for identifying market sentiment and potential reversals. Let's break down some key single and double candlestick formations seen in this chart:
🕯️Single Candlestick Patterns:
- Doji – Represents indecision in the market, signaling a potential reversal.
- Inverted Hammer – A bullish reversal pattern after a downtrend, indicating buyers are stepping in.
- Long-Legged Doji – Suggests market uncertainty; watch for confirmation before taking a position.
- Bearish Closing Marubozu – A strong bearish signal showing sellers' dominance, with no upper wick.
- Bullish Opening Marubozu – A strong bullish candle with no lower wick, signaling a potential uptrend.
🕯️Double Candlestick Patterns:
- Bullish Engulfing – A strong bullish reversal pattern where the green candle fully engulfs the previous red candle, signaling buying pressure.
- Bullish Harami – A potential trend reversal where a small green candle is "inside" the previous large red candle, indicating a slowdown in selling.
- Cross Doji – Suggests hesitation between buyers and sellers, often appearing before a reversal.
How to Use Them in Trading?
✔️ Combine candlestick patterns with indicators like RSI, MACD, or Moving Averages for stronger confirmations.
✔️ Look for patterns near key support and resistance levels to increase reliability.
✔️ Always wait for confirmation before entering a trade!

The Three Black Crows Pattern: Trading PrinciplesThe Three Black Crows Pattern: Trading Principles
Various candlestick and chart patterns indicate potential market reversals. One such formation is the three black crows pattern that indicates a potential bearish reversal in the price of an asset. You can find three black crows stock, commodity, and forex patterns. This FXOpen article will help you understand how such a pattern is formed, explaining how it can be used to spot trading opportunities in the market and demonstrating live trading examples.
What Are the Three Black Crows?
The three black crows is a bearish candlestick pattern used in technical analysis to signal a potential reversal of an uptrend. It consists of three consecutive long bearish candlesticks that occur after a strong upward trend. The pattern suggests that the momentum has shifted from buyers to sellers, indicating that a downtrend could be about to begin.
Key Characteristics:
- Three Consecutive Bearish Candles: The pattern is composed of three long bearish candlesticks that open within the body of the previous candle and close near their lows.
- Appears After an Uptrend: The pattern typically forms after a prolonged uptrend, signalling a potential shift in market sentiment.
- Declining Price with Minimal Wicks: The candles should ideally have small upper and lower wicks, showing that the sellers controlled the market throughout the session.
- Steady Decline: Each candlestick in the pattern opens higher than the previous candle’s close but then reverses to close lower.
Psychological Interpretation
The pattern reflects a growing bearish sentiment among traders. Each successive bearish candlestick suggests that sellers are taking over, and buying pressure is weakening. This gradual increase in selling activity is often interpreted as a sign that the market could be heading for a downturn.
How Can You Trade the Three Black Crows Chart Pattern?
The three black crows formation has general trading rules. They can be modified depending on the timeframe, market volatility, and risk tolerance.
Entry
Once the formation is confirmed with the third long red candle and additional indicators, traders enter a short position below its low.
Take Profit
The pattern doesn’t provide specific take-profit targets. Usually, traders use other technical indicators and strong support levels to determine a suitable take-profit point. Some traders set the take-profit order with regard to the risk-reward ratio, say 1:2 or 1:3.
Stop Loss
The theory states that a stop-loss order can be placed above the first candlestick’s high to potentially limit losses. Moreover, it should be based on the trader's risk tolerance and trading approach.
Live Market Example
The above example shows the formation of the three black crows’ pattern on a weekly chart of the EUR/USD pair. When the pattern formed, the relative strength index had just left the overbought zone, confirming a potential trend reversal. A trader could go short after the third long bearish candle at 1.42550 and place a stop loss near above the first pattern’s candle (at 1.51763). The profit target could be set at the next important support level of 1.23378. It took six months for the price to reach the target level.
Practical Trading Strategies Using the Three Black Crows Pattern
Now, let’s look at two specific 3 black crows trading strategies.
MACD Strategy
The combination of the three black crows candlestick pattern and the MACD crossover offers traders a strong signal of a bearish reversal after a bullish movement. The three black crows formation suggests weakening bullish momentum, while the MACD crossover confirms the shift in momentum from buyers to sellers. Together, these indicators increase the likelihood of a sustained downtrend, offering an opportunity for traders to enter the market with greater confidence.
Entry
- Traders observe a bearish MACD crossover within a few candles of the three black crows, either just before, during, or just after.
- Both conditions (pattern completion and MACD crossover) are typically met by the close of the third candle, signalling a potential opportunity for a sell trade.
Stop Loss
- Stop losses might be placed just beyond the swing point before the three black crows pattern to potentially protect against false signals.
Take Profit
- Traders often set take-profit targets at a risk-reward ratio, such as 1:2 or 1:3, to lock in potential returns.
- Alternatively, profits might be taken at key support levels where the price may reverse.
- Another option might be to exit the trade upon observing a bullish MACD crossover, signalling the end of the downtrend.
HMA Strategy
Using two hull moving averages (HMA), one set to 20 and the other to 50, provides traders with an extra filter to confirm that a downtrend is beginning following the three black crows pattern. The three black crows indicate a potential bearish reversal, but a cross of the 20-period HMA below the 50-period HMA helps confirm the strength of the downtrend. HMAs are used as they are more responsive to trend shifts than other moving averages.
Entry
- Traders look for a bearish crossover where the 20 HMA crosses below the 50 HMA within a few candles of the three black crows.
- Both the pattern and the HMA crossover typically confirm the start of a downtrend, allowing traders to enter a short position.
Stop Loss
- Stop losses might be set just above the swing high before the pattern.
- Alternatively, they might be placed above one of the HMAs, depending on the trader’s risk tolerance and desired level of protection.
Take Profit
- Take-profit targets might be based on a risk-reward ratio, such as 1:2 or 1:3.
- Traders may also take profits at a known support level where price reversal is likely.
- Another potential exit point is when the HMAs cross over again, signalling the end of the trend.
Three Black Crows vs Three White Soldiers
The three white soldiers candlestick pattern is the opposite of the three black crows. It is a bullish reversal setup that traders commonly use to identify the potential end of a prior downtrend and the start of an uptrend. It consists of three consecutive long bullish candlesticks with highs and lows higher than the previous ones and with little or no wicks. It suggests that the buyers have taken control of the market and that the price will likely continue rising. The candles together create a formation that resembles three soldiers marching in a bullish direction.
This formation is usually considered a strong bullish signal when it appears after a prolonged downtrend, in contrast to the three black crows formation, which indicates a strong potential bearish reversal. Traders often use it as an indication to enter long positions, with a stop-loss order placed near the bottom of the pattern.
Confirmation Tools
Confirmation tools can help traders ensure that the 3 black crows candlestick pattern signals a true bearish reversal rather than a short-term pullback. Here are some key tools to consider when confirming the pattern:
- Volume Increase: A spike in selling volume during the formation of the three black crows can confirm heightened pressure and a stronger likelihood of a trend reversal.
- Momentum Indicators: Tools like the Relative Strength Index (RSI), MACD, or a Stochastic Oscillator can show a shift in momentum. An overbought RSI, a bearish MACD crossover, or bearish Stochastic divergence may reinforce the bearish signal.
- Support Level Break: Watch for a break below a key support level after the three black crows form. This can further validate the downtrend, indicating that sellers are gaining control.
- Bearish Candlestick Patterns: Additional bearish patterns, such as engulfing or dark cloud cover, emerging after the three black crows, can reinforce the likelihood of a sustained downtrend.
- Moving Averages: A cross of a short-term MA below a long-term MA can offer further confirmation of a bearish reversal.
Common Mistakes When Trading the Three Black Crows Pattern
In 3 black crows trading, it's common to make several mistakes that may lead to poor results or false signals. Here are key pitfalls to watch out for:
- Ignoring Volume: Failing to check for a rise in volume during the formation of the three black crows can lead to misinterpreting the pattern. Low volume may indicate weak selling pressure and an unreliable signal.
- Trading Without Confirmation: Jumping into a trade as soon as the pattern forms without using additional confirmation tools like momentum indicators or support breaks can increase the risk of a false reversal.
- Overlooking Market Context: The three crows candlestick pattern works in specific conditions. If the pattern appears in a sideways or range-bound market, it may not signal a true trend reversal, leading to misinterpretation.
- Setting Tight Stop-Losses: Placing stop-loss orders too close to the first candlestick’s high can result in early exit due to market noise. Proper risk management with room for fluctuations is essential.
- Neglecting Trend Strength: Ignoring the strength of the prior uptrend may lead to premature trades. The pattern is believed to be the most effective after a prolonged uptrend; using it in weak trends can result in false signals.
Final Thoughts
The three black crows pattern is a powerful bearish reversal signal that can help traders identify potential downtrends after a sustained uptrend. By understanding its formation, confirming the pattern with additional technical indicators, and implementing sound risk management strategies, traders can incorporate this pattern into their trading plans. However, as with any trading strategy, patience and proper confirmation are key to avoiding false signals.
Once you have practised identifying the black crows, consider opening an FXOpen account to start your trading journey!
FAQ
What Do 3 Black Crows Mean in Trading?
The 3 black crows’ meaning refers to a candlestick pattern signalling a bearish reversal. It consists of three consecutive long bearish candlesticks following an uptrend, indicating that sellers are taking control of the market. This pattern suggests a potential shift in momentum from bullish to bearish, meaning the price is likely to decline further as selling pressure increases.
What Do Three Black Crows Indicate?
The 3 black crows’ candlestick formation, after a prolonged uptrend, indicates a potential downside reversal. It means that sellers are taking control, and the price will likely trade downwards.
What Is the Success Rate of the 3 Black Crows?
The success rate of the three black crows pattern varies depending on market conditions, timeframe, and confirmation tools used. While it is generally considered a reliable bearish reversal signal, traders often use volume, momentum indicators, and support level breaks to confirm the pattern and improve success rates.
What Is the Meaning of Identical Three Crows?
The identical three crows is a variation of the traditional pattern. In this case, the three bearish candles open at the close of the previous candlestick, showing even stronger bearish pressure. This variation suggests that sellers are overwhelming buyers consistently, signalling an even more pronounced reversal.
How Do You Trade Three Black Crows?
To trade the 3 black crows pattern, traders wait for confirmation of a bearish reversal after the three consecutive down candles in an uptrend. They enter a short position once the pattern is completed and confirmed by additional indicators like increased volume or a break below support. They may place a stop-loss order above the high of the first candle and target key support levels below for profit-taking. Traders always manage risk carefully by using stop-losses and monitoring market conditions.
Are Three Black Crows Bullish?
No, the three black crows pattern is not bullish; it is a bearish candlestick pattern. It signals a potential reversal from an uptrend to a downtrend, indicating that selling pressure is starting to overwhelm buying pressure.
Trade on TradingView with FXOpen. Consider opening an account and access over 700 markets with tight spreads from 0.0 pips and low commissions from $1.50 per lot.
This article represents the opinion of the Companies operating under the FXOpen brand only. It is not to be construed as an offer, solicitation, or recommendation with respect to products and services provided by the Companies operating under the FXOpen brand, nor is it to be considered financial advice.

Shooting Star Pattern: Meaning and Trading RulesShooting Star Pattern: Meaning and Trading Rules
In the fast-paced world of trading, recognising key chart patterns is crucial for informed decision-making. One pattern that traders often look for is the shooting star trading pattern. This article will delve into what a shooting star pattern is, how to spot it on a chart, its associated trading strategies, and its distinctions from similar patterns.
What Is a Shooting Star?
A shooting star in trading is a bearish candlestick pattern that can signify a potential reversal of an uptrend. It consists of a single candlestick with the following characteristics:
- A small body that is located at the lower end of the candlestick.
- A long upper shadow that is at least twice the length of the candle's body.
- A short or nonexistent lower shadow.
The appearance of the setup suggests that the price opened near its low and rallied significantly during the trading session but ultimately closed near its opening price. This pattern indicates sellers regained control after a brief period of bullishness.
While the formation is considered more probable when it closes red, it’s possible to see a green shooting star. A green shooting star candlestick simply indicates that sellers weren’t able to push the price down quite as aggressively.
How Can You Trade the Shooting Star?
The shooting star trading strategy involves the following key points:
- Entry: After identifying the candle in the strong uptrend, consider entering a short position. To validate the pattern, you may wait for the next one or two candles to close below the shooting star.
- Take Profit: Although candlestick patterns don’t provide specific entry and exit points, you can use common technical analysis techniques. For example, you may set a take-profit level based on the support level, Fibonacci retracement level, or nearest swing lows.
- Stop Loss: You may want to protect your position with a stop-loss order. This is usually placed above the high price of the shooting star. This helps potentially limit losses if the pattern doesn't lead to a reversal.
Let's consider a live market example of a shooting star in the stock market to illustrate the concept. A trader analyses the Meta stock chart and spots a shooting star stock pattern after an extended uptrend. They wait for confirmation, i.e. for the next bar to close lower. Upon confirmation, they decide to enter a short trade, setting their take-profit target at a significant support level and placing a stop loss above the formation’s high.
How Traders Confirm the Shooting Star Signals
Confirming the shooting star pattern's reliability involves a multifaceted approach, adding robustness to your trading decisions. Traders look beyond the candlestick itself, integrating various technical analysis tools to validate signals.
Key confirmation methods include:
- Volume Analysis: A high trading volume accompanying the shooting star candlestick pattern can strengthen the signal, indicating that the reversal is supported by significant market participation.
- Subsequent Candles: Observing the next few candles for bearish confirmation is essential. A strong bearish candle following the shooting star suggests that sellers are gaining momentum.
- Technical Indicators: Indicators can offer confirmatory signals, particularly momentum indicators like the Relative Strength Index (RSI) and Stochastic Oscillator. A moving average crossover can also add confluence.
- Support and Resistance Levels: The proximity of the shooting star to established resistance levels enhances its significance. A shooting star forming near a resistance zone often signals a strong reversal point.
- Above Swing High/Low: A shooting star pattern that breaks into the area just above a key high or low before reversing can signal a stop hunt/liquidity grab.
- Contextual Analysis: The broader market context, such as prevailing trends and economic news, can influence the pattern's effectiveness. Aligning the shooting star with broader market sentiment increases the pattern’s reliability.
Shooting Star and Other Candlestick Formations
Let's compare the shooting star with other patterns with which it is often confused.
Shooting Star vs Inverted Hammer
The shooting star and inverted hammer look similar – they have small bodies and long upper shadows. However, they differ in their implications. The former is a bearish reversal pattern found in uptrends, while the latter is a bullish reversal formation seen in downtrends.
Shooting Star vs Evening Star
Both formations signal an uptrend reversal; however, the shooting star is a single-candle setup, whereas the evening star consists of three candles, including a large bullish candle, a small-bodied candle, and a large bearish candle.
Shooting Star vs Gravestone Doji
The shooting star and gravestone doji are both bearish reversal patterns. The shooting star features a small body at the lower end of the candlestick with a long upper shadow, signifying a failed rally.
In contrast, the gravestone doji has no or a tiny real body, as the open and close prices are identical or nearly identical, with a long upper shadow and no lower shadow. The gravestone doji suggests strong indecision in the market, with buyers initially driving prices up but ultimately failing to maintain that momentum, which often signals a sharp reversal.
Shooting Star vs Hanging Man
The shooting star and hanging man also share similarities but differ in appearance and market positioning. The shooting star is a bearish pattern occurring after an uptrend, indicating a potential reversal as bears managed to pull the price down at the end of a trading session.
Conversely, the hanging man appears at the top of an uptrend as well but has a small body at the upper end and a long lower shadow, reflecting that sellers were able to push the price down significantly before buyers pulled it back up. The hanging man suggests that selling pressure is starting to outweigh buying interest.
Advantages and Limitations
This formation offers traders valuable insights, but it comes with its own set of advantages and limitations. Understanding these can help traders use the pattern more effectively within their strategies.
Advantages
- Early Reversal Signal: It provides an early indication of a potential trend reversal, allowing traders to prepare for or act on a change in market direction.
- Simplicity: The pattern is straightforward to identify, even for less experienced traders, making it an accessible tool for technical analysis.
- Versatility: It can be applied across various markets and timeframes, with traders often spotting the shooting star in forex, stock, and commodity markets as well as across both short-term and long-term charts.
Limitations
- False Signals: The pattern alone is not always reliable and can generate false signals, especially in volatile markets or when not used with other confirmation tools.
- Lack of Precision: It does not provide exact entry or exit points, requiring traders to rely on additional indicators or analysis to determine these.
- Dependency on Context: The effectiveness of the formation is highly dependent on the broader market context and trend strength, limiting its standalone use.
Final Thoughts
Understanding chart patterns like the shooting star is essential for making informed decisions in trading. Remember that while this formation can provide valuable insights, it is more effective in conjunction with other tools for signal confirmation. As a trader, staying informed about market developments and continuously honing your skills could be a key to effective trading in the dynamic trading environment. Open an FXOpen account today to trade in over 600 markets with tight spreads from 0.0 pips.
FAQ
Can Candlestick Patterns Be Time-Sensitive?
Yes, candlestick patterns vary depending on the timeframe. A shooting star on a 1-minute chart provides short-term signals, while a shooting star on a daily chart may signal a longer-term reversal. However, the choice of timeframe goes hand in hand with your market strategy and goals.
How to Improve Candlestick Pattern Recognition Skills?
Improving your candlestick pattern recognition skills requires practice and study. You can analyse historical charts, use trading simulators, read educational materials like those at FXOpen, and engage with experienced traders to gain insights and practical experience.
Why Are Candlestick Patterns Important in Trading?
Candlesticks visually represent price action and help traders identify potential trend reversals, continuations, and key support and resistance levels. They are valuable tools for technical analysis.
What Is the Meaning of a Shooting Star Pattern?
The shooting star pattern is a bearish reversal candlestick that forms after an uptrend. It signals a potential shift in market sentiment, where buyers initially drive the price higher, but sellers take over, pushing the price back down near its opening level.
Is a Shooting Star Candlestick Bullish?
No, a bullish shooting star does not exist. It is a bearish pattern, indicating that an uptrend may be losing momentum and that a reversal to the downside could be imminent. A similar bullish formation is the inverted hammer.
Is a Shooting Star a Doji?
A shooting star is not a doji. While both patterns can signal reversals, a doji has nearly identical opening and closing prices with no significant body, reflecting indecision, whereas a shooting star has a small body with a long upper shadow, indicating a failed rally.
How Can You Trade a Shooting Star Candle?
Trading this candle involves looking for confirmation of the reversal, such as a bearish candle following the pattern. Traders often set stop-loss orders above the shooting star's high and target profit levels near key support zones or previous lows.
Trade on TradingView with FXOpen. Consider opening an account and access over 700 markets with tight spreads from 0.0 pips and low commissions from $1.50 per lot.
This article represents the opinion of the Companies operating under the FXOpen brand only. It is not to be construed as an offer, solicitation, or recommendation with respect to products and services provided by the Companies operating under the FXOpen brand, nor is it to be considered financial advice.

Mastering Candlestick Patterns: Visual Guide for Traders
🔵 Introduction
Candlestick charts are among the most popular tools used by traders to analyze price movements. Each candlestick represents price action over a specific time period and provides valuable insights into market sentiment. By recognizing and understanding candlestick patterns, traders can anticipate potential price reversals or continuations, improving their trading decisions. This article explains the most common candlestick patterns with visual examples and practical Pine Script code for detection.
🔵 Anatomy of a Candlestick
Before diving into patterns, it's essential to understand the components of a candlestick:
Body: The area between the open and close prices.
Upper Wick (Shadow): The line above the body showing the highest price.
Lower Wick (Shadow): The line below the body showing the lowest price.
Color: Indicates whether the price closed higher (bullish) or lower (bearish) than it opened.
An illustrative image showing the anatomy of a candlestick.
🔵 Types of Candlestick Patterns
1. Reversal Patterns
Hammer and Hanging Man: These single-candle patterns signal potential reversals. A Hammer appears at the bottom of a downtrend, while a Hanging Man appears at the top of an uptrend.
Engulfing Patterns:
- Bullish Engulfing: A small bearish candle followed by a larger bullish candle engulfing the previous one.
- Bearish Engulfing: A small bullish candle followed by a larger bearish candle engulfing it.
Morning Star and Evening Star: These are three-candle reversal patterns that signal a shift in market direction.
Morning Star: Occurs at the bottom of a downtrend, indicating a potential bullish reversal. It consists of:
- A long bearish (red) candlestick showing strong selling pressure.
- A small-bodied candlestick (bullish or bearish) indicating indecision or a pause in selling. This candle often gaps down from the previous close.
- A long bullish (green) candlestick that closes well into the body of the first candle, confirming the reversal.
Evening Star: Appears at the top of an uptrend, signaling a potential bearish reversal. It consists of:
- A long bullish (green) candlestick showing strong buying pressure.
- A small-bodied candlestick (bullish or bearish) indicating indecision, often gapping up from the previous candle.
- A long bearish (red) candlestick that closes well into the body of the first candle, confirming the reversal.
2. Continuation Patterns
Doji Patterns: Candles with very small bodies, indicating market indecision. Variations include Long-Legged Doji, Dragonfly Doji, and Gravestone Doji.
Rising and Falling Three Methods: These are five-candle continuation patterns indicating the resumption of the prevailing trend after a brief consolidation.
Rising Three Methods: Occurs during an uptrend, signaling a continuation of bullish momentum. It consists of:
- A long bullish (green) candlestick showing strong buying pressure.
- Three (or more) small-bodied bearish (red) candlesticks that stay within the range of the first bullish candle, indicating a temporary pullback without breaking the overall uptrend.
- A final long bullish (green) candlestick that closes above the high of the first candle, confirming the continuation of the uptrend.
Falling Three Methods: Appears during a downtrend, indicating a continuation of bearish momentum. It consists of:
- A long bearish (red) candlestick showing strong selling pressure.
- Three (or more) small-bodied bullish (green) candlesticks contained within the range of the first bearish candle, reflecting a weak upward retracement.
- A final long bearish (red) candlestick that closes below the low of the first candle, confirming the continuation of the downtrend.
🔵 Coding Candlestick Pattern Detection in Pine Script
Detecting patterns programmatically can improve trading strategies. Below are Pine Script examples for detecting common patterns.
Hammer Detection Code
//@version=6
indicator("Hammer Pattern Detector", overlay=true)
body = abs(close - open)
upper_wick = high - math.max(close, open)
lower_wick = math.min(close, open) - low
is_hammer = lower_wick > 2 * body and upper_wick < body
plotshape(is_hammer, title="Hammer", style=shape.triangleup, location=location.belowbar, color=color.green, size=size.small)
Bullish Engulfing Detection Code
//@version=6
indicator("Bullish Engulfing Detector", overlay=true)
bullish_engulfing = close < open and close > open and close > open and open < close
plotshape(bullish_engulfing, title="Bullish Engulfing", style=shape.arrowup, location=location.belowbar, color=color.blue, size=size.small)
🔵 Practical Applications
Trend Reversal Identification: Use reversal patterns to anticipate changes in market direction.
Confirmation Signals: Combine candlestick patterns with indicators like RSI or Moving Averages for stronger signals.
Risk Management: Employ patterns to set stop-loss and take-profit levels.
🔵 Conclusion
Candlestick patterns are powerful tools that provide insights into market sentiment and potential price movements. By combining visual recognition with automated detection using Pine Script, traders can enhance their decision-making process. Practice spotting these patterns in real-time charts and backtest their effectiveness to build confidence in your trading strategy.

How Do Traders Spot and Use the Dragonfly Doji CandlestickHow Do Traders Spot and Use the Dragonfly Doji Candlestick Pattern?
The dragonfly doji candlestick pattern holds intrigue and fascination for traders in financial markets. Its distinct shape and positioning on price charts make it a keen subject for observation and analysis. In this article, we will explore this setup, its significance, and how traders use it in their trading strategies.
What Does a Dragonfly Doji Mean?
The red or green dragonfly doji is a candlestick pattern that forms when the opening, closing, and high prices of an asset are equal or almost equal. This formation resembles the shape of a dragonfly because it has an extended lower shadow. It provides bullish signals and is considered a neutral pattern as it provides continuation and reversal signals, depending on its context within a trend. The meaning of a dragonfly doji is that there is uncertainty in the market, and traders are prompted to carefully analyse other factors before making trading decisions.
Traders may find the dragonfly doji pattern on charts of different financial instruments, such as currencies, stocks, cryptocurrencies*, ETFs, and indices, regardless of the timeframe. Test this pattern on various assets with FXOpen’s TickTrader platform.
The Psychology Behind the Dragonfly Doji
The dragonfly doji candle pattern reflects a tug-of-war between buyers and sellers, where neither side gains a decisive advantage. Its formation indicates that sellers initially push prices lower, but buyers step in to push prices back up to the opening level. This results in the distinct long lower shadow and minimal upper shadow.
The psychological meaning of the dragonfly candlestick pattern is significant; it shows that despite bearish pressure, buyers are strong enough to regain control by the close. It signals indecision, highlighting the need for traders to carefully evaluate other indicators and the broader trend before making trading decisions.
How Can You Trade the Dragonfly Doji?
The bullish dragonfly doji provides valuable information about market sentiment. Here are two scenarios where this formation can be significant:
The Dragonfly Doji in an Uptrend
In a bullish trend, the dragonfly doji is generally seen as a continuation signal. This is because, despite sellers attempting to push the price lower, buyers remain active and prevent a significant decline. However, it is worth noting that the inability of buyers to push the price above its open level may indicate a potential weakening of bullish momentum. Traders may consider entering the trade above the open/close of the doji’s candle or if the proceeding bar closes above the doji’s open/close. The stop-loss level may be placed below the candlesticks, while the take-profit target may be set at the nearest resistance level.
In the chart above, the pattern formed in an uptrend, and the trader placed a long trade on the next bar. The stop loss was set below the candle, with the take profit at the closest resistance level.
Dragonfly Doji in a Downtrend
The dragonfly doji in bearish trends may suggest a possible upward reversal. The long lower shadow indicates that buyers entered the market, pushing the price up from its lows. This could be seen as a signal to consider going long or watching for a further bullish confirmation before taking action. Traders may place a stop loss below the candle with a take profit at the closest resistance level or may consider the appropriate risk/reward ratio.
The candle at the end of a downtrend signals a price reversal. The trader placed a buy order at the high of the doji with a stop-loss level below it. The take profit is calculated based on the risk/reward ratio.
Traders can enhance their trading strategies by utilising the free TickTrader trading platform.
How Can You Confirm the Dragonfly Doji?
Confirming the dragonfly doji may increase the reliability of trading decisions. Here are key factors to consider:
- Volume Analysis: High trading volume during the formation of a dragonfly candle may indicate stronger market sentiment and increase the likelihood of a significant move.
- Subsequent Candlesticks: Traders look for a bullish candlestick following the dragonfly candlestick. This reinforces the potential for a trend reversal or continuation.
- Support and Resistance Levels: A formation occurring near significant support levels can strengthen its validity as a potential reversal signal.
- Technical Indicators: To gauge momentum and confirm signals, traders often complement the analysis with indicators like the Relative Strength Index (RSI), moving averages, and Bollinger Bands.
- Market Context: It’s best to evaluate the broader market trend and news that may impact market sentiment to provide a clearer picture of its implications.
Dragonfly and Other Patterns
Dragonfly doji, gravestone doji, spinning top, and long-legged doji are all types of candlestick patterns commonly used in technical analysis to indicate potential reversals or indecision in the market. Traders often pay close attention to them when making trading decisions.
Dragonfly Doji vs Gravestone Doji
While the dragonfly doji has a long lower shadow and little or non-existent upper one, the gravestone or inverted dragonfly doji has a long upper wick and little or non-existent lower one. Both patterns indicate indecision, but the dragonfly provides bullish signals, whereas the gravestone indicates potential bearish reversals.
Dragonfly Doji vs Long-Legged Doji
The dragonfly has a long lower shadow with little to no upper shadow, indicating a potential bullish reversal. In contrast, the long-legged version has long upper and lower shadows, reflecting significant indecision and equal pressure from buyers and sellers without a clear directional bias.
Dragonfly Doji vs Hammer
The dragonfly and the hammer both signal potential bullish reversals, but they differ in appearance and context. The dragonfly has no upper shadow, but it has a very small body and an extended lower shadow, while the hammer has a body at the top of the candlestick and a long lower shadow. The hammer typically appears after a downtrend, signalling a reversal, while the dragonfly doji appears in uptrends and downtrends.
Limitations of the Dragonfly Doji
While the dragonfly doji is a valuable candlestick formation for traders, it is not without its limitations. Recognising these constraints can help them understand how to use it most effectively.
- False Signals: The dragonfly sometimes produces false signals, leading traders to anticipate reversals that do not materialise.
- Market Context: Its effectiveness is heavily influenced by the broader market context. It may not be reliable in all situations, particularly in choppy or sideways assets.
- Confirmation Needed: Additional indicators or subsequent price action are usually required to confirm the pattern, as relying solely on its appearance can be risky.
- Limited Power: It does not provide information on the magnitude of the subsequent price movement, making it challenging to set precise profit targets.
Closing Thoughts
Candlestick patterns should not be relied upon as the sole factor in trading decisions. It is essential to perform a comprehensive analysis and implement robust risk management strategies before making any trades. Once you are confident in your analysis, consider opening an FXOpen account to take advantage of spreads as tight as 0.0 pips and commissions starting at just $1.50.
FAQ
What Does Doji Candle Mean?
A doji candle represents a session where the opening and closing prices are almost equal, indicating market indecision. It suggests neither buyers nor sellers are in control, resulting in a standoff. Doji candles can take various forms, including dragonfly, gravestone, and long-legged, each with unique implications.
What Does a Dragonfly Doji Indicate?
A dragonfly doji indicates indecision and potential trend reversal. It forms when the open, high, and close prices are near the same level but it has a long lower shadow. This formation suggests buyers counteracted initial selling pressure, signalling a possible bullish shift.
Is the Dragonfly Doji Bullish or Bearish?
The dragonfly is generally considered bullish, especially after a downtrend. Its formation indicates buyers pushed prices back to the opening level, potentially leading to a price increase.
What Is the Opposite of the Dragonfly Doji?
The opposite of the dragonfly doji is the gravestone doji. The dragonfly has a long lower shadow and little to no upper shadow, while the gravestone features a long upper shadow and minimal lower shadow, indicating a potential bearish reversal.
*Important: At FXOpen UK, Cryptocurrency trading via CFDs is only available to our Professional clients. They are not available for trading by Retail clients. To find out more information about how this may affect you, please get in touch with our team.
Trade on TradingView with FXOpen. Consider opening an account and access over 700 markets with tight spreads from 0.0 pips and low commissions from $1.50 per lot.
This article represents the opinion of the Companies operating under the FXOpen brand only. It is not to be construed as an offer, solicitation, or recommendation with respect to products and services provided by the Companies operating under the FXOpen brand, nor is it to be considered financial advice.

Mastering the Marubozu Candlestick Pattern in Trading Mastering the Marubozu Candlestick Pattern in Trading
Have you been looking at a chart for hours, wondering when to buy or sell? In one moment, the chart is green, screaming “buy.” Next, it’s all red, and the price is falling. Buying or selling becomes a tough decision if you resonate with this. However, candlesticks on your chart can help you.
This FXOpen article will help cover one of them – the Marubozu candle pattern. Tag along to learn about this candlestick, its types, and how to trade using it.
What Is a Marubozu Candle?
A Marubozu is a candlestick with no wicks that has a long body. It signals a strong price action as buyers or sellers dominate the session. “Marubozu” is a Japanese term meaning “bald” or “close-cropped.”
It can be bearish (if the open price is above the close) or bullish (if the open price is below the close). When it occurs, traders prepare for a significant price movement. But first, how can you identify it?
Marubozu in a Range
In a range, the price moves within horizontal support and resistance. It indicates that the buyers and sellers are in a serious battle, and neither dominates. It also shows that traders have their hands folded with little activity.
A Marubozu might break the range, indicating that momentum is starting to build up. Aside from range, the Marubozu candlestick pattern occurs in a trend. This might be at its
beginning, middle, or end.
Marubozu Starts a Trend
A new trend starting with a solid price movement may contain a Marubozu. It might pop up due to important news events. Traders who come on board early might have more room to capture new opportunities.
Marubozu in Mid-Trend
Whether it’s a bull run or a bear market, trends often slow down for some time. This causes traders to slow their activities. Afterwards, trends pick up the pace and continue in the same direction.
A Marubozu candlestick pattern may signal that traders’ momentum is back, and they can position themselves for market opportunities. This may occur mid-trend or after the trend halts for a period.
Marubozu Ends a Trend
The end of a trend is a spot where investors position themselves for new opportunities. Why? A new trend will likely begin, and catching it allows one to place a new trade. This is a reversal, and the Marubozu candlestick pattern can show when it occurs.
Marubozu Candle Types
There are two main types of the Marubozu pattern in forex, commodity, stocks, crypto*, and other markets.
Bearish Marubozu Candlestick
What does a red (bearish) Marubozu mean? A red Marubozu indicates strong selling pressure in the market. It forms when the open price is at the highest point of the period and the close price is at the lowest, meaning the price fell consistently throughout the session without any upward movement.
You may consider these steps in trading the bearish Marubozu pattern:
- Identify the bearish Marubozu.
- Consider opening a short trade at the next candle or after a few candles form.
- Place the stop-loss level above the nearest swing high.
- Take profit at the next swing low, support level, or based on other technical analysis tools.
Check this example for a vivid illustration:
Bullish Marubozu Candlestick
A bullish Marubozu is the opposite of the bearish version. It catches the eyes of bulls seeking buying opportunities. It opens at a low price and closes at a high, so it has no wicks. The significant length of the candle also indicates buying pressure.
The theory states you can trade the bullish Marubozu candlestick pattern as follows:
- Identify the bullish (green) Marubozu candle.
- Consider going long at the opening of the next candle or after a few candles form.
- Place a stop-loss level below the closest swing low.
- Take profit at the next swing high, when the price begins to range, or when other technical analysis tools signal a price reversal.
Here’s an example providing more details:
How Can You Confirm a Marubozu?
Confirming the Marubozu candlestick pattern involves more than just spotting its distinct body. Traders often look for additional signals to validate the strength and direction indicated by the Marubozu. Traders typically consider the following factors for confirmation:
- Volume Spike: A significant increase in trading volume accompanying the Marubozu can suggest the price movement has conviction. The high volume shows that many market participants are behind the move.
- Trend Context: Marubozu patterns within an established trend hold more weight. For instance, a bullish Marubozu during an uptrend is more likely to lead to continued bullish action than one in a sideways market.
- Proximity to Key Levels: Traders often observe support and resistance levels. A Marubozu breaking through a key resistance or support level confirms momentum, as it shows the market overpowering those critical areas.
- Candlestick Clustering: The following candles can provide additional context. For example, if after a bearish Marubozu, bearish candles appear, it reinforces the downward momentum.
Limitations of the Marubozu Pattern
While the Marubozu candlestick pattern signals strong momentum, it comes with certain limitations that traders must consider:
- Lack of Context: A Marubozu doesn't provide enough context on its own. Without understanding the broader trend or the market conditions, it may not accurately determine future price movements.
- False Signals in Sideways Markets: In ranging or choppy markets, a Marubozu can create false signals. The pattern might suggest a breakout, but if the market is indecisive, the movement may not follow through.
- Absence of Retracement Information: The Marubozu doesn't indicate whether the price will retrace before continuing in the same direction. Traders may enter too early, only to face pullbacks that can hit stop-loss levels.
- Dependence on Volume: While a Marubozu shows strong price action, low trading volume can render it unreliable. A lack of volume behind the move could indicate weak conviction from market participants.
Trading Strategies Involving Marubozu
Finally, let’s take a closer look at a couple of Marubozu trading strategies.
Marubozu Retracement Breakout
This strategy revolves around identifying a Marubozu candle in line with a broader trend and waiting for a brief price retracement before the trend continues—similar to the concept of a dead cat bounce. Traders can use this setup to capture trend breakouts.
Entries
After observing a Marubozu candle that aligns with the prevailing trend, traders typically wait for the moment when the price briefly moves against the trend before resuming. Once the retracement is identified, a stop order can be placed at the high (for bullish setups) or low (for bearish setups) of the candle formed before the retracement.
Stop Loss
Traders may place a stop-loss order above the opposite end of the retracement move. For a bullish setup, this means below the retracement low, while in a bearish setup, it would be above the retracement high.
Take Profit
Profits might be taken at a favourable risk-reward ratio, such as 1:3. Alternatively, traders may aim for a significant area of support or resistance where a reversal is likely.
Marubozu EMA Strategy
This strategy combines the Marubozu candlestick pattern with a pair of exponential moving averages (EMAs) to confirm strong trend momentum. Traders often use one short EMA and one long EMA, such as 12 and 28, though some may prefer alternatives like 9 and 21 or 20 and 50.
Entries
Traders typically look for the Marubozu candle to close strongly through one or, ideally, both EMAs. This signals strong momentum in the trend direction. Some traders may choose this as their entry point, while others may prefer to wait for extra confirmation, such as a crossover between the two EMAs, signalling a stronger trend continuation.
Stop Loss
Stop-loss orders might be set just beyond the high (for bearish setups) or low (for bullish setups) of the Marubozu candle. Alternatively, more conservative traders might place the stop beyond one of the recent highs/lows, depending on their risk tolerance and the specific setup.
Take Profit
Profits might be taken at a preferred risk-reward ratio, such as 1:3. Another common approach is to target a significant support or resistance level, where a reversal is more likely.
Final Thoughts
The Marubozu candlestick pattern, when combined with other forms of analysis and tools, offers traders a powerful way to capture market momentum. FXOpen provides an ideal platform for applying these strategies, offering more than 600 markets, blazing-fast speeds of trade execution, and competitive trading costs. Open an FXOpen account today to explore these opportunities and enhance your trading experience. Good luck!
FAQ
What Is a Marubozu in Candlestick?
The Marubozu candle meaning refers to a candlestick with no upper or lower wicks, indicating that the price opened and closed at extreme levels during a session. Its long body reflects strong buying or selling momentum, depending on whether it’s bullish (green) or bearish (red).
How Can You Identify a Marubozu?
A Marubozu candlestick can be identified by its lack of wicks. In a bullish Marubozu, the open price is at the lowest point, and the close is at the highest, signifying strong buying pressure. A bearish Marubozu is the opposite, with the open at the highest point and the close at the lowest, showing dominant selling pressure.
What Is the Difference Between Bullish and Bearish Marubozu?
The difference lies in price movement. A bullish Marubozu opens at a low and closes at a high, reflecting strong buying pressure. In contrast, a bearish Marubozu candlestick pattern opens at a high and closes at a low, indicating strong selling momentum.
How Can You Trade a Bullish Marubozu?
Traders often look for a bullish Marubozu pattern in uptrends or at key support levels. It suggests further upward momentum. Confirmation through volume or other indicators, like moving averages, is often sought to enhance trading decisions.
What Does a Marubozu Determine?
A Marubozu determines strong market momentum, with a bullish Marubozu indicating continued upward movement and a bearish Marubozu signalling further downward pressure or a potential trend reversal, depending on the market context.
How Does a Marubozu Work?
A Marubozu works by showing a candlestick with no wicks, indicating that either buyers (in a bullish type) or sellers (in a bearish type) were in complete control throughout the trading session, signalling strong market momentum in the direction of the candlestick.
*At FXOpen UK, Cryptocurrency CFDs are only available for trading by those clients categorised as Professional clients under FCA Rules. They are not available for trading by Retail clients.
Trade on TradingView with FXOpen. Consider opening an account and access over 700 markets with tight spreads from 0.0 pips and low commissions from $1.50 per lot.
This article represents the opinion of the Companies operating under the FXOpen brand only. It is not to be construed as an offer, solicitation, or recommendation with respect to products and services provided by the Companies operating under the FXOpen brand, nor is it to be considered financial advice.

What Is a San-Ku (Three Gaps) Pattern?What Is a San-Ku (Three Gaps) Pattern?
The intriguing and captivating San-Ku, or Three Gaps, pattern draws the curiosity of traders within financial markets. Its distinctive form and strategic placement on price charts make it a compelling subject for observation and analysis. This article aims to explore the intricacies of the San-Ku pattern, highlighting its importance and providing insights into how traders can incorporate it into their trading strategies.
What Is a Three Gaps (San-Ku) Pattern?
The San-Ku, or Three Gaps, pattern is a distinctive technical analysis formation characterised by three consecutive upward or downward price gaps. This pattern often signifies a significant shift in market sentiment and a potential trend reversal. Traders keen on spotting trend changes find the formation intriguing due to its clear visual representation on price charts.
Identifying the setup involves recognising three successive gaps in the price movement, whether upward or downward. These gaps indicate abrupt shifts in market sentiment and are typically accompanied by increased trading volume. The pattern manifests itself as a series of price jumps, creating a visual sequence that stands out on a chart.
How to Trade the San-Ku Three Spaces
Traders may enter a position based on the assumption of a trend reversal. In a bullish formation, you may consider entering a long position after the third gap down, signalling a potential bullish trend. Conversely, in a bearish pattern, you may initiate a short position after the third gap, anticipating a bearish trend.
To establish a take-profit level, you may assess the historical price behaviour around the formation. Look for significant support or resistance levels, trendlines, or Fibonacci retracement levels to gauge potential reversal points. Adjust your take profit accordingly, aiming for a favourable risk-to-reward ratio.
Implementing a well-placed stop loss is crucial to manage risk. You may position the stop loss below the setup in an upward pattern and above the setup in a downward pattern. This may help mitigate potential losses if the market does not follow the expected reversal.
Live Market Example
Let's explore a live market example. In this scenario, we observe the setup, indicating a potential reversal of a bullish trend.
A trader could enter a short position after the third candle closes, anticipating a bearish trend, setting the take-profit level at a support level based on historical price action. As the trader used a daily chart, the stop-loss level was supposed to be calculated based on the risk/reward ratio and placed above the Triple Gap.
Final Thoughts
Although San-Ku is an effective pattern, it can’t guarantee a trend reversal. As with any technical analysis tool, it's crucial to consider the broader market context and use risk management strategies to improve overall trading performance. Remember, no pattern guarantees success, and thorough analysis remains paramount in making informed trading decisions. If you want to test different trading approaches, you can open an FXOpen account.
FAQ
Is the Three Gaps Setup Suitable for All Types of Assets?
This formation can be applied to various financial instruments, including stocks, currencies, commodities, and indices. However, it's essential to adapt your strategy to the specific characteristics of the asset you are trading and consider factors like liquidity and market behaviour.
How Can Traders Stay Updated on Potential Three Gaps Formations?
Traders can use charting platforms, technical analysis tools, and market scanners to stay informed about potential Three Gaps formations. Setting up alerts for specific price movements and gap occurrences can also help traders promptly identify opportunities as they arise.
Are There Any Common Mistakes Traders Make When Interpreting the Three Gaps?
One common mistake is relying solely on the setup without considering broader market conditions. Traders shouldn’t neglect the overall trend, market sentiment, and potential catalysts that could influence price movements. Additionally, thorough backtesting and analysis are crucial to validating the reliability of the pattern in different market conditions.
Can I Find the Three Gaps Pattern on the NVDA Candlestick Chart?
You can find this pattern in different markets, but remember that its effectiveness will depend on the timeframe you use and the strategy you implement. Keep in mind that the presence of the Three Gaps Pattern on a stock's chart does not guarantee future price movements. It's essential to conduct thorough technical and fundamental analysis and practise risk management when making trading decisions.
Trade on TradingView with FXOpen. Consider opening an account and access over 700 markets with tight spreads from 0.0 pips and low commissions from $1.50 per lot.
This article represents the opinion of the Companies operating under the FXOpen brand only. It is not to be construed as an offer, solicitation, or recommendation with respect to products and services provided by the Companies operating under the FXOpen brand, nor is it to be considered financial advice.

Short Idea Netflix (NFLX)Based on
1)presidential cycles (post election cycle )
2)overvalued conditions
3)quantitative data that shows 80% win rate for shorts on post election cycle years
4)bearish reversal candle

Three Outside Up and Down Candlestick PatternsThree Outside Up and Down Candlestick Patterns: How to Identify and Trade Them
The three outside up and three outside down candlestick patterns offer traders a powerful way to analyse potential market reversals. Formed by 3 consecutive candlesticks they can signal key shifts in market sentiment, providing valuable insights into future price movements. In this article, we’ll break down how traders identify, trade, and confirm these patterns.
What Are the Three Outside Up and Down Patterns?
The three outside candlestick patterns are powerful tools in technical analysis that can help traders analyse potential market reversals. These patterns are made up of three consecutive candlesticks that reveal shifts in market sentiment. There are two variations: the three outside up and three outside down formations, each signalling opposite directions.
In a three outside up pattern, the first candle is a small bearish one, followed by a second, larger bullish candle that completely engulfs the first. The third candle is another bullish one, confirming the momentum shift toward a potential upward trend. This type typically forms after a downtrend, hinting that the market could be turning bullish.
On the flip side, the three outside down candlestick pattern starts with a small bullish candle. The second candle is a larger bearish one that engulfs the first, and the third is another bearish bar, signalling that sellers are gaining control. This formation usually appears after an uptrend and suggests a possible bearish reversal.
Three outside candle patterns are particularly useful because they provide multiple points of confirmation—first, the engulfing candle, and then the third which further solidifies the trend. They often appear on various asset classes, from stocks to forex, and can be a valuable part of a trader's analysis.
The Psychology Behind The Three Outside Patterns
Understanding the psychology driving these patterns can give traders better insight into market dynamics. With the three outside up candlestick pattern, the initial small bearish candle shows hesitation, but the large bullish candle that follows reflects a surge in buyer confidence. The final bullish candle confirms that buyers have taken control, possibly signalling a shift from bearish to bullish sentiment.
In contrast, the three outside down reflects a change from bullish optimism to bearish caution. The first candle shows a continuation of buying pressure, but the second, larger bearish bar reveals that sellers are stepping in with strength. The third bearish candle reinforces this shift in market sentiment.
Identification Steps
Identifying the three outside candle patterns is straightforward once you know what to look for. The key is focusing on the structure and order of the three candlesticks.
Want to have a go at spotting the formation for yourself? Head over to FXOpen to access hundreds of real-time charts.
Three Outside Up Pattern
- First Candle: This is a small bearish candlestick that occurs within a downtrend. It suggests that the market still favours sellers, but it’s weak.
- Second Candle: The crucial point of the formation. The second candle is a much larger bullish one that engulfs the entire body of the first one.
- Third Candle: Another bullish candle that confirms the pattern. Its close is above the second’s close, solidifying the upward momentum.
Three Outside Down Pattern
- First Candle: This is a small bullish candle within an uptrend, reflecting weaker buying interest.
- Second Candle: The key feature. A larger bearish bar fully engulfs the first one.
- Third Candle: A second bearish candle follows, closing lower than the second and reinforcing the shift in sentiment toward selling pressure.
Other Considerations
- Engulfing Candle Size: The bigger the second candle in relation to the first, the stronger the signal. It indicates a more decisive shift in market sentiment.
- Timeframe: They can appear across various timeframes, but they're expected to be more reliable on longer ones, such as daily or weekly charts. Lower timeframes can lead to wrong trade decisions.
- Context: While the formation itself is important, it’s key to consider the broader market environment. Combining it with other forms of analysis, like trendlines or indicators, can increase the reliability of your trade decisions.
Three Outside Candle Pattern: a Trading Strategy
Trading the three outside up and three outside down patterns requires understanding both how to spot the signal and how to manage the trade. Here’s a step-by-step approach to using these patterns in real-world scenarios.
Entering a Trade
For both types, traders typically wait for the close of the third candle to confirm the pattern before making any moves. For the three outside up, a trader may analyse the close of the third bullish bar as confirmation of potential upward momentum. In contrast, for the three outside down, the third bearish candle indicates potential downward momentum.
It’s common to enter trades at the open of the next candlestick, following the pattern, but waiting for a slight pullback or additional confirmation from another technical indicator (e.g., RSI or moving averages) is also a prudent strategy.
Stop Loss Placement
To potentially manage risk, traders often place stop losses at strategic points on the chart. In the case of a three outside up, it’s typical to place a stop loss just below the low of the engulfing (second) candle. This allows some breathing room but potentially protects against the risk of a reversal.
For the three outside down, a stop loss is commonly set just above the high of the engulfing candlestick.
Take Profit Strategy
Setting a take-profit target usually involves identifying potential resistance or support levels. For a three outside up, traders often target the next key resistance level. It’s also common to use a risk-reward ratio of 1:2 or higher, ensuring that the potential returns justify the risk taken.
In the case of a three outside down pattern, traders aim for the next support level as a potential area to take returns. Again, maintaining a favourable risk-reward ratio is crucial in preserving long-term trades.
How Traders Confirm Three Outside Candlestick Patterns
Confirming the three outside up and three outside down patterns is crucial for potentially avoiding false signals and increasing the reliability of your analysis. While the formation can signal a potential reversal, using additional tools to verify the move can help traders make more accurate decisions.
Here are a few ways traders typically confirm the pattern:
- Momentum Indicators: Traders often use momentum tools like the relative strength index, moving average convergence divergence, or stochastic oscillator to gauge whether the pattern aligns with market momentum. If these indicators show overbought or oversold conditions, it can confirm the strength of the signal.
- Volume Analysis: An increase in volume on the second and third candlesticks adds weight to the analysis, suggesting that more market participants are involved in the move. Higher volume often indicates stronger conviction behind the shift.
- Trendlines and Moving Averages: Many traders use trendlines or moving averages to confirm the pattern’s validity. For a three outside up, a breakout above a downtrend line or crossing above a key moving average reinforces the bullish signal. For a three outside down, a break below a trendline or drop under a moving average strengthens the bearish case.
Common Mistakes to Avoid
While these patterns can provide useful insights, there are common mistakes traders make when using them. Understanding them can help improve analysis and decision-making.
- Ignoring Volume: One of the key signs of a strong formation is the higher volume on the second and third candles. Without this, it may lack the strength needed to suggest a real market shift.
- Use in Isolation: Relying solely on the candlestick pattern without considering other indicators or market conditions often leads to misleading signals. It’s important to incorporate other technical tools to build a stronger case.
- Forcing the Pattern: Traders sometimes try to identify the pattern even when it doesn’t meet the criteria, leading to poor decisions. Both the engulfing and confirmation bars need to be clear and distinct for the formation to be valid.
- Overlooking Trend Context: They are more reliable when they occur after a clear uptrend or downtrend. Attempting to trade them in a range-bound market or against the prevailing trend can reduce their effectiveness.
The Bottom Line
The three outside patterns are valuable tools for identifying potential market reversals when combined with other technical analysis methods. In combination with sound risk management, these formations can offer traders a boost in their strategies.
To put what you’ve learned into practice across more than 700 markets, consider opening an FXOpen account. FXOpen offers several advanced trading platforms, low costs, and blazing-fast trade execution speeds designed to upgrade your trading experience.
FAQ
What Is the Pattern of Three Outside Candlesticks?
The three outside candlesticks pattern is a reversal formation made up of three consecutive candles. In the three outside up, a small bearish candle is followed by a larger bullish one that engulfs it. A third bullish candle confirms the upward move. The three outside down is the opposite, starting with a small bullish candlestick engulfed by a larger bearish one, with a final bearish candle confirming the potential downtrend.
What Happens After Three Outside Up?
After a three outside up, the market may experience a bullish reversal. The formation suggests that buyers are gaining momentum, and traders may see upward price movement following the confirmation of the third candle.
What Is the Success Rate of the Three Outside Up?
The success rate of the three outside up pattern varies depending on market conditions and timeframe. While it can be an effective reversal signal, it’s expected to be more reliable when combined with other indicators like volume or trendlines.
What Do Three Candlesticks Mean?
Three candlesticks refer to a specific pattern where three consecutive candles form a signal, often indicating potential reversals or trend confirmations in technical analysis.
What Is 3 Candlestick Strategy?
The 3 candlestick strategy involves identifying patterns like three outside up or three outside down, where 3 candles signal potential market reversals or continuations. It’s often used to analyse future price movements.
Trade on TradingView with FXOpen. Consider opening an account and access over 700 markets with tight spreads from 0.0 pips and low commissions from $1.50 per lot.
This article represents the opinion of the Companies operating under the FXOpen brand only. It is not to be construed as an offer, solicitation, or recommendation with respect to products and services provided by the Companies operating under the FXOpen brand, nor is it to be considered financial advice.

BTC | W-BOTTOM Pattern Continuation - UPDATEA quick continuation on yesterday's BTC update, with regards to the bullish W bottom pattern that likely takes us into the new ATH.
There are a few conditions that need to be met in order to "secure" the W pattern, but we're currently not seeing these conditions met. The good news, is that it's beginning to look more like a cup an handle pattern, also a bullish pattern.
This daily lose and especially the weekly close is going to be a KEY candle close to watch.
___________________
BINANCE:BTCUSDT

LAZ is bullish to 60The stock has showcased bullish engulfing pattern and ready to reach the target of 60.
It has also breached the bearish trendline and ready to move up with the stop below WEMA 10.
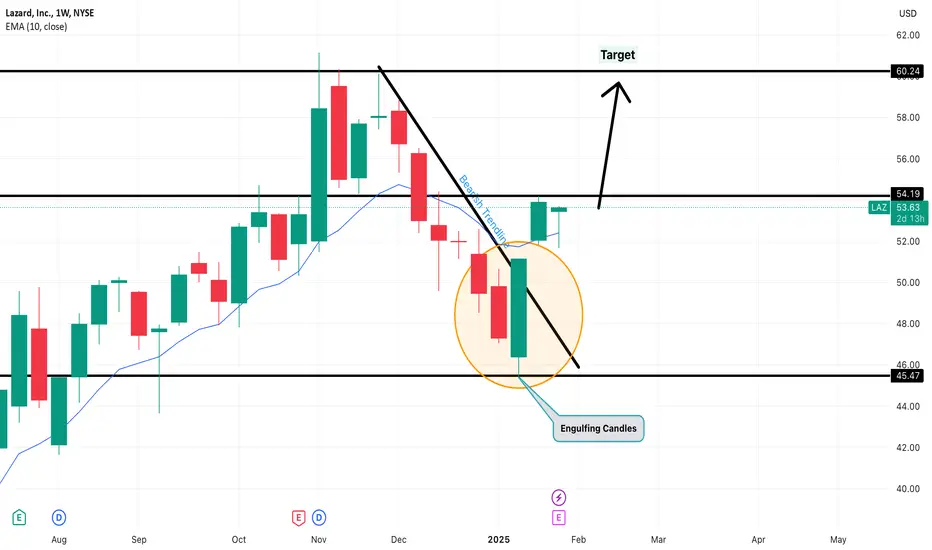
BUY EURUSD H4 | FOREX BEEHey Traders,
This EUR/USD H4 chart suggests a bullish scenario, with price action breaking key levels and retesting them for continuation. Here's the technical analysis:
### Observations:
1. Trend Analysis:
- The price has broken above the descending trendline, signaling a shift from a bearish to a bullish bias.
- The breakout has been followed by a successful retest within the green zone, confirming it as a support level.
2. Key Levels:
- Support: The green zone around 1.0480-1.0500 has acted as a strong support after the breakout.
- Resistance: The chart highlights a target near the 0.5 Fibonacci level at 1.0694.
3. Retest Zone:
- The blue highlighted area indicates a retest of the broken trendline and horizontal support. This confluence area strengthens the bullish case.
4. Fibonacci Levels:
- The 0.236 Fibonacci level (~1.0424) was successfully held, suggesting that the retracement is over and the upward momentum may resume.
5. Potential Movement**:
- The price is expected to continue its bullish movement, as indicated by the blue arrows, with a primary target around 1.0694.
---
### My Thoughts:
This chart looks bullish, with a strong base formed around 1.0480-1.0500. Watching for further confirmation through price action, such as higher highs and higher lows, would be wise. However, a break below the retest area could invalidate this setup and shift the bias.

Move to 138.47After breaking the resistance level of 116.18 with a spike and pullback to the level of 116, we expect a move to the level of 140 on the daily time frame.
Trade simply, the market is not complicated!

Example of how to use the Trend-Based Fib Extension tool
Hello, traders.
If you "Follow", you can always get new information quickly.
Please also click "Boost".
Have a nice day today.
-------------------------------------
There was a question about how to select the selection point when using the Trend-Based Fib Extension tool, so I will take the time to explain the method I use.
Since it is my method, it may be different from your method.
-
Before that, I will explain the difference from the general Fibonacci retracement tool.
The Fibonacci retracement tool uses the Fibonacci ratio as the ratio to be retracement within the selected range.
Therefore, the low and high points are likely to be the selection points.
The reason I say it is likely is because the lowest and highest points are different depending on which time frame chart it was drawn on.
Therefore, in order to use a chart tool that specifies a selection point like this, you must basically understand the arrangement of candles.
If you understand the arrangement of candles, you can draw the support and resistance points that make up it and determine the importance of those support and resistance points.
The HA-MS indicator that I am using is a more objective version of this.
Unlike the published HA-MS indicator, several have been added.
I do not plan to disclose the formulas of these added indicators yet.
However, if you share my ideas, you can use them normally at any time.
The selection point for using the current Fibonacci retracement tool is the point that the fingers are pointing to.
In other words, the 1st finger is the low point, and the 2nd finger is the high point.
One question may arise here.
Why is it the position of the 1st finger?
The reason is that it is the starting point of the current wave.
Therefore, you can find out the retracement ratio in the current rising wave.
In fact, it is not recommended to use the Fibonacci ratio as support and resistance.
This is because it is better to use the Fibonacci ratio to check how much wave is being reached and how much movement is being shown in chart analysis.
However, the Fibonacci ratio can be usefully used when the ATH or ATL is updated.
-
If the Fibonacci Retracement tool was a chart tool that found out the retracement ratio in the current wave, the Trend-Based Fib Extension tool can be said to be a chart tool that found out the extension ratio of the wave.
Therefore, while the Fibonacci Retracement tool requires you to specify two selection points, the Trend-Based Fib Extension tool requires you to specify three selection points.
That's how important it is to understand the arrangement of the candles.
The chart above is an example of drawing to find out the extension ratio of an uptrend
The chart above is an example of drawing to find out the extension ratio of a downtrend
Do you understand how the selection points are specified by looking at the example chart?
-
The chart above is the chart when the 1st finger point is selected.
The chart above is the chart when the 1-1 hand point is selected.
When drawing on a lower time frame chart, you should be careful about which point to select when the arrangement of the candles is ambiguous.
Examples include the 1st finger and the 1-1 finger.
It may be difficult to select 1-1 and 1 depending on whether they are interpreted as small waves or not.
The lower the time frame chart, the more difficult this selection becomes.
Therefore, it is recommended to draw on a higher time frame chart if possible.
The reason is that the Fibonacci ratio is a chart tool used to analyze charts.
In other words, it is not drawn for trading.
In order to trade, you trade based on whether there is support or resistance at the support and resistance points drawn on the 1M, 1W, and 1D charts.
-
Thank you for reading to the end.
I wish you successful trading.
--------------------------------------------------

GBPUSD Week 4 Swing Zone & LevelDynamic Take profit, dtp allows trade to catch big moves. These are set based on price momentum. Last week provided a humble 40pips.
Initial Swing Zone/Level are calculated at
Zone: 21599-21549
Level set as shown. Either a or b could play out, as determined by Price action.
As price breaks or bounces off these areas, new zones/levels will be recalculated.
Happy trading week

Key spot on the board for SOFI On the MonthlyNever financial advice. Just offering perspective.
At a key spot for Sofi. In the midst of a monthly bearish imbalance, specifically a bearish fair value gap which holds more weight than a volume imbalance. We pushed off a bullish breaker which can be a solid indicator as a push up, with the the high of that green box acting as a support, followed by a strong bullish move.
16.47-17.13 is where the monthly bearish fvg begins and ends.
A monthly close(13days) above 17.13 would be encouraging for bulls, with no bearish imbalances on this higher timeframe.
If we cannot get a monthly candle close above 17.13 we can see a strong rejection, setting a new bullish range from most recent low to high, which we can then see a move back into discount.
My ideal bearish outlook: Monthly bearish imbalance reject, which is currently at 50% bearish discount, to retest bullish breaker + bullish fvg + monthly liquidity sitting at the low of previous month10.63. Targeting ----> 8.53- 10.63.
Ideal bullish outlook(continuation):
Monthly bearish imbalance mitigated here with a monthly candle close above here. Next points of liquidity ---24.65---24.95 as targets.
Ideal bullish outlook(entry or reentry):
Entering ----> 8.53- 10.63.
Be aware that this analysis is on a higher timeframe of a Monthly perspective and may take time to develop.

Price Action Trading: Key ConceptsPrice Action Trading: Key Concepts
Price action is a popular trading method where traders analyse raw price movements on a chart, without relying on technical indicators. Traders identify patterns, trends, and key levels that help them understand market behaviour. This article explores what price action is, the key concepts, and how to get started with a price action strategy.
What Is Price Action Trading?
Price action is the movement of an asset’s price over time, and it’s one of the purest forms of market analysis. When using price action, indicators like moving averages or oscillators take a back seat, with traders focusing solely on the movement of the market itself. In studying how prices behave in real-time or historically, traders can spot trends, patterns, and potential turning points in the market.
At its core, price action is about reading the market’s “story” through its movements. Traders look at how an asset has moved in the past—whether it’s rising, falling, or ranging—to understand what it might do next. This analysis often revolves around key levels, such as support (where prices tend to stop falling) and resistance (where they tend to stop rising).
Because price action relies purely on market data, it offers a clear view of sentiment without the “noise” of external indicators. This makes it a go-to method for traders who prefer a straightforward approach. Price action also can be used in any market—whether it’s forex, stocks, or commodities—and across various timeframes too, from short-term day trading to long-term investing.
Understanding this style isn’t automatic—it requires practice, observation, and an eye for patterns. However, once traders get the hang of it, price action can provide valuable insight into the market’s behaviour and help them analyse future trends.
Key Price Action Concepts
Now, let’s take a look at some core price action concepts.
Support and Resistance
Support and resistance levels are foundational in price action analysis. These are key levels that the market has historically struggled to move past. Support represents a level where the market tends to stop falling, acting like a “floor,” as buying pressure increases. Resistance is the opposite, serving as a “ceiling” where upward movements tend to halt, as selling pressure grows.
Traders use support and resistance to identify potential levels where the market might reverse or pause. If a price breaks through one of these levels, it can signal a continuation of the trend, while a bounce off the level might indicate a reversal.
Trends
At its simplest, a trend shows the direction in which a given market is headed. In an uptrend, prices are making higher highs and higher lows, showing consistent bullish momentum. In a downtrend, the opposite is true: prices make lower lows and lower highs, indicating bearish sentiment.
Swing highs and lows are critical when spotting trends. A swing high is a peak formed when the market moves up and then reverses down. A swing low is the opposite. Tracking these highs and lows allows traders to identify the current trend.
Trendlines and Price Channels
A trendline is a straight line that connects multiple swing highs or swing lows in a trending market. It visually represents the direction of the trend and helps traders spot potential areas where the market may find support or resistance.
When two parallel trendlines are drawn—one connecting swing highs and the other swing lows—it forms a price channel. Channels help traders see the range in which the price is moving, and it’s common for prices to bounce between the upper and lower boundaries of the channel. Breakouts from them can signal a shift in trend direction.
Candlestick Patterns
Candlestick patterns are formed by the movement of price over a specific period and are widely used in price action trading.
Some common candlestick price action trading patterns include:
- Pin Bar/Hammer/Shooting Star: A candle with a long wick and small body, indicating a rejection of higher or lower prices. It can suggest a potential trend reversal.
- Engulfing Pattern: A two-candle pattern where the second candle fully engulfs the previous one, signalling a shift in momentum. A bullish engulfing pattern suggests buyers are taking control, while a bearish engulfing pattern shows sellers are gaining strength.
- Doji: A candle with little to no body, where the open and close prices are nearly identical. It suggests indecision in the market and can signal a potential reversal, depending on where it appears in a trend.
Chart Patterns
Price action chart patterns are shapes that form on a chart, which traders use to determine future price movements. They can indicate the continuation or reversal of a trend.
Some common chart patterns include:
- Head and Shoulders: A reversal pattern that signals a shift from an uptrend to a downtrend (or vice versa). It consists of three peaks, with the middle one being the highest (the "head") and the outer two being lower (the "shoulders").
- Double Top/Double Bottom: These reversal patterns form when the price tests a level twice and fails to break through, indicating a potential reversal.
- Triangles: Symmetrical, ascending, or descending triangles indicate consolidation periods before a breakout.
Breakouts
A breakout occurs when an asset moves outside a defined support, resistance, or trendline level. Breakouts can signal that the market is gaining momentum in a particular direction.
When prices break beyond a support or resistance level, it can suggest that traders are pushing prices in a given direction and that momentum is likely to continue. Traders often watch for breakouts from chart patterns like triangles or channels.
Reversals
A reversal happens when a market trend changes direction. In an uptrend, a reversal would occur when prices stop making higher highs and higher lows and start forming lower lows instead. Reversals are often marked by candlestick patterns or chart patterns like head and shoulders or double top/bottom.
Retracements
A retracement is a temporary reversal in the direction of a trend, where the asset moves against the prevailing trend but eventually continues in the same direction. Traders often use tools like Fibonacci retracement levels to identify potential areas where the market might retrace before resuming its original trend.
Volume
Volume measures how much of an asset is being traded over a certain period. In price action trading, volume is used to confirm the strength of market movements. For example, if the price breaks through a significant resistance level with high volume, it can indicate that the breakout is more likely to be sustained. On the other hand, breakouts on low volume might suggest the move lacks conviction and could reverse.
Volatility
Volatility refers to the degree of price movement in the market over time. Price action traders pay attention to volatility because it can influence how they interpret patterns and levels. In periods of high volatility, an asset may break through key levels quickly, while in low volatility periods, it might stay within a narrow range.
How Traders Read Price Action
Let’s now look at an overview of how the process typically unfolds:
1. Beginning with a Clean Chart
Price action trading doesn’t rely on indicators, so the first step is to clear the chart of anything unnecessary. Traders focus on raw market data, meaning you’ll only initially need candlesticks or bars in a price action chart.
2. Identifying Market Structure
Once the chart is clean, traders assess the market structure. This means figuring out whether the market is trending or ranging. In a trend, prices make consistent highs and lows, moving upwards or downwards. If the market is ranging, the price moves horizontally within a set range between support and resistance levels.
3. Looking for Patterns and Key Levels
Next, traders focus on spotting recurring patterns and identifying key levels where the price has previously reacted. Patterns such as candlestick formations and chart setups (e.g., triangles or head and shoulders) give insight into what the market might do next. These patterns help traders anticipate reversals or breakouts based on past behaviour. Key levels like support and resistance guide where the price might stall or reverse.
4. Analysing Price Movements in Real-Time
As the price moves, traders observe how it reacts to these key levels or patterns. Does it slow down near resistance, or does it break through with momentum? Does it pull back to support before continuing upward? These real-time reactions tell traders whether the market is maintaining its trend or if a reversal could be on the horizon.
5. Confirming with Volume and Volatility
Traders often look at volume and volatility to further validate what’s happening on the chart. Higher volume can suggest stronger market moves, while volatility reveals how quickly the market is shifting. These extra layers of analysis provide confirmation of whether a breakout or reversal is likely to hold.
Building a Price Action Trading Strategy
Creating a price action trading strategy is about developing a personalised approach based on key patterns and setups that resonate with you. The steps mentioned above form the foundation of price action trading. However, traders usually build their own strategy over time, focusing on a handful of setups they find effective.
Initially, traders choose a few concepts to work with and avoid getting overwhelmed by too much information. For example, you could look for pin bars that appear during retracements at support or resistance in line with a trend. Another approach might be identifying a breakout after a double top or bottom, especially if it’s backed by high volume. Alternatively, traders often use candlestick patterns to trade the upper and lower boundaries of a price channel.
Setups like these can be backtested in trading platforms with FXOpen, using historical data to understand why and where certain setups work. It does take time to develop an eye for price action patterns, but it’s worth the effort to be able to identify opportunities well before lagging technical indicators do.
Lastly, risk management is crucial when trading price action. Before you try out any setup, try to understand the best risk management practices for that pattern. For instance, traders might place a stop-loss just beyond a pin bar’s wick or slightly below the lows in a double bottom to limit potential losses if the market moves unexpectedly.
The Bottom Line
Price action offers traders a straightforward way to analyse market movements and make decisions based on real-time data, prioritising repeating patterns rather than indicators. To put price action trading into practice, consider opening an FXOpen account to access more than 700 live markets and our advanced low-cost, high-speed trading environment.
FAQ
What Is Price Action?
The price action meaning refers to the movement of an asset's price over time. Traders analyse these movements, without relying on indicators, to identify trends, patterns, and potential turning points in the market.
How to Read Price Action?
Reading price action involves analysing market movements on a clean chart. Traders identify trends, key levels of support and resistance, and chart and candlestick patterns.
What Is Price Action Trading?
Price action trading is a strategy where traders make decisions based on the raw movements of an asset. Instead of using technical indicators, they focus on chart patterns, trends, and levels of support or resistance to analyse the market.
What Is the M Pattern in Price Action?
The M pattern, or double top, is a bearish reversal pattern that looks like the letter "M." It forms when the price tests a resistance level twice but fails to break through, signalling a potential move downwards.
Do Price Patterns Work?
Price patterns can work, but they are not foolproof. They are often used to identify potential market movements, but outcomes may vary depending on market conditions and other factors.
Do Professional Traders Use Price Action?
Yes, many professional traders use price action as a core part of their trading strategies. It provides a direct way to analyse market behaviour without relying on external indicators.
This article represents the opinion of the Companies operating under the FXOpen brand only. It is not to be construed as an offer, solicitation, or recommendation with respect to products and services provided by the Companies operating under the FXOpen brand, nor is it to be considered financial advice.

#NIFTY50 TRADE SETUP - 30TH DECEMBER !!Nifty 50 Chart Analysis - 1 day Chart VieW
NSE:NIFTY
Nifty 50 Chart Analysis - Detailed Breakdown
Key Observations:
1. Current Price Zone: The Nifty index is trading at 23,832, with the price consolidating near recent lows.
2. Key Resistance Zones:
- 24,197.50: A significant resistance level, aligning with prior price rejections and a potential reversal area.
- 24,069.95: Intermediate resistance that needs to be cleared for bullish continuation.
3. Key Support Zones:
- 23,586.25: A strong support zone where buyers might step in, preventing further downside.
- 23,262.15: A deeper support level, marking the lower boundary of the recent bearish structure.
4. Market Sentiment: The price action indicates uncertainty, with equal probabilities of breakout above the resistance or breakdown below support.
Price Movement Summary:
- Upside Potential: A breakout above 24,197.50 could push the index towards 24,300+ levels. Thiszone has been highlighted in the chart as a bullish target area (marked in red box).
- Downside Risk: If the index breaks below 23,586.25, it could test 23,262.15 or lower, as depictedin the bearish target zone.
Trading Plan:
1. Bullish Plan:
- Entry: Above 24,069.95.
- Target 1: 24,197.50.
- Target 2: 24,300+.
- Stop-Loss: Below 23,961.55 (current pivot zone).
2. Bearish Plan:
- Entry: Below 23,586.25.
- Target 1: 23,536.60.
- Target 2: 23,262.15.
- Stop-Loss: Above 23,832.45.
Summary:
- Nifty is at a critical juncture, with immediate resistance at 24,069.95 and support at 23,586.25.
- Traders should wait for confirmation (breakout or breakdown) before initiating positions.
- Risk management is crucial as the index approaches year-end volatility.
Disclaimer:
This content is for educational purposes only. It is not a recommendation to buy or sell any financial instrument.The creator is not a SE-BI-registered advisor. Please consult with a certified professional before making investment decisions.

NZDJPY is all set to continue its upward movement! The price is moving within an ascending channel and has just hit the lower limit again, bouncing back up and forming a bullish candlestick with a long lower wick and a small body. This suggests that sellers have made another unsuccessful try to change the trend, even creating a higher low that backs up the uptrend. The price is also bouncing off the 50% Fibonacci retracement level. NZDJPY is moving towards the major volume activity price range around 90.5. On top of that, volume analysis backs this up, indicating that buyers are getting stronger and ready to push the price up.
Time Frame: daily
Idea support:
- Price action
- Volume Analysis
- Trend analysis
