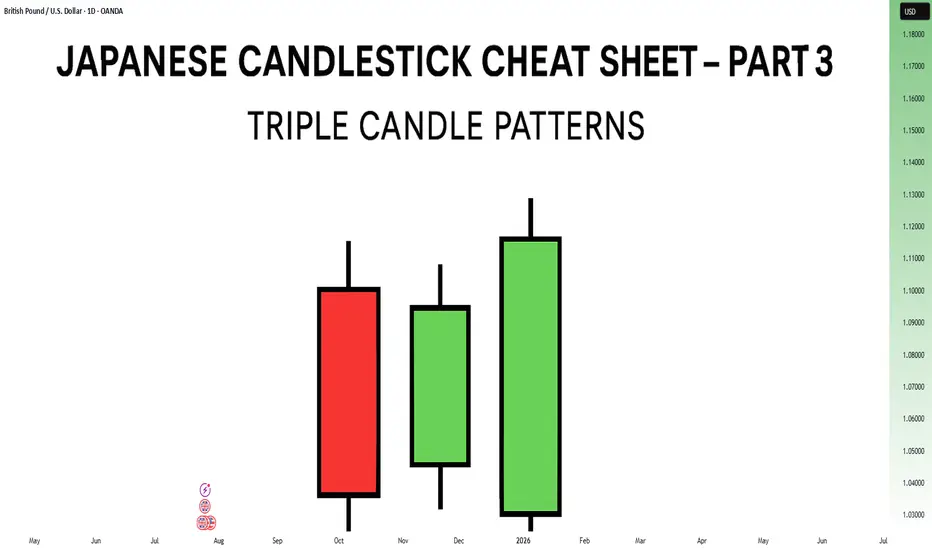
Japanese Candlestick Cheat Sheet – Part Three- 3 candle patternsSo far in this series, we've broken down single candle formations ( Part 1 ) and explored double candle signals ( Part 2 ) — the kind of patterns that give you quick, often powerful hints about the market’s mood.
But now it’s time to go a step further.
👉 In Part 3, we dive into triple candlestick formations — patterns that take more time to form, but often offer stronger confirmation and a more reliable narrative.
They’re like reading three full sentences from the market instead of just one or two words.
If you’re ready to spot momentum shifts (not noise), this lesson is for you.
Let’s decode the story behind formations like Morning Star, Three White Soldiers, and so on.
MORNING STAR
Bias: Bullish
What is the Morning Star pattern?
The Morning Star pattern consists of a bearish candle, a small-bodied middle candle, and a bullish candle, forming at the end of a downtrend to signal potential reversal. This pattern reflects a shift from seller dominance to buyer strength, as the middle candle marks a pause before a reversal. The Morning Star is a reliable signal that buyer interest is reemerging.
Understanding Morning Stars helps traders anticipate shifts in momentum, providing valuable entry points for new uptrends.
Meaning:
Found in downtrends; signals potential bullish reversal as buyers gain control, with strength confirmed by the third candle closing above the first.
BULLISH ABANDONED BABY
Bias: Bullish
What is the Bullish Abandoned Baby pattern?
The Bullish Abandoned Baby is a rare but powerful reversal pattern that consists of a bearish candle, a gapped doji, and a bullish candle. The middle doji reflects indecision, while the third bullish candle confirms the reversal. This pattern highlights a dramatic shift in sentiment, showing that buyers are prepared to take control.
Recognizing the Bullish Abandoned Baby can offer traders insights into pivotal market shifts.
Meaning:
Appears in downtrends; suggests a strong bullish reversal, as the middle doji shows indecision, with confirmation by a strong bullish move.
THREE WHITE SOLDIERS
What is the Three White Soldiers pattern?
The Three White Soldiers pattern consists of three consecutive bullish candles, each closing higher than the last, often appearing in downtrends to signal a potential bullish reversal. This pattern reflects sustained buying pressure, indicating that buyer sentiment is strong. Psychologically, it shows that buyers are steadily gaining confidence, pushing prices upward.
For traders, Three White Soldiers provide a clear signal of momentum, ideal for capturing emerging trends.
Meaning:
Found in downtrends; signals potential trend reversal, showing sustained buying strength, often signaling the start of a bullish trend.
MORNING DOJI STAR
What is the Morning Doji Star pattern?
The Morning Doji Star pattern is similar to the Morning Star, but with a doji as the middle candle, indicating greater indecision before a reversal. This pattern consists of a bearish candle, a doji, and a bullish candle, highlighting a transition from bearish to bullish sentiment. The doji reflects a moment when market sentiment is balanced, but the third candle confirms a bullish shift.
Interpreting Morning Doji Stars can help traders identify turning points in downtrends, providing valuable entry opportunities.
Meaning:
Appears in downtrends; signals potential bullish reversal, with indecision from the doji and confirmation by a strong bullish candle.
EVENING STAR
What is the Evening Star pattern?
The Evening Star is a three-candle pattern that appears at the top of an uptrend, signaling a potential bearish reversal. It consists of a bullish candle, a small-bodied middle candle, and a bearish candle, showing a transition from buyer control to seller strength. This pattern often appears at market peaks, where optimism is giving way to caution.
Understanding the Evening Star pattern helps traders anticipate downtrend formations, allowing them to time their exits.
Meaning:
Found in uptrends; signals potential bearish reversal as sellers gain control, confirmed if the third candle closes below the first.
BEARISH ABANDONED BABY
What is the Bearish Abandoned Baby pattern?
The Bearish Abandoned Baby is the bearish counterpart to the Bullish Abandoned Baby and consists of a bullish candle, a gapped doji, and a bearish candle. This pattern reveals a dramatic shift in sentiment from bullish to bearish, highlighting a sudden reversal at the top of an uptrend.
Recognizing the Bearish Abandoned Baby can offer traders insight into market tops and impending trend changes.
Meaning:
Appears in uptrends; indicates strong bearish reversal, as indecision in the doji is followed by selling strength.
THREE BLACK CROWS
What is the Three Black Crows pattern?
The Three Black Crows pattern consists of three consecutive bearish candles, each closing lower than the last, appearing in uptrends to signal potential reversal. This pattern reflects sustained selling pressure, indicating that sellers are gaining control. The Three Black Crows highlight a moment when buyer confidence wanes, marking the beginning of downward momentum.
For traders, this pattern provides a clear signal to avoid buying into weakening trends or even entering short trades.
Meaning:
Found in uptrends; signals potential bearish reversal, with sustained selling pressure often marking the start of a downtrend.
EVENING DOJI STAR
What is the Evening Doji Star pattern?
The Evening Doji Star is similar to the Evening Star, but with a doji as the middle candle, highlighting greater indecision. This pattern consists of a bullish candle, a doji, and a bearish candle, indicating a shift from bullish to bearish sentiment. The doji suggests that buyers are losing control, with sellers prepared to reverse the trend.
Understanding Evening Doji Stars allows traders to recognize market tops, helping them avoid overextended trends.
Meaning:
Appears in uptrends; signals potential bearish reversal, as the doji suggests indecision, confirmed by strong selling on the third candle.
Candlesticktrader
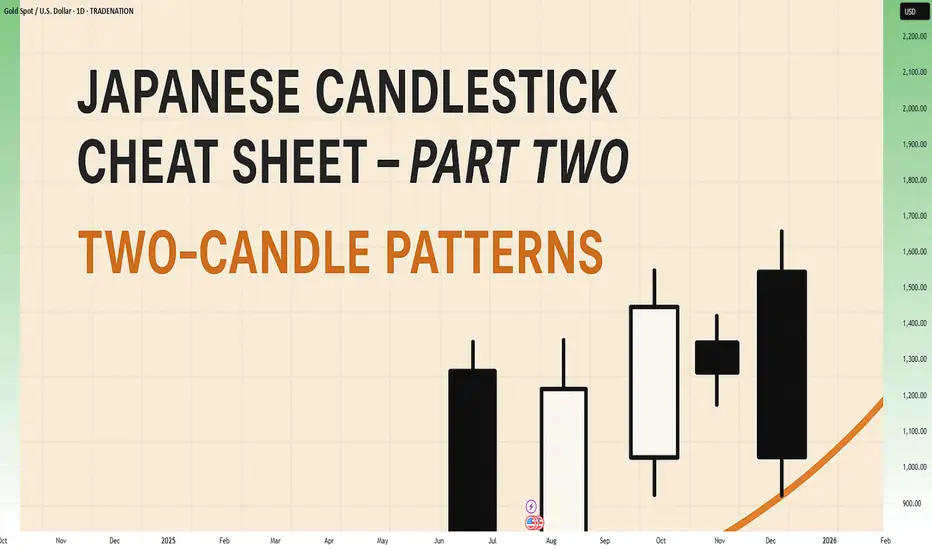
Japanese Candlestick Cheat Sheet – Part Two- 2 candle patternsTwo-Candle Patterns That Signal Shifts in Sentiment
Single candles whisper…
But two candles talk to each other — and when they do, they often reveal the first signs of a reversal or continuation.
In this second part of the series, we go deeper.
From engulfings to haramis, tweezer tops to piercing lines — these patterns don’t just look good on charts… they capture the psychological tug-of-war between buyers and sellers.
Price doesn’t lie.
And two candles in a row can say: “Something just changed.”
Learn to spot them early. Learn to listen when the chart speaks.
This is Part Two of your practical guide to mastering candlestick formations.
BULLISH KICKER
Bias: Bullish
What is the Bullish Kicker pattern?
The Bullish Kicker forms when a strong bullish candle follows a bearish one with no overlap between the two, indicating a sudden shift in sentiment. This pattern is a powerful indicator of a reversal as buyers take control. The sharp contrast between the bearish and bullish candles reflects a dramatic shift in market psychology, where bears are caught off-guard and forced to cover their positions.
Bullish Kickers are rare but extremely telling, providing a clear signal that sentiment is favoring buyers. Recognizing such decisive patterns can be a game-changer.
Meaning:
Found after downtrends or sell-offs; suggests a sudden shift in sentiment, indicating strong buying interest and potential trend reversal.
BULLISH ENGULFING
Bias: Bullish
What is the Bullish Engulfing pattern?
The Bullish Engulfing pattern occurs when a large bullish candle fully engulfs the previous smaller bearish candle, signaling a potential trend reversal. This pattern highlights a moment when buyers overpower sellers, often marking the beginning of upward momentum. Psychologically, it suggests that buyer confidence is returning, and sellers are losing their grip.
For traders, understanding Bullish Engulfing patterns can provide crucial entry points into emerging trends. Learning to identify and trade such patterns is essential for capturing momentum and new trends.
Meaning:
Typically found in downtrends, this pattern signals a potential bullish reversal as buyers overpower sellers, often indicating a shift toward upward momentum.
BULLISH HARAMI
Bias: Bullish
What is the Bullish Harami pattern?
The Bullish Harami consists of a small bullish candle within a preceding larger bearish one, indicating a pause in downward momentum and hinting at a potential reversal. This pattern shows that sellers are beginning to weaken as buyers cautiously test the waters. The Harami reflects a shift in sentiment from bearish to neutral, often marking a transitional phase in the market.
Interpreting the Bullish Harami helps traders spot moments when sentiment is shifting, potentially signaling the start of a trend change.
Meaning:
Seen in downtrends, it suggests indecision, with possible bullish reversal if the following candles confirm buying strength, indicating a weakening bearish trend.
PIERCING LINE
Bias: Bullish
What is the Piercing Line pattern?
The Piercing Line forms when a bullish candle opens below the previous bearish candle’s low but closes over halfway into it. Found in downtrends, this pattern reflects strong buying pressure as buyers step in at lower prices, creating a potential bullish reversal. The Piercing Line pattern suggests that sentiment may be shifting as buyers gain confidence.
This pattern’s strength lies in its psychological impact, revealing moments when buyers are willing to take risks. Recognizing these signs early can provide valuable insights for traders looking to time entries.
Meaning :
Found in downtrends, this pattern suggests a possible bullish reversal if buying continues, as sellers lose control to buyers.
TWEEZER BOTTOM
Bias: Bullish
What is the Tweezer Bottom pattern?
The Tweezer Bottom pattern is characterized by two consecutive candles with nearly identical lows, one bearish and one bullish. This pattern often signals the end of a downtrend, as the matching lows suggest a strong support level where buyers are stepping in. The Tweezer Bottom highlights market psychology at work, with sellers unable to push prices lower, reflecting renewed buying interest.
Tweezer Bottoms are ideal for traders looking to identify support zones and potential reversal points. By understanding this pattern’s significance, traders can make informed decisions.
Meaning:
Found in downtrends, it signals potential reversal, showing strong support at the matching low, suggesting buyers are stepping in.
BEARISH KICKER
Bias: Bearish
What is the Bearish Kicker pattern?
The Bearish Kicker is the inverse of the Bullish Kicker, forming when a strong bearish candle follows a bullish one without overlap, indicating a sharp sentiment shift. This pattern often marks a sudden reversal, with sellers taking control after an initial bullish period. Psychologically, Bearish Kickers are powerful, signaling that buyers are caught off-guard and losing momentum.
Recognizing Bearish Kickers provides traders with insights into sudden shifts in market dynamics, helping them avoid buying into weakening trends.
Meaning:
Found after uptrends; indicates a sudden sentiment shift, signaling potential trend reversal and intensified selling pressure.
BEARISH ENGULFING
Bias: Bearish
What is the Bearish Engulfing pattern?
The Bearish Engulfing pattern forms when a large bearish candle engulfs the previous smaller bullish candle, suggesting a potential reversal in an uptrend. This pattern signals that sellers have regained control, often marking the start of downward momentum. The Bearish Engulfing reveals a psychological shift, as selling pressure overtakes buying interest.
This pattern is a powerful tool for traders who aim to catch trend reversals, allowing them to align with emerging downward momentum.
Meaning:
Typically found in uptrends, this pattern signals a potential bearish reversal as sellers overpower buyers, often indicating a downward momentum shift.
BEARISH HARAMI
Bias: Bearish
What is the Bearish Harami pattern?
The Bearish Harami consists of a small bearish candle contained within a larger preceding bullish one, reflecting indecision and a potential trend reversal. Found in uptrends, it hints that buyers are losing strength, while sellers are cautiously testing the market. This pattern highlights moments when buyer momentum begins to wane, suggesting caution.
Interpreting the Bearish Harami allows traders to spot potential shifts in sentiment, helping them manage risk and time their exits.
Meaning:
Seen in uptrends, it suggests indecision with a potential bearish reversal if following candles confirm, indicating a weakening bullish trend.
DARK CLOUD COVER
Bias: Bearish
What is the Dark Cloud Cover pattern?
The Dark Cloud Cover appears when a bearish candle opens above the previous bullish candle but closes over halfway into it, reflecting a shift in control from buyers to sellers. This pattern suggests that bullish momentum may be fading, hinting at a potential reversal. Dark Cloud Cover patterns reveal moments when sentiment shifts from optimism to caution.
For traders, understanding this pattern helps them anticipate reversals at the top of uptrends.
Meaning:
Found in uptrends; signals potential bearish reversal if selling continues, as buyers lose control to sellers.
TWEEZER TOP
Bias: Bearish
W hat is the Tweezer Top pattern?
The Tweezer Top is formed by two candles with matching or nearly matching highs, typically one bullish and one bearish. This pattern signals potential resistance, as sellers are consistently pushing back against the same level. The Tweezer Top reflects a moment of seller strength, often marking the end of an uptrend.
Recognizing Tweezer Tops helps traders spot resistance zones and potential reversal points, allowing them to avoid buying into weakening trends or even shorting the asset.
Meaning:
Found in uptrends, it signals potential reversal, showing strong resistance at the matching high, suggesting selling pressure.
🧭 Final Thought
Two-candle formations often appear at key turning points — right where most traders hesitate or get trapped.
Learn to read them not just as patterns, but as conversations between candles — one pushing, the other reacting.
And if this is your first time reading the series, don’t miss Part One – where we covered single-candle signals like dojis, hammers, and marubozus — the very foundations of candlestick reading.
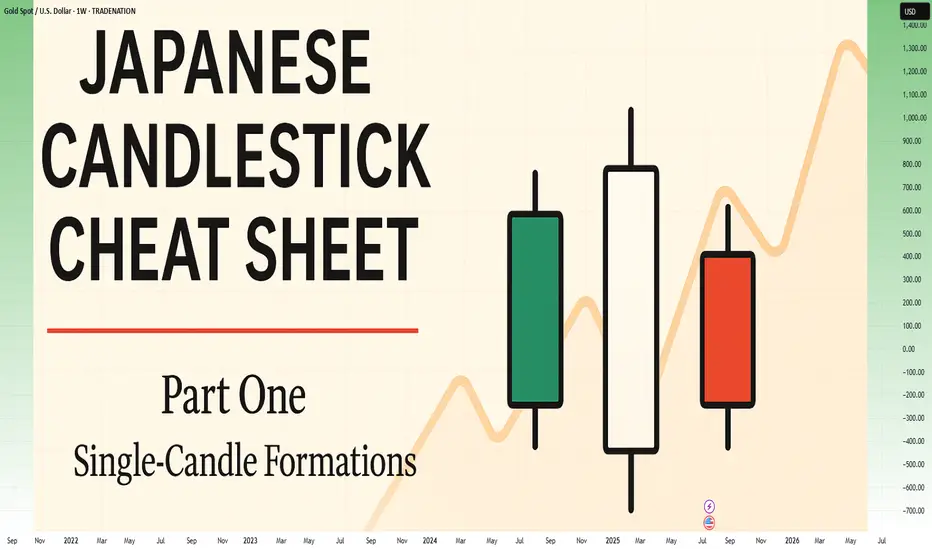
Japanese Candlestick Cheat Sheet – Part OneSingle-Candle Formations That Speak
Before you dream of profits, learn the one language that never lies: price.
Indicators are just subtitles — price is the voice.
Japanese candlesticks are more than just red and green bars — they reflect emotion, pressure, and intention within the market.
This series will walk you through the real psychology behind candlestick patterns — starting here, with the most essential:
🕯️ Single-candle formations — the quiet signals that often appear before big moves happen.
If you can’t read a doji, you’re not ready to understand the market’s hesitation.
If you ignore a hammer, you’ll miss the moment sentiment shifts.
Let’s start simple. Let’s start strong.
This is Part One of a five-part series designed to build your candlestick fluency from the ground up.
1. DOJI
Bias: Neutral
What is the Doji pattern?
The Doji candlestick pattern forms when a candle’s open and close prices are nearly identical, resulting in a small or nonexistent body with wicks on both sides. This pattern reflects market equilibrium, where neither buyers nor sellers dominate. Dojis often appear at trend ends, signaling potential reversals or pauses.
As a fundamental tool in technical analysis, Dojis help traders gauge the psychological battle between buyers and sellers. Proper interpretation requires context and experience, especially for spotting trend shifts.
Meaning:
Indicates market indecision or balance. Found during trends and may signal a reversal or continuation based on context.
LONG-LEGGED DOJI
Bias: Neutral
What is the Long-Legged Doji pattern?
The Long-Legged Doji captures a moment of intense uncertainty and volatility in the market. Its long wicks represent significant movement on both sides, suggesting that neither buyers nor sellers have control. This back-and-forth reflects the psychology of market participants wrestling for control, which often foreshadows a shift in sentiment. When traders see a Long-Legged Doji, it highlights the need to monitor for potential changes in direction.
They can appear within trends, at potential reversal points, or at consolidation zones. When they form at the end of an uptrend or downtrend, they often signal that the current trend may be losing momentum.
Meaning:
The prominent wicks indicate volatility. Buyers and sellers pushed prices in opposite directions throughout the session, ultimately reaching an indecisive close.
SPINNING TOP
Bias: Neutral
What is the Spinning Top pattern?
A Spinning Top is a candlestick with a small body and long upper and lower wicks, indicating that the market has fluctuated significantly but ultimately closed near its opening price. This pattern often points to a moment of indecision, where both buyers and sellers are active but neither dominates. Spinning Tops are commonly found within both uptrends and downtrends and can suggest that a trend is losing momentum.
For traders, a Spinning Top provides a valuable insight into market psychology, as it hints that the prevailing sentiment may be weakening. While Spinning Tops alone aren’t always definitive, they can serve as a precursor to larger moves if the following candles confirm a shift in sentiment.
Meaning:
Shows indecision between buyers and sellers. Common in both up and downtrends; signals potential reversal or pause.
HAMMER
Bias: Bullish
What is the Hammer pattern?
A Hammer candlestick appears at the end of a downtrend, with a small body and a long lower wick. This shape reflects a moment when sellers pushed prices lower, but buyers managed to absorb the selling pressure and drive prices back up before the close. This pattern is particularly important for spotting potential reversals, as it indicates that buyers are beginning to reassert control.
Hammers reveal the underlying psychology of a market where buying confidence is emerging, even if sellers have dominated for a while. To successfully trade this pattern, it’s essential to confirm the reversal with subsequent candles.
Meaning:
Showing rejection of lower prices. Signals potential bullish reversal, especially if followed by strong buying candles.
INVERTED HAMMER
Bias: Bullish
What is the Inverted Hammer pattern?
The Inverted Hammer forms at the bottom of a downtrend, with a small body and long upper wick. This pattern shows that buyers attempted to push prices higher, but sellers ultimately brought them back down by the close. The Inverted Hammer is an early sign of buyer interest, hinting that a trend reversal may be underway if subsequent candles confirm the shift.
Interpreting the Inverted Hammer helps traders understand where sentiment may be shifting from bearish to bullish, often marking the beginning of a recovery. Recognizing these patterns takes practice and familiarity with market conditions.
Meaning:
Showing rejection of higher prices. Can signal bullish reversal if confirmed by subsequent buying pressure.
DRAGONFLY DOJI
Bias: Bullish
What is the Dragonfly Doji pattern?
The Dragonfly Doji has a long lower wick and no upper wick, forming in downtrends to signal potential bullish reversal. This pattern reveals that sellers were initially in control, pushing prices lower, but buyers stepped in to push prices back up to the opening level. The Dragonfly Doji’s unique shape signifies that strong buying support exists at the lower price level, hinting at an impending reversal.
Recognizing the psychology behind a Dragonfly Doji can enhance a trader’s ability to anticipate trend changes, especially in markets where support levels are being tested.
Meaning:
Found in downtrends; suggests possible bullish reversal if confirmed by a strong upward move.
BULLISH MARUBOZU
Bias: Bullish
What is the Bullish Marubozu pattern?
The Bullish Marubozu is a large, solid candle with no wicks, indicating that buyers were in complete control throughout the session. This pattern appears in uptrends, where it signals strong buying momentum and often foreshadows continued upward movement. The absence of wicks reveals that prices consistently moved higher, with little resistance from sellers.
For traders, the Bullish Marubozu offers a glimpse into market psychology, highlighting moments when buyer sentiment is particularly strong. Learning to identify these periods of intense momentum is crucial for trading success.
Meaning:
Showing complete buying control. Found in uptrends or at reversal points; indicates strong buying pressure and likely continuation of the trend.
SHOOTING STAR
Bias: Bearish
What is the Shooting Star pattern?
The Shooting Star appears at the top of an uptrend, characterized by a small body and a long upper wick, indicating a potential bearish reversal. Buyers initially drove prices higher, but sellers took over, bringing prices back down near the open. This shift suggests that buyers may be losing control, and a reversal could be imminent.
Interpreting the Shooting Star gives traders valuable insights into moments when optimism begins to fade, providing clues about a potential trend shift.
Meaning:
Indicating rejection of higher prices. Signals a potential bearish reversal if followed by selling pressure.
HANGING MAN
Bias: Bearish
W hat is the Hanging Man pattern?
The Hanging Man candle forms at the top of an uptrend, with a small body and long lower wick. This pattern suggests that sellers attempted to drive prices down, but buyers regained control. However, the presence of a long lower shadow hints that sellers may be gaining strength, potentially signaling a bearish reversal.
The Hanging Man pattern reflects market psychology where buyers might be overextended, making it a valuable tool for identifying potential tops in trends.
Meaning:
Signals potential bearish reversal if confirmed by selling candles afterward.
GRAVESTONE DOJI
Bias: Bearish
What is the Gravestone Doji pattern?
With a long upper wick and no lower wick, the Gravestone Doji reveals that buyers pushed prices up, but sellers eventually regained control. Found in uptrends, it suggests that a bearish reversal could be near, as the upper shadow indicates buyer exhaustion. The Gravestone Doji often appears at market tops, making it a valuable indicator for those looking to anticipate shifts.
Understanding the psychology behind this pattern helps traders make informed decisions, especially in markets prone to overbought conditions.
Meaning:
Showing rejection of higher prices. Found in uptrends; signals potential bearish reversal if followed by selling activity.
BEARISH MARUBOZU
Bias: Bearish
What is the Bearish Marubozu pattern?
The Bearish Marubozu is a large, solid bearish candle without wicks, showing that sellers held control throughout the session. Found in downtrends, it signals strong bearish sentiment and suggests that the trend is likely to continue. The lack of wicks reflects consistent downward momentum without significant buyer support.
This pattern speaks about market psychology, offering traders insights into moments of intense selling pressure. Recognizing the Bearish Marubozu can help you align with prevailing trends and avoid buying into weakening markets
Meaning:
Showing strong selling pressure. Found in downtrends; signals continuation of the bearish trend or an intensifying sell-off.
👉 Up next: Double-candle formations – where price meets reaction.
Capturing Market Moves with the Special Candle SetupOverview
The Special Candle Setup Indicator has once again proven its effectiveness in detecting high-probability candlestick formations. In this chart, a bearish pattern was identified at the top, providing an early indication of a potential downside move. This setup allowed traders to position themselves accordingly, capturing the downward trend efficiently.
How It Worked Here
🔹 Precise Bearish Signal – The indicator detected a bearish pattern at a key resistance level, signaling a potential reversal.
🔹 Well-Defined Key Levels – The automatically plotted blue support line and green resistance line provided crucial reference points for trade management.
🔹 Trend Continuation Confirmation – The setup was followed by further bearish price action, validating the accuracy of the signal.
Key Takeaways
✅ Early Signal Accuracy – The indicator highlighted the reversal before the major drop, reinforcing its reliability.
✅ Multi-Market Application – These candlestick formations are not limited to expiry days; they are observed across crypto, forex, stocks, and indices.
✅ Customizable for Different Strategies – Users can enable or disable specific pattern types (bullish/bearish or reversal setups) based on their trading style.
Why This Matters?
Price action remains one of the most powerful trading tools, and this indicator helps traders automate pattern detection while integrating dynamic support and resistance levels for added confluence.

NIO: Important reaction at support level! But be careful - D & WNIO shares reached our first target of $9.22, set in our last public study, the link to which is below this analysis, as always.
We now see a correction down to the 21 EMA, which is to be expected, given that it has just hit a target. In addition, we see a reaction in the price, which could be a bottoming signal if confirmed. Such a reaction makes sense, since the medium-term trend on the daily chart is bullish, and the reasons are simple: 1) The price has been making HH/HL since its last bottom on December 12; 2) The price is above the 21 EMA, which is rising.
I said in my last analysis that swing trades with a focus on the medium term are technically plausible, and that's still true, but remember that all caution is needed, as the weekly chart is still in a downtrend, and this week's candlestick is a reminder of this.
If the price closes below the average on the weekly chart, we could see another top signal, suggesting further bearish continuation for NIO shares. In any case, I see $7 as the main support point, both in the long and medium term.
We see that NIO is trading around a critical point, near mid-term support levels and long-term resistance levels. Whichh one will prevail? It is too soon to tell, we need to see a clear breakout to confirm any thesis. I’ll keep you updated on this, so remember to follow me to keep in touch with my daily analysis, and support this idea, if it helped you.
All the best,
Nathan.

📊10 Candlestick Patterns You need To Know🔷 Bullish engulfing:
A candlestick pattern where a smaller bearish candle is followed by a larger bullish candle, indicating a potential reversal of a downtrend.
🔷 Bearish engulfing:
The opposite of a bullish engulfing pattern, where a smaller bullish candle is followed by a larger bearish candle, suggesting a potential reversal of an uptrend.
🔷Tweezer tops:
Two consecutive candlesticks with equal or near-equal high prices, indicating possible resistance and a potential reversal from an uptrend.
🔷Tweezer bottoms:
Similar to tweezer tops, but indicates support and a potential reversal from a downtrend.
🔷Bullish harami:
A bullish harami is a candlestick chart indicator used for spotting reversals in a bear trend. It is generally indicated by a small increase in price (signified by a white candle) that can be contained within the given equity's downward price movement (signified by black candles) from the past couple of days.
🔷Morning star:
A three-candle pattern consisting of a bearish candle, a small indecisive candle, and a bullish candle, indicating a potential reversal from a downtrend.
🔷Evening star:
The opposite of a morning star pattern, consisting of a bullish candle, a small indecisive candle, and a bearish candle, suggesting a potential reversal from an uptrend.
🔷Three white soldiers:
Three consecutive long bullish candles, typically seen as a strong bullish reversal pattern.
🔷Three black crows:
Three consecutive long bearish candles, often considered a bearish reversal pattern.
🔷Three inside up :
A bullish reversal pattern composed of a large down candle, a smaller up candle contained within the prior candle, and then another up candle that closes above the close of the second candle.
👤 @AlgoBuddy
📅 Daily Ideas about market update, psychology & indicators
❤️ If you appreciate our work, please like, comment and follow ❤️

🔋Candlestick Power📍Candlestick patterns are powerful tools used in technical analysis to analyze and predict price movements in financial markets, particularly in trading. They provide valuable insights into market sentiment and help traders make informed decisions. The open, close, and various components of a candlestick, such as the body and shadows, are crucial in determining whether it is bullish or bearish.
🔷A candlestick consists of a body and two shadows, also known as wicks or tails. The body represents the price range between the open and close of a trading period, while the shadows represent the high and low points reached during that period.
🔷A bullish candlestick occurs when the closing price is higher than the opening price, indicating buying pressure and market optimism. The body is typically filled or colored, indicating a bullish trend. The longer the body, the stronger the bullish sentiment. Shadows may exist above or below the body, and they represent the price range outside of the open and close. Long shadows indicate higher volatility during the trading period.
🔷A bearish candlestick forms when the closing price is lower than the opening price, reflecting selling pressure and market pessimism. The body is often empty or colored differently to indicate a bearish trend. Again, the length of the body provides information about the strength of the bearish sentiment. Shadows can be found above or below the body, representing the price range outside the open and close. Similar to bullish candles, long shadows suggest increased volatility.
Traders use different candlestick patterns and combinations to identify potential trend reversals, continuation patterns, or price consolidations. For example, a doji candlestick, where the open and close are very close or equal, signals indecision in the market and may precede a reversal. Engulfing patterns occur when one candle fully engulfs the body of the preceding candle, indicating a potential trend reversal. However, it is important to note that candlestick patterns should be used in conjunction with other technical indicators and fundamental analysis to confirm the validity of a potential trade signal.
👤 @AlgoBuddy
📅 Daily Ideas about market update, psychology & indicators
❤️ If you appreciate our work, please like, comment and follow ❤️

💥 Bullish VS Bearish Candlesticks📍Bullish and bearish candlestick patterns are technical analysis tools used by traders to identify potential market trends and reversals. Bullish patterns indicate a potential rise in the price of an asset, while bearish patterns indicate a potential decline in price.
🔷 Bullish candlestick patterns include the dragonfly doji, hammer, tweezer bottom, morning star engulfing and three white soldiers. These patterns suggest that buying pressure is increasing and that there may be a potential for a trend reversal.
🔷 Bearish candlestick patterns include the gravestone doji, inverted hammer, tweezer top three black crows and more. These patterns suggest that selling pressure is increasing and that there may be a potential for a trend reversal.
🔷When using candlestick patterns for trading, it's important to look for confluence with other signals, such as trend lines, support and resistance levels, and other technical indicators. Combining multiple signals can provide a stronger indication of potential market movements and help traders make more informed trading decisions.
🔷It's also important to note that candlestick patterns should not be relied on as the sole indicator for trading decisions, as they are not always accurate and can produce false signals. Traders should always use a combination of technical analysis tools and fundamental analysis when making trading decisions. This is why its important to create and monitor your own strategy and backtest what works and what doesn't.
👤 @AlgoBuddy
📅 Daily Ideas about market update, psychology & indicators
❤️ If you appreciate our work, please like, comment and follow ❤️

📊 The Doji Candle Pattern📍What is the Doji Candlestick Pattern?
The Doji Candlestick Pattern refers to a chart pattern consisting of a single candle. This pattern appears when the opening and closing prices of a candle are nearly the same or identical, resulting in a small-bodied candle with upper and lower wicks resembling a "+". Different variations of Doji patterns exist, with unique names like the Long-legged Doji, Gravestone Doji, Dragonfly Doji, and Doji star candlestick pattern. Regardless of the type, all Doji patterns provide traders with four critical data points: the open, close, high, and low prices for the given period. Doji patterns can occur on any timeframe and in any market, making them the foundation of many trading strategies
🔹Long-legged Doji
The Long-legged Doji pattern has an elongated upper and lower wick and a small body
The Long-legged Doji can be interpreted in several ways and works best when viewed in context with price action. It is a potential price reversal signal in a defined up or downtrend. If it occurs in a flat market, it suggests further consolidation.
🔹Dragonfly Doji
The Dragonfly Doji sets up when the candle’s open, close, and high is approximately the same. Visually, the Dragonfly looks like a “T,” as depicted in the image below. This formation suggests that heavy selling was present, but the market has rebounded. As a general rule, the Dragonfly is considered a reversal indicator. A retracement in price is expected when it occurs at the top of a bullish trend.
🔹Gravestone Doji
The Gravestone Doji pattern is the polar opposite of the Dragonfly; it appears as an inverted “T” and signals that heavy buying has given way to selling. The Gravestone Doji is a reversal chart pattern that signals downward or upward pressure may be on the way. The Gravestone suggests that a reversal is possible when observed within a defined uptrend. Within a downtrend, bullish price action may be forthcoming.
🔸Reversals
Doji candlesticks can be a great way to get in or out of the market in trending markets. The Gravestone and Dragonfly are ideal for reversal strategies as they indicate forthcoming upward and downward movements in price.
🔸Breakouts
One of the lowest-risk ways to utilize Dojis in the FX market is to trade breakouts. A breakout is a sudden directional move in price. Dojis often precede breakouts, as they are a signal of indecisiveness. As soon as the market makes up its mind, a significant move may be in the offing.
👤 @AlgoBuddy
📅 Daily Ideas about market update, psychology & indicators
❤️ If you appreciate our work, please like, comment and follow ❤️

🔎 A Look Inside The Candlestick Chart📍What Is a Candlestick?
The formation of the candle is essentially a plot of price over a period of time. For this reason, a one minute candle is a plot of the price fluctuation during a single minute of the trading day. The actual candle is just a visual record of that price action and all of the trading executions that occurred in one minute.
[b📍Who Discovered the Idea of Candlestick Patterns?
It is commonly believed that candlestick charts were invented by a Japanese rice futures trader from the 18th century. His name was Munehisa Honma.
Honma traded on the Dojima Rice Exchange of Osaka, considered to be the first formal futures exchange in history.
As the father of candlestick charting, Honma recognized the impact of human emotion on markets. Thus, he devised a system of charting that gave him an edge in understanding the ebb and flow of these emotions and their effect on rice future prices.
📉Bearish Candle
🔹 Open Price: A bearish candlestick forms when the opening price of a currency pair is higher than the closing price of the previous candlestick.
🔹 High and Low Price: During the candlestick's time frame, the price moves higher than the opening price and then declines to form a lower low than the previous candlestick.
🔹 Body: The body of the bearish candlestick is colored red and represents the difference between the opening and closing price. The longer the body of the candlestick, the stronger the bearish sentiment.
🔹 Upper Shadow: The upper shadow of the candlestick represents the highest price achieved during the candlestick's time frame. The longer the upper shadow, the greater the bearish pressure.
🔹 Lower Shadow: The lower shadow of the candlestick represents the lowest price achieved during the candlestick's time frame. The shorter the lower shadow, the stronger the bearish sentiment.
📈Bullish Candle
🔹 Open Price: A bullish candlestick forms when the opening price of a currency pair is lower than the closing price of the previous candlestick.
🔹 High and Low Price: During the candlestick's time frame, the price moves lower than the opening price and then rises to form a higher high than the previous candlestick.
🔹 Body: The body of the bullish candlestick is colored green and represents the difference between the opening and closing price. The longer the body of the candlestick, the stronger the bullish sentiment.
🔹 Upper Shadow: The upper shadow of the candlestick represents the highest price achieved during the candlestick's time frame. The shorter the upper shadow, the greater the bullish pressure.
🔹 Lower Shadow: The lower shadow of the candlestick represents the lowest price achieved during the candlestick's time frame. The longer the lower shadow, the greater the bullish sentiment.
👤 @AlgoBuddy
📅 Daily Ideas about market update, psychology & indicators
❤️ If you appreciate our work, please like, comment and follow ❤️

📊 Candlestick CheatsheetCandlestick charts are commonly used in trading to analyze market trends and make trading decisions. Candlesticks can be categorized as bullish or bearish, depending on whether the price has increased or decreased over a given period.
It is important to note that while candlestick patterns can be useful in predicting market movements, they should not be used in isolation, and other indicators and analysis should also be considered. It is also important to have a clear understanding of the market and its underlying fundamentals before making any trading decisions.
🔹 Rails
The rails pattern is a two-candlestick pattern that typically occurs during a downtrend. The first candle is a long red candle, followed by a long green candle that opens below the previous day's close but closes above it, creating a rail-like pattern.
🔹 Three White Soldiers
The three white soldiers pattern is a bullish pattern that consists of three consecutive long green candles with small or no wicks. It typically occurs after a downtrend and suggests a reversal in the market's direction.
🔹 Three Black Crows
The three black crows pattern is a bearish pattern that consists of three consecutive long red candles with small or no wicks. It typically occurs after an uptrend and suggests a reversal in the market's direction.
🔹 Mat Hold
The mat hold pattern is a five-candlestick pattern that occurs during a bullish trend. It consists of a long green candle, followed by three small candles with lower highs and higher lows, and ending with another long green candle.
🔹 Pinbar
The pinbar pattern is a single candlestick pattern that has a long tail or wick and a small body. The tail should be at least two times the length of the body. The pattern suggests a reversal in the market's direction.
🔹 Engulfing
The engulfing pattern is a two-candlestick pattern that occurs when the second candle's body completely engulfs the previous candle's body. A bullish engulfing pattern occurs during a downtrend and suggests a reversal in the market's direction, while a bearish engulfing pattern occurs during an uptrend and suggests a reversal in the market's direction.
🔹 Morning Star
The morning star pattern is a three-candlestick pattern that typically occurs after a downtrend. It consists of a long red candle, a small candle, and a long green candle, with the small candle gapping down from the previous day's close. The pattern suggests a reversal in the market's direction.
🔹 Evening Star
The evening star pattern is the opposite of the morning star pattern and typically occurs after an uptrend. It consists of a long green candle, a small candle, and a long red candle, with the small candle gapping up from the previous day's close. The pattern suggests a reversal in the market's direction.
👤 @algobuddy
📅 Daily Ideas about market update, psychology & indicators
❤️ If you appreciate our work, please like, comment and follow ❤️

SPX: Above an Inflection Point.• The SPX is trying to do a bullish reaction today, just above the key support level at 4,100;
• This reinforces our view that 4,100 is the most important support level for the index, and only if it loses, we would see a sharper correction;
• For now, the index maintains its bullish bias, and there’s no technical evidence pointing to a reversal;
• In theory, it’ll seek the 4,218 next, to fill the last gap;
• What’s more, if it breaks yesterday’s high, it’ll completely reject the bearish candlestick, confirming the bullish bias;
• I’ll keep you updated on this.
Remember to follow me to keep in touch with my daily analyses!

TSLA: About to CRASH again? Pay ATTENTION to these key points!• Yesterday, TSLA did a bullish candlestick pattern, a Harami, just above the support level at $110;
• This is the second Harami we see. Usually, Haramis aren’t strong reversal patterns, and even when they get triggered, they are poor performers. Unlike the previous one, this time the pattern wasn’t even triggered;
• This indicates that the trend is still bearish, and if TSLA loses the $110, the next technical support level is the $91 (blue line, weekly chart);
• Only if TSLA confirms a very good bullish reaction above the $110, we might see it bouncing again to higher levels. So far, no bullish reaction;
• The key point that could reverse the bearish sentiment, at least in the mid-term, is the $126 area. This would be the peak between the two valleys of this possible Double Bottom chart pattern in the daily chart;
• These are the main key points to watch on TSLA for now. I’ll keep you updated on this.
Remember to follow me to keep in touch with my daily analyses!

QQQ: Doing as expected, but be careful with this resistance!• QQQ did an Above the Stomach candlestick pattern just above the previous support at $268 (black line);
• This candlestick pattern was triggered, and QQQ is trading at its first technical target at the 21 ema;
• QQQ didn’t trigger the bullish candlestick pattern we mentioned last week, and the moment it lost the $275, it just went down to seek our next target at $268, and it hit it with astonishing precision before reacting again, as we expected. The link to my previous analysis is below this post;
• Now that it is near its 21 ema, we’ll see if this is a Dead Cat Bounce or a meaningful reversal sign;
• If it loses yesterday’s low, it’ll show some weakness and a bearish thesis will gain strength. However, by breaking the 21 ema, a mid-term reversal would have a first target at $307, to fill the first gap (yellow square);
• Either way, QQQ is about to do something interesting;
I’ll keep you guys updated on this. Remember to follow me for more analysis like this! Keep in touch.

Shooting Star Candlestick
What is the Shooting Star Pattern?
1. A shooting star is a type of candlestick pattern which forms when the price of the security opens, rises significantly, but then closes near the open price.
2. The distance between the highest price of the day and the opening price should be more than twice as large as the shooting star’s body.
What does Shooting Star tells you?
1. Shooting stars signals a potential downside reversal and is most effective when it forms after 2-3 consecutive rising candles having higher highs.
2. A shooting star opens and rises strongly during the trading session, showing the same buying pressure that is seen over the last trading sessions.
3. At the end of the trading session, the sellers push the price down near the open.
4. This shows that the buyers have lost control by the end of the day, and the sellers have taken over.
5. The long upper shadow indicates that the buyers are losing position as the price drops back to the open.
6. The candle after the shooting star gaps down and then moves lower on heavy volume.
7. This candle helps in confirming the price reversal and indicates that the price will continue to fall.
Trading Scenario
1. Trade Entry: Before you enter a shooting star trade, you should confirm that the prior trend is an active bullish trend.
2. Stop Loss: You should always try to use a stop-loss order when trading the shooting star candle pattern.
3. Taking Profits: The price target for this trade should be equal to the size of the shooting star pattern.
Limitations of Shooting Star
1. One should not only rely on a candle pattern like in a shooting star for making trading decisions.
2. This is why confirmation is required, one can confirm by the next candle or other technical analysis indicators.
3. One should also use stop losses when using candlesticks to control the losses.
4. A candlestick pattern is more significant when it occurs near an important level signaled by other forms of technical analysis.

Spot Crude Long 7-14-2022As I had mentioned earlier, this market is trading within a descending triangle and I was waiting for the daily close to decide if I was going to enter or not. Well, today's candle close was a long-tailed doji rejecting support. I am now long and looking for a potential move up to triangle resistance (about 120.000). Other important levels are 105.000 and 115.000.

Spot Crude Analysis 7-14-2022In spite of the majority of the markets getting smashed, Crude seems to be holding up pretty well. Here on the daily time frame we see a descending triangle and price is testing support for the third time. I'll be watching the candle close today to confirm a potential entry long. Potential targets to the upside would be 105, 115 and 120 (which corresponds to triangle resistance).

USDJPY (late post)This market has been in a strong uptrend and has recently broken out of an ascending triangle. Price has retested the breakout area and old resistance is now new support. I got long earlier this morning with my stop below yesterday's low.

SugarSugar has been trading within a large rising channel for almost a year. After recently testing and confirming channel support, price has rebounded and we're just about halfway up the channel. A falling window (gap down) served as resistance on the way down to support and has also temporary stalled the current rally.
Now, after a strong daily close above the falling window we are currently testing old resistance as new support. I'm now long and looking to take a small piece out of this market as price moves towards channel resistance.

Short or long idea The daily candle just closed and sellers are back so I’m looking for a short under 28,627
If we don’t short and try to go long I’ll look to long above 30,697
I will only risk 1% of my account value if we get these price points to make 3%

Two types of Candlestick Patterns that you need to make moneyIn this video, I explained in detail the two most important candlestick patterns that you will ever need to make money from the financial market consistently.

GBP/JPY BuysThis pair has had little in terms of high volume price movements during yesterday's London and NY session
We have since had some higher highs and higher lows forming on the 30min timeframe which has confirmed bullish indications
with this is mind, I opted to enter buys once support had formed and the London session had opened
Stop-loss set below the previous candles lower wick so that I am removed from the position should the technicals invalidate themselves
Targets are set at a significant daily resistance region

What are the candlesticks?Candlesticks are a way to express visually the size of the price movement.
There are different colors used for the candlesticks, but in pairs of 2: one color for an uptrend (usually marked in green) and one for a downtrend (usually marked in red).
Candlesticks are placed in graphics and by their movements create patterns. Starting from those patterns traders decide on a possible future pattern: where will/can the price go from now, based on the previous movements of the price.
On any chart, you can use more ways to see the price of an asset:
1. Candles - full candles (usually red or green)
2. Hollow candles - a full candle for a candle that show a downtrend (usually red) and an empty one for an uptrend (usually green and used only on the edges)
3. Bar
4. Line
5. Mountain
The main advantage of the candles is that they are more visual. In other words, you can see faster what is going on in your chart.
Why usually red or green?
The candles are said to show the emotions, so:
Red when something is not good
Green when something is loved/liked
Why do most people use the candles system?
The main advantage is that in any time frame you can see these prices:
1. Open price
2. Close price
3. High price
4. Low price
What are time frames?
There are many time frames: 1, 5, 10, 30 minutes / 1, 4 hours / 1 day / 1 week.
For any time frame chosen by the trader the pattern of the candles changes.
Depending on what you want to do (invest short, medium or long term) you look at different patterns/timeframes that the candles made.
The body of the candle represents the price range between a determined timeframe.
If the candle is red - the price is lower than 5 minutes ago (where 5 minutes is the selected timeframe)
If the candle is green - the price is higher than 5 minutes ago (where 5 minutes is the selected timeframe)
Sometimes the candle looks like a cross (the body for the candle is missing). That means that the opening and close prices are the same.
Any candle has 2 wicks or “shadows”:
1. Up - representing the maximum price
2. Down - representing the minimum price
There are bigger and smaller candles. Why?
The bigger the candle the bigger the price movement.
The smaller the candle the smaller the price movement.
If the up wicks are smaller it shows that the price closed near the maximum price of that timeframe. The same is valid for a down wick.
If the down wicks are bigger it shows that the price closed far from the minimum price of that time frame. The same is valid for an upper wick.
