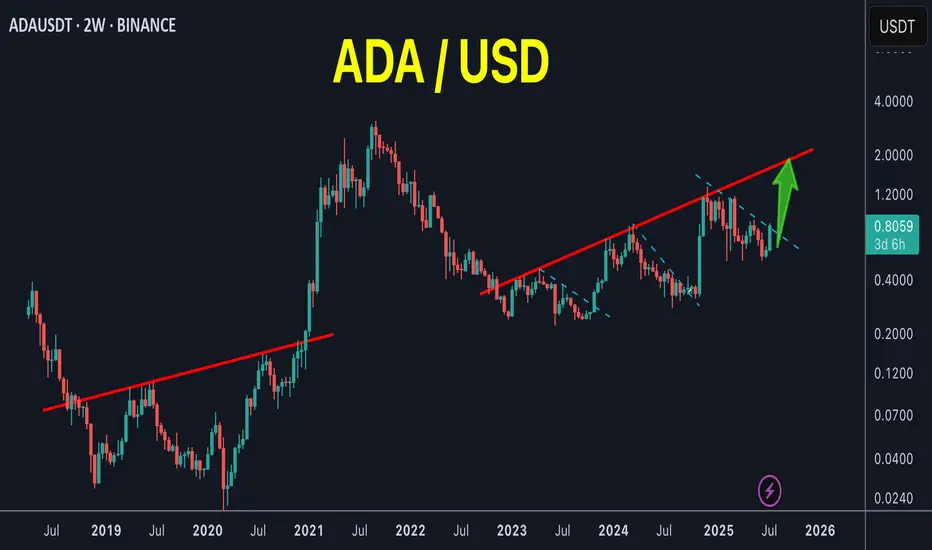
CARDANO | ADA Creeping UP to $1Cardano has made a big move in recent weeks, boasting a 77% increase.
If you were lucky enough to buy in around 30 or 40c, this may be a great TP zone:
Looking at the Technical Indicator (moving averages), we can see the price makes its parabolic increases ABOVE - which is exactly where we are currently beginning to trade. This could mean more upside is likely, and the 1$ zone is a big psychological resistance zone:
A continuation of the current correction may look something like this for the next few weeks:
_____________________
BINANCE:ADAUSDT
Cardano
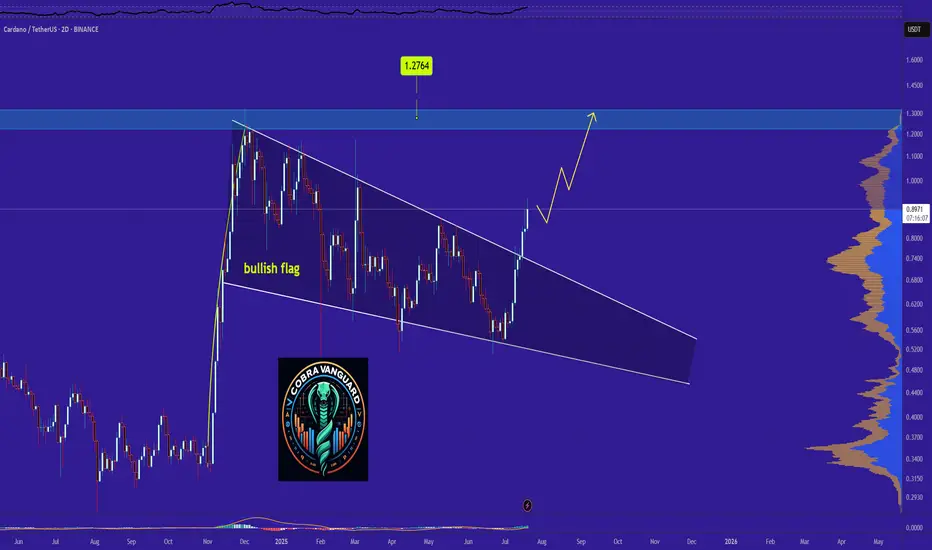
ADA - Time to buy again! (Update)The pattern has broken, and now I expect the price to rise to $1.20 . AB=CD.
Give me some energy !!
✨We spend hours finding potential opportunities and writing useful ideas, we would be happy if you support us.
Best regards CobraVanguard.💚
_ _ _ _ __ _ _ _ _ _ _ _ _ _ _ _ _ _ _ _ _ _ _ _ _ _ _ _ _ _ _ _
✅Thank you, and for more ideas, hit ❤️Like❤️ and 🌟Follow🌟!
⚠️Things can change...
The markets are always changing and even with all these signals, the market changes tend to be strong and fast!!

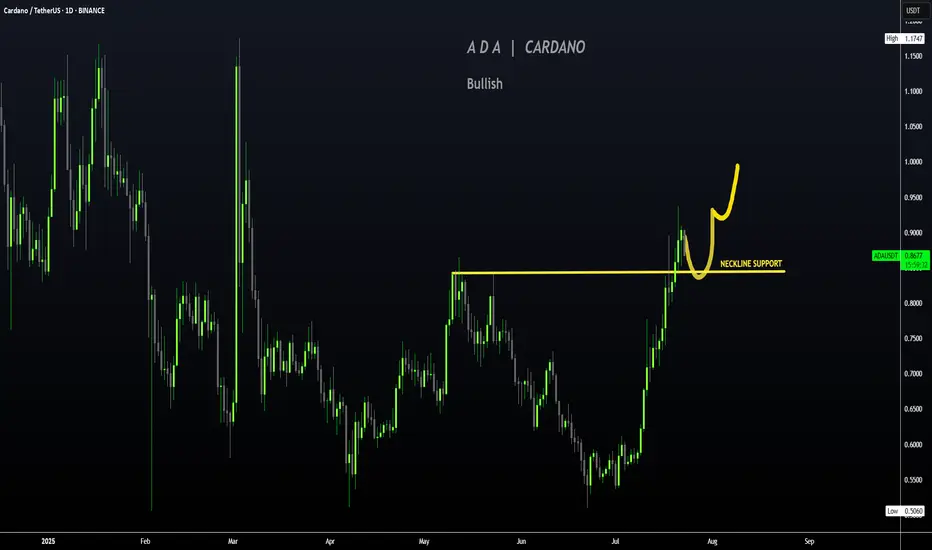
Cardano Update · Wait For New ATH Before Selling · Chart BullishI am using 3D candles. The last session is a Doji on ADAUSDT. There was a red session followed by a continuation with prices moving lower. That's last session, but it—the Doji—ended up closing green.
Sellers started to put pressure on the market and pushed prices lower (red day), by the next session, all selling was bought (Doji) and now ADAUSDT is back above 0.382 Fib. extension (0.8194). This is a bullish setup based on candlestick reading.
From here on ADAUSDT can grow to produce a higher high as long as it trades above this Fib. level, the continuation of the bullish move that started 21-June. So we had a small retrace and the action is recovering, right before bullish momentum grows, which means that this is a good setup to go LONG. It seems some positive event will develop soon and this will create a major wave, a major advance here and Cardano will see the highest prices in more than four years.
It can take a few days, not much longer; everything is pointing higher.
Here it is also wise to avoid selling too early. When we consider Cardano's potential for growth beyond $7, easily, we have to avoid paying attention to the temptation to sell when prices are still too low, the rise is only starting. It is ok to sell at major resistance levels if you have experience because there is always a stop before additional growth. If one is very active, it is easy to sell some at resistance and then buy more at support. But the easiest way is to buy and hold. If the entire bullish wave is set to produce 500%, this is always more than good enough so it is easy to hold thinking of the long-term.
We continue within the accumulation phase. While many pairs are already advanced and while prices are definitely growing, this is not it yet; things are about to go wild and it is better to be fully invested before the event. Everything Crypto. Buy Crypto. Hold Crypto. We are going up.
Namaste.
ATH for ADA soonChart says it all, ADA looks prime to run, could reach as high as $6.80
1. Technological Upgrades and Hard ForksThe Plomin Hard Fork in Q1 2025 enhanced governance, while upcoming features like Leios for scalability, BTC DeFi interoperability, L2s, and partnerchains boost efficiency and adoption, positioning Cardano as a leader in secure, sustainable blockchain tech.
2. Spot ETF Speculation and Institutional InterestGrayscale's pending ADA ETF filing with Nasdaq, plus inclusion in their Large Cap ETF, could unlock massive demand. Analysts see this as a game-changer, similar to Bitcoin/ETH ETFs, potentially driving prices to $5+ by year-end.
3. Ecosystem Expansion and IntegrationsNew tools like the EMURGO global Cardano card for ADA payments, Blockchain.com DeFi wallet integration (37M users), and Tokeo Wallet's XRP bridge enhance real-world utility. DeFi TVL and on-chain activity (unique addresses +4.79%, active wallets +12%) are surging.
4. Whale Activity and On-Chain MomentumWhales are accumulating amid spikes in network volume and no downtimes/hacks. Features like privacy via Midnight Network and Charles Hoskinson's White House advisory role add credibility, fueling a "silent surge."
5. Technical Breakouts and Market CorrelationADA has formed bullish patterns like a golden cross, double-bottom, and breakout from descending channels, correlating with Bitcoin's rally. RSI at 76 signals strong momentum, with targets at $0.82–$1.18 short-term and up to $2.80+ long-term.
6. Airdrops and Community HypeUpcoming events like the Glacier airdrop and NIGHT airdrop are creating buzz, alongside Cardano's unmatched decentralization and energy efficiency, potentially sparking a 383% rally as in past cycles.

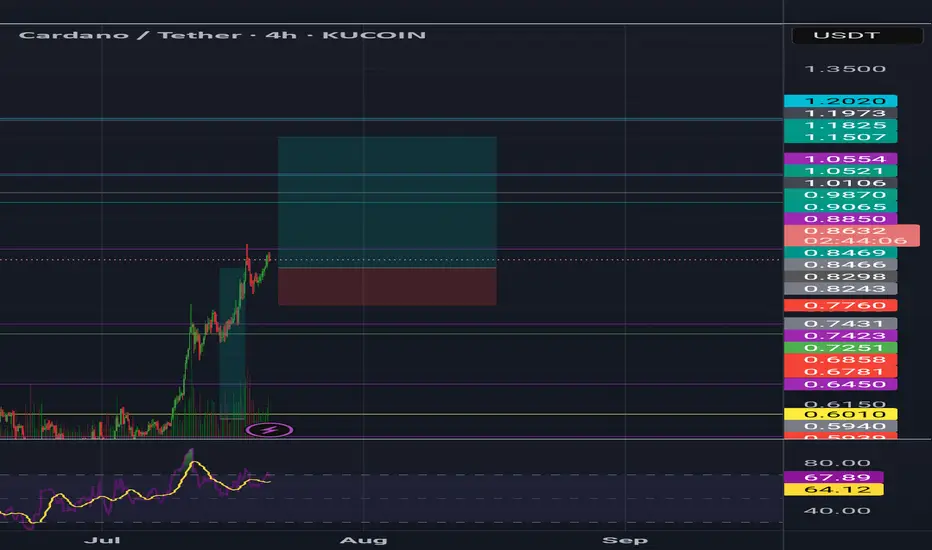
ADAUSDT Breaks Long-Term Downtrend – Critical Support Retest!The ADAUSDT pair is showing a compelling technical setup. The price has successfully broken out of a long-term descending trendline (yellow line) that had been acting as dynamic resistance since late 2024. This breakout came with strong momentum, signaling a potential shift from a bearish trend to a bullish reversal.
After the breakout, price managed to rally up to minor resistance around $0.90, but is now pulling back and retesting the key support zone (highlighted yellow box) — a previous strong resistance area now potentially flipping into support.
---
🟢 Bullish Scenario:
If the price holds above the $0.80 - $0.83 support zone, the break-and-retest structure will be validated.
A successful bounce from this area could push ADA back toward:
$0.90 (current minor resistance)
$1.13 (psychological and horizontal resistance)
$1.23 (previous supply zone)
$1.32 (recent local high)
A confirmed bullish continuation will be more convincing if the price forms a higher low and breaks above $0.90 with strong volume.
---
🔴 Bearish Scenario:
If ADA fails to hold the $0.8281 support and falls back below the descending trendline, then:
It may re-enter the previous range and test lower support around $0.75 or even $0.65.
This would suggest a potential false breakout and return to bearish territory.
Watch for bearish candlestick confirmations below $0.80 as an early warning.
---
📌 Pattern Insights:
Descending Trendline Breakout: Suggests a possible long-term trend reversal.
Break & Retest Structure: Price is currently testing the previous resistance zone as new support.
Layered Resistance Zones: Several clear resistance levels above provide logical targets for a bullish rally.
---
📊 Conclusion:
ADAUSDT has printed an early signal of a bullish reversal by breaking out of a long-standing downtrend. However, the sustainability of this trend depends heavily on the ability of price to hold the $0.80 - $0.83 support zone. Look for bullish confirmation candles in this area for a safer long entry.
#ADAUSDT #Cardano #CryptoBreakout #TechnicalAnalysis #Altcoins #BreakoutSetup #BullishRetest #CryptoChart #SupportAndResistance #PriceAction #TrendReversal

Cardano has successfully completed retesting ┆ HolderStatBINANCE:ADAUSDT is trading inside a symmetrical triangle near support at $0.445. Price continues to coil tightly with lower highs and higher lows, building pressure. A breakout above $0.465 would confirm bullish momentum toward the $0.49–0.50 zone. Key support remains intact and buyers are stepping in at every dip. A major move looks imminent.

ADA Cardano Decsending Triangle Use Caution HereCardano had a heck of a move but i think its going to erase most if not all of it before it goes on its next leg up. A break over the overhead resistance line and finding support above would invalidate this. Not financial advice just my opinion. Thank you
Cardano held above $0.76 ┆ HolderStatBINANCE:ADAUSDT is compressing under $0.44 with support from $0.418. Breakout from wedge structure may target $0.462. If $0.418 breaks, downside risk opens to $0.40. Watch for volatility.
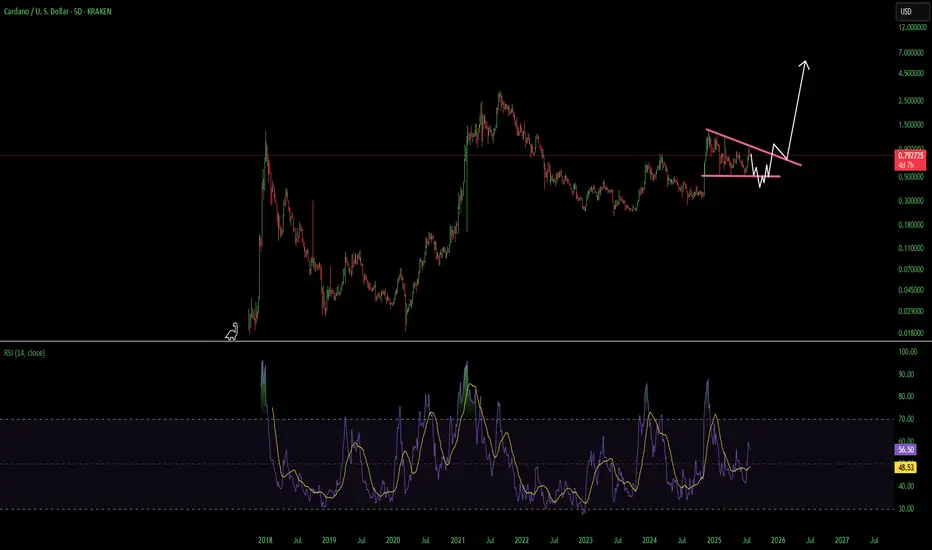
ADA/USDT | Multi-Month Breakout Brewing — a 10x play ?Cardano is quietly mirroring its previous macro cycle — but this time, the structure looks tighter, cleaner, and potentially more explosive.
The multi-month chart reveals a consistent uptrend forming off the 2022 lows, contained within a well-respected ascending channel. The price action shows strong similarities to the 2018–2020 accumulation phase, followed by the breakout that led ADA to its all-time high in 2021.
The current price structure is forming higher highs and higher lows within a channel — a strong bullish continuation pattern.
Volume has been increasing steadily during the up-moves, signaling real demand building underneath.
Fibonacci Extensions from the previous cycle highs and lows show key long-term resistance zones:
1.618 – $4.91
2.618 – $7.79
4.236 – $12.47
These levels could act as major psychological targets if the trend continues to evolve similarly to the last cycle.
⏳ Current Price (~$0.64) is still significantly below previous all-time highs and long-term extension zones — offering a potentially favorable risk/reward setup for patient investors.
⚠️ As always, nothing moves in a straight line — but if you're a macro-mind investor, you’ll start to notice more straight lines than most. Zooming out often reveals the patterns that noise hides.

CardanoAda usdt Daily analysis
Time frame daily
Risk rewards ratio >3 👈👌
Double bottom pattern has been created

CardanoAda usdt Daily analysis
Time frame 4hours
Risk rewards ratio >4.3
Target =1.15$
Cardano is the Valuable asset in crypto market
Cardano Has Plenty of Room To Grow · Will Hit Beyond $4 EasilyCardano's all-time high is $3.10. Cardano is currently trading at $0.82. Pause. You will be a genius when ADA is trading at $4 if you decide to buy below $1. It is not too late. This is only the start.
Good afternoon my fellow Cryptocurrency trader, how are you feeling in this wonderful day?
The first major advance for Cardano after the last bull market happened November 2024 and peaked December; we are still getting out of the consolidation that followed the correction of this bullish wave.
Only now Cardano is breaking a sideways channel and still trades below its December 2024 peak. Bitcoin is trading at a new all-time high and is preparing for a major move above $130,000. XRP is trading at a new all-time high and is not dropping. Ethereum is very close to a new all-time high and will certainly continue to grow, only days away. Cardano still has to break its March 2025 high, its December 2024 high; this is not bad, it only means that is still early for this amazing pair.
A bullish advance started 8-July and lasted only 13 days. We are seeing a small retrace now, three days with only one day red. Cardano will recover and continue growing. This growth will not be exhausted in a matter of weeks, it will go for months. Cardano has to grow straight up, daily, weekly, for a prolonged period of time to move beyond $4. But $4 is not the top, $7 and $8 are also possible.
The reason why the action might seen slow, is because this is only the start. Give it time, the market is giving us an opportunity to join. The market is giving everybody the opportunity to buy Cardano while prices are still low. You know how Crypto operates. When it starts moving, it goes so strong and so fast that there is no time to react. Act now and you will reap the reward.
The bullish cycle is confirmed. Just look around, what do you see?
Our sisters and cousins are rising. Our young children are growing; Crypto is going up.
Cardano is one of the main projects in this market and it will not stay behind. You will not be disappointed, you will be happy with the results.
Namaste.
HolderStat┆ADAUSD broke through the resistanceBINANCE:ADAUSDT is trading just below $0.406 after bouncing from $0.386. The setup favors a breakout if resistance is breached. Price structure remains bullish while above $0.386.

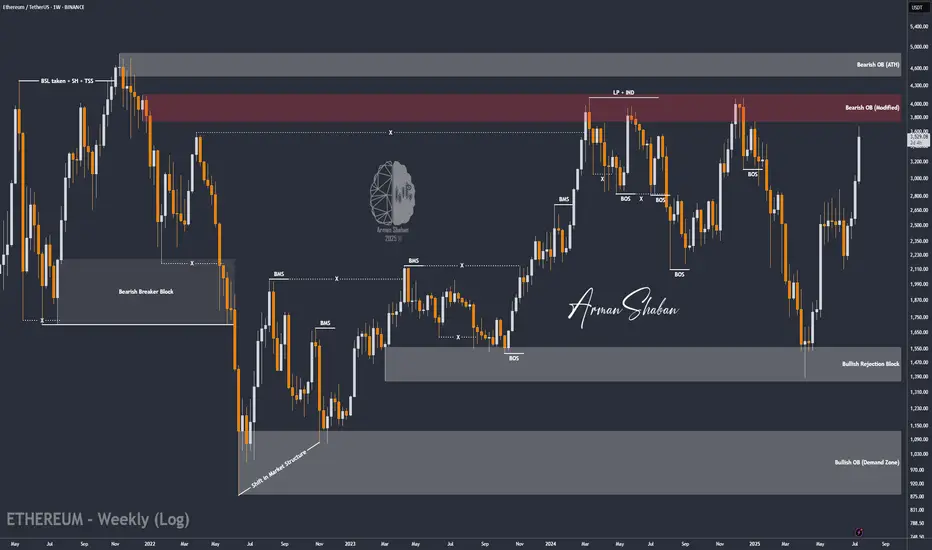
ETH/USDT | The Next Target is $4000 and it's Close! (READ)By analyzing the Ethereum chart on the weekly timeframe, we can see that this cryptocurrency remains one of the strongest major cryptos in the market, continuing its bullish rally despite the overall market correction. It has already hit the next target at $3500, and I believe we might see Ethereum reaching $4000 sooner than expected! Based on previous analyses, if this bullish momentum continues, the next targets will be $3740, $4100, and $4470.
Please support me with your likes and comments to motivate me to share more analysis with you and share your opinion about the possible trend of this chart with me !
Best Regards , Arman Shaban
ADA (repeat the pattern)ADA /USDT
ADA keeps repeating its old patterns as it’s clearly obvious in my chart
Breakout is going on lower time frames
Looks like an easy 2X
Why ADA Remains Bullish and Its Next Potential Move !The pattern has broken, and now I expect the price to rise to $1.27 . AB=CD.
Give me some energy !!
✨We spend hours finding potential opportunities and writing useful ideas, we would be happy if you support us.
Best regards CobraVanguard.💚
_ _ _ _ __ _ _ _ _ _ _ _ _ _ _ _ _ _ _ _ _ _ _ _ _ _ _ _ _ _ _ _
✅Thank you, and for more ideas, hit ❤️Like❤️ and 🌟Follow🌟!
⚠️Things can change...
The markets are always changing and even with all these signals, the market changes tend to be strong and fast!!
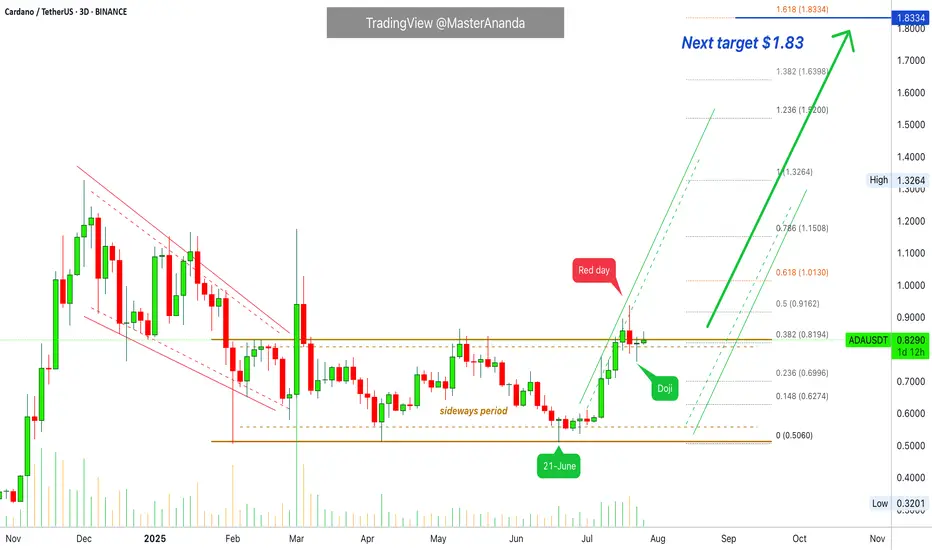
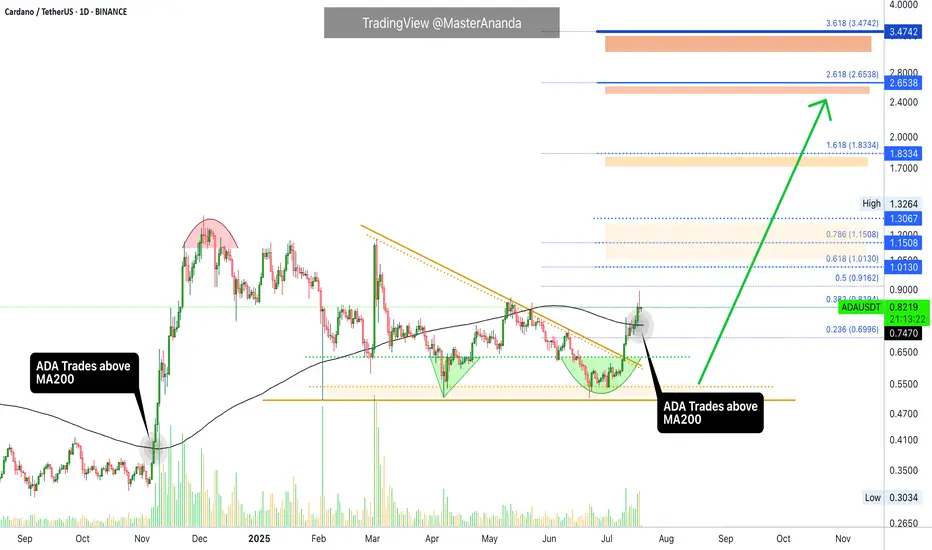
Cardano Update · Straight Up · New ATH & MoreCardano is easy to predict. We already have three great examples. Remember Bitcoin Cash? It has been growing straight up for 100+ days. Cardano will do the same. What about XRP? It is already trading at new all-time highs and Cardano is in the same group/category; big market capitalization. Then we have Ethereum which is the most recent example, as predicted, it is moving straight up. No retrace nor correction which is normal because it went sideways for months before the current bullish breakout.
Cardano has now four green weeks and this is the fifth one. This one will not be red which means straight up.
Technical analysis
I already told you about EMA55 and EMA89, weekly timeframe, ADA is trading above. MA200 as well. Notice the descending triangle on this chart. This was the consolidation period and it already broke bullish.
Targets & new all-time high
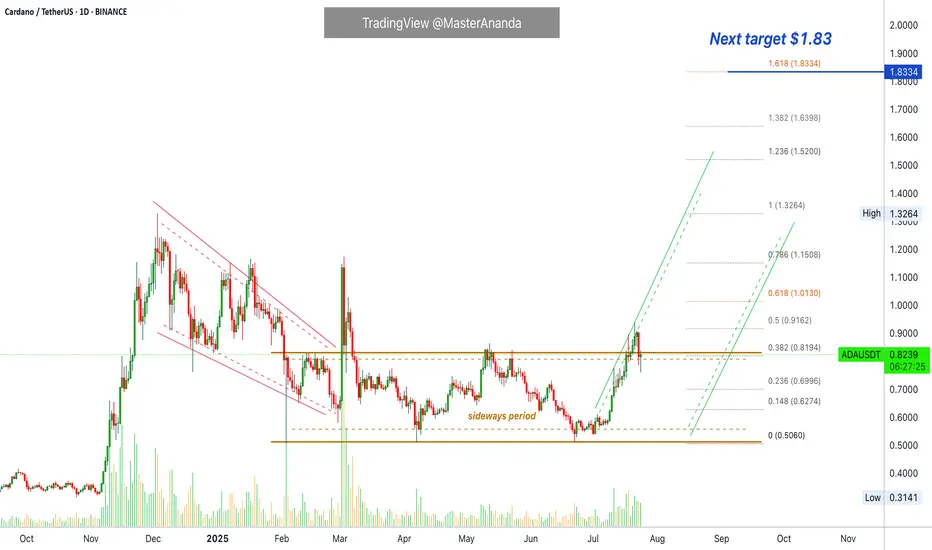
Expect ADA to continue growing until it hits the highest prices since 2021. $1.83 and beyond. Once this level is conquered, we can start rooting for a new all-time and this will happen with a high level of certainty.
Cardano will easily reach $3 and move beyond $4. I think it can go much higher...
I will do a new publication with updated new all-time high projections. The targets above are valid for the coming months.
Just a friendly update.
And thank you for your continued support.
(If you enjoyed this post, follow!)
Namaste.

DOGE/USDT : eyes More Gains – Mid-Term Targets Up to $0.70! By analyzing the Dogecoin chart on the daily timeframe, we can see that since our last analysis around 7–8 months ago, the price started its rally from $0.10 and surged over 370% to reach $0.48. After that, it corrected back to around $0.13 and is currently trading near $0.27. If Dogecoin manages to hold above $0.25, we can expect further upside movement in the mid-term. The next targets are $0.287, $0.32, $0.41, and $0.70.
Please support me with your likes and comments to motivate me to share more analysis with you and share your opinion about the possible trend of this chart with me !
Best Regards , Arman Shaban

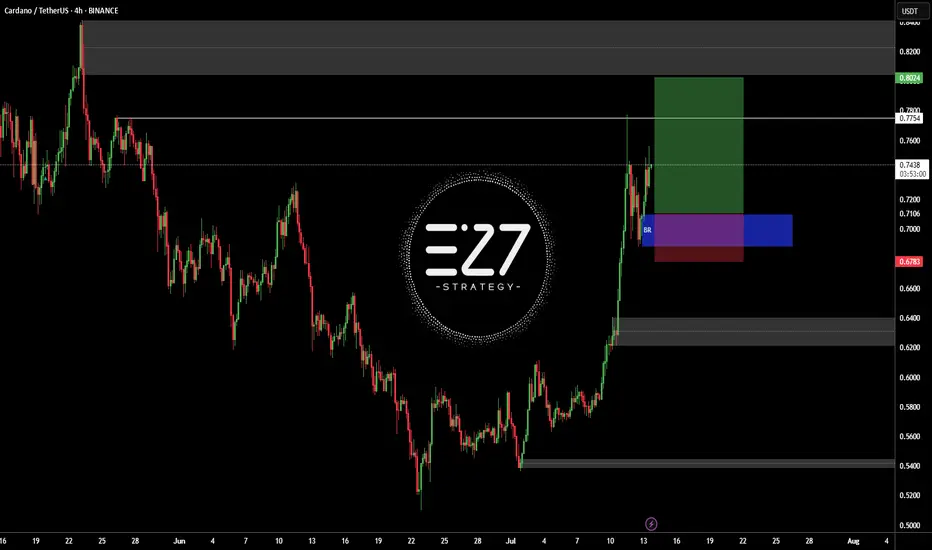
ADAUSDTBINANCE:ADAUSDT in up-trend and my open position buy in latest sowing low.
Best entry: 0.6952 - 0.7259
Target: 0.7754 - 0.8024
Stop loss: 0.678
Please control RISK management
Cardano Update · What Happens Now?I am going to assume that you read the XRP update I just published. While these are different pairs, my updates and publications are all related because I look at the entire market—for you—as a unit.
The situation with Cardano is different to XRP. Why? Because XRP already broke its previous bullish wave high while Cardano hasn't. This first tells us that Cardano has more room for growth and has less risk from a buyers standpoint. It can also be seen as Cardano being weaker or lagging behind in someway but I wouldn't give credit to this interpretation. The truth is that the market moves in unison but not at the exact same time.
May's high, reached first from the 7-April bottom, has been challenged but confirmed as resistance. This won't last long. It has been confirmed as resistance and we can easily see it by yesterday's red candle. This is normal. If you look at 14-July and 12-July, these days were also red yet Cardano continued growing. You can expect the same.
We can have one day red, two red days, three red days and nothing changes. The market is set to grow, is growing and will continue to grow in the coming weeks and months. Long-term growth and even beyond months. There is the possibility of growth extending to years similar to Bitcoin.
When a huge wave develops, we get a half year strong correction, a major higher low compared to the start of the phase followed by additional growth.
Let's get back to today and what is happening now.
ADAUSDT managed to break above MA200 16-July, just three days ago. This confirms a long-term growth process; it is now confirmed. This means that Cardano is on track to grow for 3-6 months minimum.
What we are seeing now is only the start of a major advance and the continuation—on a long-term basis—of the move that started in late 2024.
You can rest easy, sleep easy while you watch your profits grow. Cardano will continue growing, it will do great; you have my word.
Thank you for reading.
If you enjoy the content leave a comment just for this one, I will be sharing updates for you now, today, yesterday, tomorrow and for years to come.
Namaste.
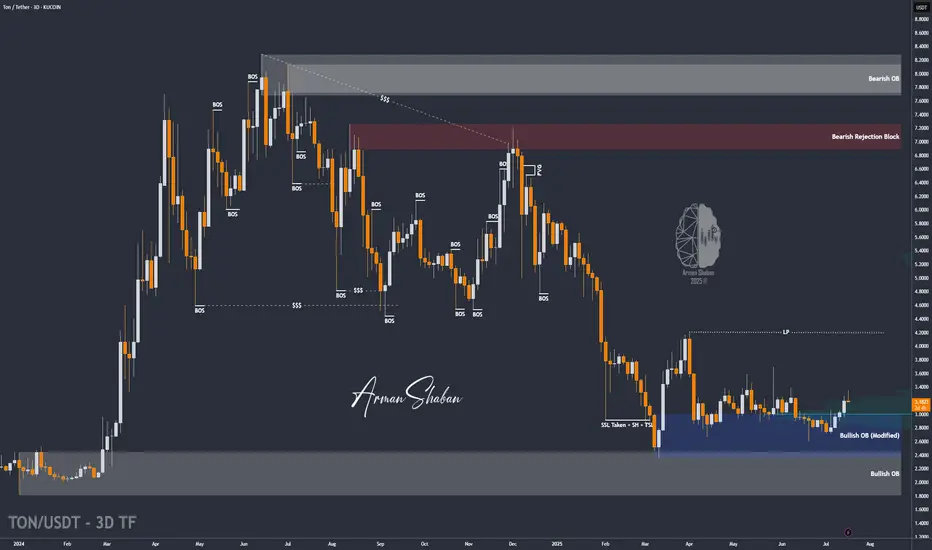
TON/USDT | Another Bullish Move Ahead? (READ THE CAPTION)By analyzing the Toncoin chart on the 3-day timeframe, we can see that, as per yesterday’s analysis, the price climbed to $3.36 before facing a slight correction — which is perfectly normal since every strong bullish trend needs a healthy pullback. The $3.05–$3.20 zone could serve as a good accumulation area for buyers, and we may soon witness another impressive rally from Toncoin! Based on the previous analysis, the next targets are $3.63, $4.20, and $4.68.
Please support me with your likes and comments to motivate me to share more analysis with you and share your opinion about the possible trend of this chart with me !
Best Regards , Arman Shaban
ADA/USDT | BIG Bullish Move Ahead! (READ THE CAPTION)By analyzing the Cardano chart on the 3-day timeframe, we can see that, as expected, the price continued its rally, reaching $0.89 before collecting liquidity above the $0.86 level and then facing a correction. Currently trading around $0.81, we expect the bullish trend to continue after this minor pullback. Key demand zones are at $0.78, $0.69, and $0.61. Based on the previous analysis, the next short- to mid-term bullish targets are $0.93, $1.05, and $1.33.
Please support me with your likes and comments to motivate me to share more analysis with you and share your opinion about the possible trend of this chart with me !
Best Regards , Arman Shaban

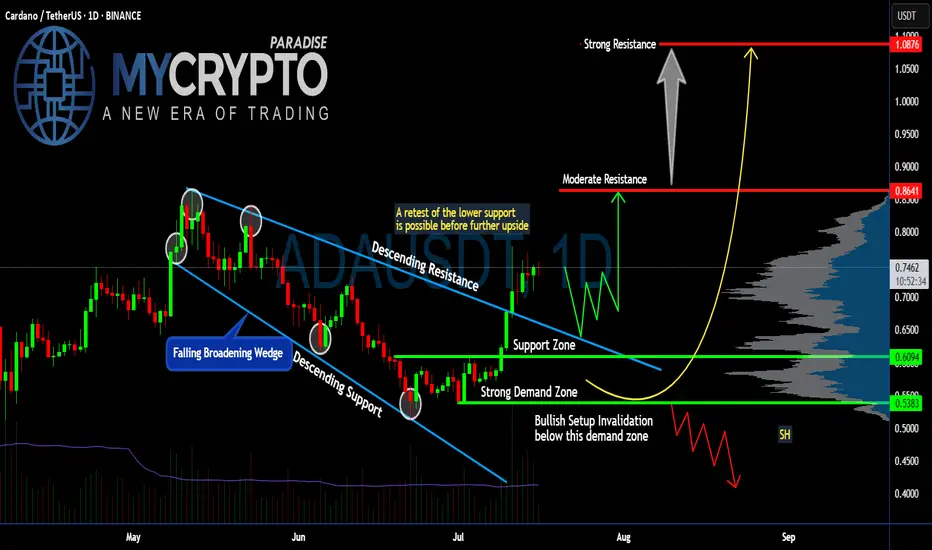
Is #ADA Ready For a Major Move or a Trap is Ahead? Watch this Yello, Paradisers! Is this breakout on #Cardano the start of a major upside move or just another bull trap waiting to flush out impatient traders? Let’s break down the latest #ADAUSDT setup:
💎After weeks inside a falling broadening wedge, #ADA finally broke above the descending resistance, signaling a potential trend reversal. The breakout above $0.70 has pushed the price toward the current $0.74 zone. The soaring volume and a positive broader market outlook reinforce our bullish bias. While this looks bullish, the key question is whether #ADAUSD will hold above its reclaimed support or retest lower levels first.
💎The structure is straightforward: #ADA reclaimed the support zone around $0.70 after bouncing strongly from the demand zone near $0.61–$0.60. This demand zone remains the critical area to watch—any healthy retest here would provide a high-probability continuation setup for bulls.
💎If buyers maintain control, the first target sits at the moderate resistance of $0.86. That’s where the next notable selling pressure is expected. But the real battle will take place near the strong resistance at $1.08—a zone where major distribution and profit-taking could occur.
💎However, the bullish setup becomes invalid if #ADAUSD loses the $0.61–$0.60 demand zone. A confirmed close below $0.538 would flip the structure bearish, signaling a potential continuation to lower lows.
Stay patient, Paradisers. Let the breakout confirm, and only then do we strike with conviction.
MyCryptoParadise
iFeel the success🌴