HolderStat┆ADAUSD above the $0.72 levelCRYPTOCAP:ADA broke the falling channel, replaced by a higher-low structure; consolidation near 0.75 sits atop trendline support. Maintaining 0.65 keeps bulls in control for a push toward the 0.90 resistance band flagged above.
Cardano

Cardano 5X Lev. Full PREMIUM Trade-Numbers (PP: 2110%)I want to share a trade setup that looks really good. It has relatively low risk with a very high potential for reward. The low risk is not based on the amount of leverage but the chart itself.
Notice the low 3-Feb., there is a higher low 7-Apr.
If you can open a position that is safe above the 3-Feb. low, then this would a low risk position and can work for the long-term.
The falling wedge pattern and the two green candles are also great. The previous session and the current active session.
Since we already looked at Cardano in detail, let's focus on the full trade-numbers for this chart setup. Most of the targets should hit within months.
_____
LONG ADAUSDT
Lev: 5X
Current price: $0.6637
Entry levels:
1) $0.6800
2) $0.6300
3) $0.6000
4) $0.5710
Targets:
1) $0.7000
2) $0.8213
3) $1.0130
5) $1.1508
9) $1.8300
12) $2.6500
13) $3.4620
Stop-loss:
Close weekly below $0.5600
Potential profits: 2110%
Capital allocation: 5%
_____
This chart setup can also be approached with 3X since it is already moving.
The amount of leverage you use will depend on your own risk tolerance.
Leveraged trading is high risk. High potential for rewards but also very high risk. This is a game not for kids. This is for adults. Mistakes can result in a major loss. Good decisions can result in big gains.
If you enjoy the content, consider hitting follow and leaving a comment.
Boost also to show your support.
Thank you for reading.
You are appreciated.
Your support is appreciated.
I am here working for you for the long-term.
Namaste.

Cardano Explosive Move Ahead?The daily chart for ADA/USDT shows that Cardano is still trading within a clear descending channel, facing consistent resistance near the upper trendline. Recently, the price was rejected from a key resistance zone Green between $0.8140 and $0.8416. Despite several attempts, ADA has struggled to break above this level, reinforcing the bearish outlook. Strong support lies between $0.5408 and $0.5696 in Yellow, which previously held during a sharp decline in April. Unless ADA breaks above the descending trendline and holds above the Green zone resistance with strong volume, the downside risk remains, with potential for a retest of lower support levels.

ONLY WAY IS UP - SUNDAEHear me now, the only way is up for SUNDAE. May drop down to the .004cent range but that will be a perfect buying opportunity.
- current market cap is 12million
- current TVL is 14.3million
- Sundae Labs is already familiar with Hydra (which is under construction) but would drastically reduce fees and increase transaction speed
- Governance to come
- Reduced fees for SUNDAE holders to come
SUPER UNDERVALUED. This will likely be a 200million DEX at minimum during the next bull run

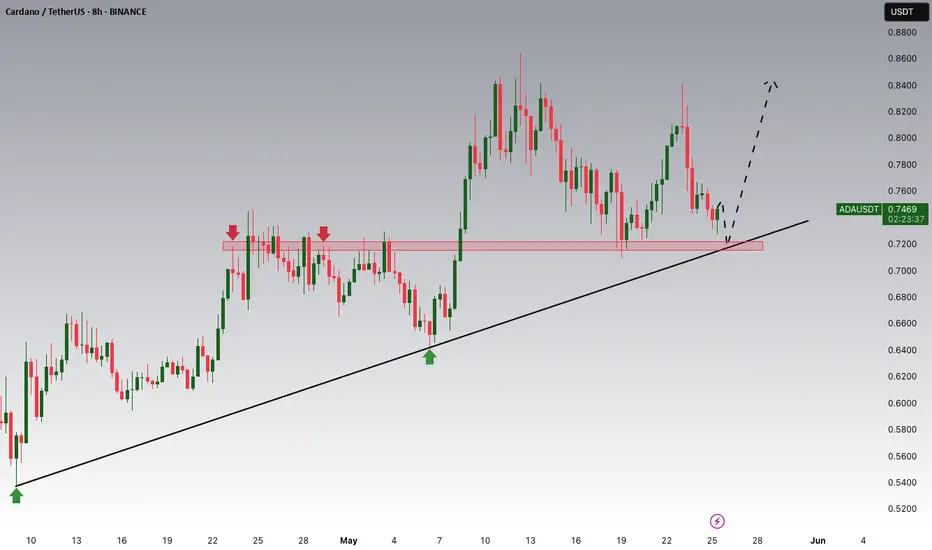
Cardano Potential UpsidesHey Traders, in today's trading session we are monitoring ADA/USDT for a buying opportunity around 0.7200 zone, Cardano is trading in an uptrend and currently is in a correction phase in which it is approaching the trend at 0.72000 support and resistance area.
Trade safe, Joe.
ADA - Time to buy again!The pattern has broken, and now I expect the price to rise to $0.93 . AB=CD.
Give me some energy !!
✨We spend hours finding potential opportunities and writing useful ideas, we would be happy if you support us.
Best regards CobraVanguard.💚
_ _ _ _ __ _ _ _ _ _ _ _ _ _ _ _ _ _ _ _ _ _ _ _ _ _ _ _ _ _ _ _
✅Thank you, and for more ideas, hit ❤️Like❤️ and 🌟Follow🌟!
⚠️Things can change...
The markets are always changing and even with all these signals, the market changes tend to be strong and fast!!

HolderStat┆ADAUSD Cardano’s ascending revivalCRYPTOCAP:ADA — Big falling wedge flipped to upside; price stair-steps through consolidation clusters along an accelerating support beam. Holding 0.78-0.80 keeps 0.90-0.95 target box in play, with 0.72 trendline as fallback. Structure still favors higher-highs path.

ADAUSDT 3D Analysis ADA ~ 3D Analysis
#ADA Buy after successfully breaking through this resistance line with a short-term target of at least 10%++, long-term target $3

TradeCityPro | ADAUSDT Is It Time to Buy Cardano?👋 Welcome to TradeCityPro Channel!
Let’s dive in and analyze one of the market’s favorite coins, Cardano (ADA), which is in a strong position compared to most altcoins and is holding at higher resistance levels.
🌐 Overview Bitcoin
Before starting the analysis, I want to remind you again that we moved the Bitcoin analysis section from the analysis section to a separate analysis at your request, so that we can discuss the status of Bitcoin in more detail every day and analyze its charts and dominances together.
This is the general analysis of Bitcoin dominance, which we promised you in the analysis to analyze separately and analyze it for you in longer time frames.
Bitcoin Chart
📊 Weekly Timeframe
On the weekly time frame, ADA, like SOL, SUI, XRP, and most of the top ten coins in the market, is still in a better situation, with the price fluctuating at higher levels.
After being rejected at 1.1983 and losing support at 0.7959, we experienced a sharp drop to 0.50, driven by panic in the market due to Trump and U.S. tariffs on other countries.
Currently, in the weekly time frame, we’re still at higher levels compared to most of the market, and we can expect a strong move going forward. It’s worth noting that breaking 1.1988 will provide the best trigger for a buy.
📈 Daily Timeframe
Interesting things are happening on the daily time frame, and we’re clearly still at higher levels than other altcoins. If the market itself undergoes a trend change, we can be ready for a long trigger sooner.
After breaking 0.8204 and losing the 0.236 Fibonacci level, we experienced a sharp decline that also saw high volume. I expected that after this volume, we’d transition from volatility to forming a range box, and that’s exactly what’s happening. We’re forming a box between 0.6777 and 0.8204, but if today’s daily candle closes as it is, the downtrend will continue!
Additionally, after this event, we had a break of the support floor that turned out to be a fakeout, leading us to establish a new support level. Currently, our most important support is 0.6090, and we’re moving along a daily trendline. If we bounce from this trendline and break the 0.8419 resistance, it will be the best trigger for a buy. On the other hand, if the support breaks and we lose the 0.7417 low, we can go for a short position.
📝 Final Thoughts
Stay calm, trade wisely, and let's capture the market's best opportunities!
This analysis reflects our opinions and is not financial advice.
Share your thoughts in the comments, and don’t forget to share this analysis with your friends! ❤️

ADA: Bigger move is coming! If you're looking to trade ADA at the moment, here's a quick setup that you might find helpful!
The idea is: Buy when the price breaks above $0.865 and take profits at the levels shown in the chart.
Targets:
1. $0.9
2. $0.98
3. $1.03
-------------------------------------------
About our trades:
Our success rate is notably high, with 10 out of 11 posted trade setups achieving at least their first target upon a breakout price breach (The most on TW!). Our TradingView page serves as a testament to this claim, and we invite you to verify it!

Cardano (ADA) Rectangle + Internal Uptrend (1D)BINANCE:ADAUSDT has spent months ranging between ~$0.51 and ~$1.15, and the structure now clearly qualifies as a rectangle pattern.
After a 3rd touch on support in April, Cardano is showing strength with steady higher lows and a reclaim of a key High Volume Node (HVN).
Key Levels to Watch
• Main Demand: ~$0.51-$0.58
• Rectangle Support: ~$0.51
• Rectangle Resistance: ~$1.15
• Internal Uptrend Support: Rising diagonal from April
• HVN Zone: ~$0.75 — key volume cluster
• Rectangle Midline: ~$0.83 — also a previous S/R
• Main Supply: $1.10–$1.32
Measured Target
If price breaks above $1.15 with volume, the rectangle measured move points to ~$1.80.
Context
ADA has respected this range for nearly half a year. A breakout could mark the start of a macro bullish leg.
Triggers
• Bullish: Clean daily close above $1.15 with volume → $1.80 target activated. For a safer entry, it could be worth waiting a full breakout from the main supply above $1.32.
• Bearish: Breakdown of the ascending trendline and HVN → Potential return to ~$0.51. Failure to hold that level could lead to further downside to the previous ~$0.30 demand zone.

HolderStat┆ADAUSD kept the $0.7 levelCRYPTOCAP:ADA reversed a three-month slide with a textbook falling-wedge breakout and now oscillates inside a tightening flag above the 0.72 USDT backbone. Bulls guard successive higher lows along that trend beam; maintain it and the pattern’s target aligns with the 0.90-0.95 supply cap highlighted overhead. A dip toward 0.68 would simply revisit wedge support before any larger drive.

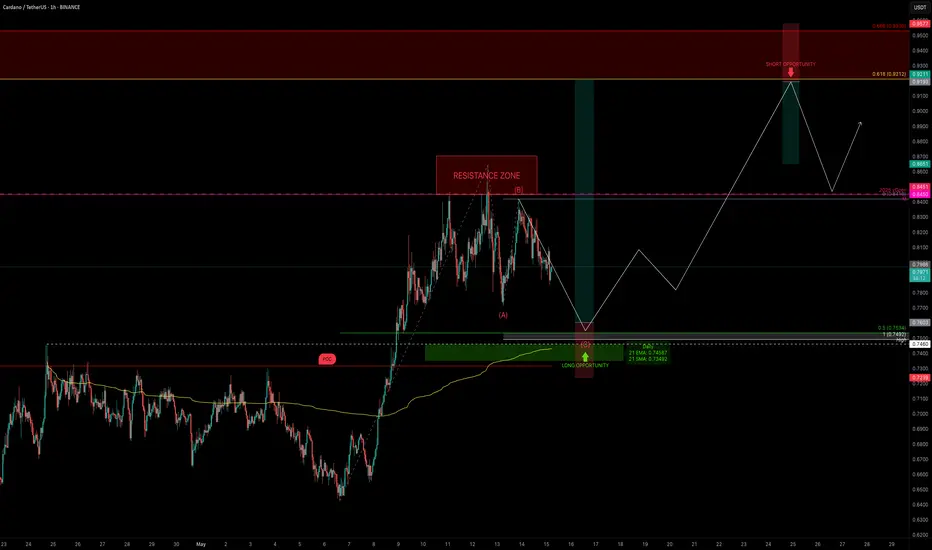
ADA Correction Nearing Completion — Trade It Like a ProADA is respecting structure beautifully and currently consolidating after completing a 5-wave impulse move. The key question now is: where are the next high-probability trade setups?
Let’s break it down step by step.
Market Structure & Elliott Context
ADA has completed a full 5-wave bullish sequence, and—as expected—is now in a correction phase. This appears to be forming a classic ABC correction.
Using the Fibonacci retracement tool:
0.5 retracement of the entire move sits at → $0.7534
This aligns perfectly with the previous swing high at $0.746 — a level that has yet to be retested
The 1:1 trend-based Fib extension of a potential ABC correction puts Wave C at → $0.7492
Confluence Check:
This entire support zone (~$0.75) is stacked with technical alignment:
✅ Previous swing high: $0.746
✅ 0.5 Fib retracement: $0.7534
✅ 1:1 extension: $0.7492
✅ Daily 21 EMA: $0.7455
✅ Daily 21 SMA: $0.7347
✅ Point of Control (POC): ~$0.7318
✅ Anchored VWAP: Also sitting in this zone
✅ Pitchfork golden pocket: Aligns as dynamic support
All of these support indicators point to one thing: this ~$0.75 zone is a high-probability long entry area.
🟢 Long Setup
Entry zone: Ladder between $0.77 – $0.75
Average entry: ~$0.76
Stop-loss: Below $0.7318 (under POC)
Target: $0.9212 (0.618 retracement of the recent down wave)
R:R: ~5:1
Potential upside: +22%
🔴 Short Setup (on Rejection Only)
Entry: $0.9212 (0.618 Fib retracement of downtrend)
Stop-loss: Above 0.666 Fib → ~$0.958
Target: previous swing high or yearly open
R:R: ~1.4:1 (it can be adjusted tighter upon confirmation)
This short setup isn’t ideal in terms of R:R unless we see clear rejection. But with confirmation — like an SFP, bearish engulfing, or divergence — the stop can be tightened, making the risk-to-reward much more favourable.
📘 Educational Insight: Why Structure Beats Emotion
In trading, the strongest setups occur where multiple tools converge—Fib levels, EMAs, VWAP, volume zones, and past price action. When these align, it’s not about guessing—it’s about preparing.
The key is to wait for structure to come to you, not the other way around. Patience allows clarity. Clarity allows precision. And precision pays.
💡 Final Thoughts
The plan is clear. Levels are set. Now it’s just observation and discipline.
Good trades don’t chase attention — they present themselves to those who wait.
___________________________________
If you found this helpful, leave a like and comment below! Got requests for the next technical analysis? Let me know.
ADA/USDT: Bullish Move Ahead ? (READ THE CAPTION)By examining the #Cardano chart on the 3-day timeframe, we can see that the price is currently trading around $0.80. If it holds above $0.71, we can expect more upside. The expected return for Cardano is around 30% in the short term, 47% in the medium term, and 85% in the long term.
Please support me with your likes and comments to motivate me to share more analysis with you and share your opinion about the possible trend of this chart with me !
Best Regards , Arman Shaban

Be prepared for everything...Hello dears
Given the recent growth, the price is stuck in a range and now that it has reached the bottom of the range, there are two options:
1_The price grows from here and hits our target.
2_The price continues to fall and falls to the support area below and our second buying step is activated and grows from there.
Buy a step and be ready for anything.
*Trade safely with us*

HolderStat┆ADAUSD trend support in focusCRYPTOCAP:ADA slid from 0.84 into the long-standing 0.72 up-trend that has anchored every rally since April. Regaining 0.78 re-targets 0.88-0.92 and eventually the 1.00 psyche level, while a daily close beneath 0.70 warns of a deeper probe toward 0.64. 🌟

ADA bulling :)📈 ADA/USDT 4H Analysis
ADA has broken above the 0.7408 resistance, now at 0.78150, showing strong bullish momentum within an ascending channel, targeting higher levels if the trend holds.
🟢 Support Levels:
🔹 0.7220 – recent breakout zone (20/50 EMA)
🔹 0.6630 – key support
🔹 0.6230 – deeper support
[ *]🔴 Resistance Levels:
🔹 0.8430 – next target
🔹 0.9670 – major resistance zone

HolderStat┆ADAUSD wedge exit sets sights on 0.95-1.00CRYPTOCAP:ADA cracked its descending wedge in early May and quickly reclaimed the 0.78-0.80 consolidation shelf. Price is now travelling inside an embryonic ascending channel that intersects long-term support at 0.76. Holding above that floor leaves room for an advance into the 0.90-0.95 resistance box, with the upper rail flirting with the psychological 1 USDT mark. Failure to defend 0.74 would postpone—but not invalidate—the bullish blueprint.

Noah Cloud Pattern - Ruff Times AheadI expect this will get very bad before getting even badder and then better before getting really really better again.
There will be red and green bars and lines and numbers at some point throughout the day, so buy if you want or sell.
I am not a financial advisor.

HolderStat┆ADAUSD down‑trend break, $1 goalCardano price popped its lengthy descending channel, using a 0.62‑0.78 consolidation base as springboard to reclaim 0.78 USDT. Provided buyers defend that level, the move unlocks an advance into the 0.95‑1.00 resistance ribbon flagged above. A close beneath the rising guideline from April lows would dampen, but not invalidate, the emergent ADA breakout.

CARDANO about to form its first ever 1W Golden Cross!Cardano (ADAUSD) is far from dead as not only has it staged a rebound on its 1W MA50 (blue trend-line) but is also close to forming its first ever Golden Cross on the 1W time-frame. Technically this is a similar set-up to November 2020 right after ADA held its 1W MA50, made a Higher Low on its 1W RSI (like today) and started to rise.
This rise ended up forming the top of the 7-year Channel Up just below the 1.236 Fibonacci extension from the previous Cycle High. Basically this whole Bull Cycle has been identical to the December 2018 - December 2020 and right now it appears that the market has started the final parabolic rally.
If the pattern approaches the 1.236 Fib extension again, expect the Cycle to peak around $5.000.
-------------------------------------------------------------------------------
** Please LIKE 👍, FOLLOW ✅, SHARE 🙌 and COMMENT ✍ if you enjoy this idea! Also share your ideas and charts in the comments section below! This is best way to keep it relevant, support us, keep the content here free and allow the idea to reach as many people as possible. **
-------------------------------------------------------------------------------
💸💸💸💸💸💸
👇 👇 👇 👇 👇 👇

Cardano (ADA) Ready to Break Out – Key Levels in Play!Cardano (ADA) Ready to Break Out – Key Levels in Play!
Post with Emojis:
📈🔥 Cardano (ADA) Ready to Break Out – Key Levels in Play! 🚀✨
Hey Traders!
Cardano is back at the spotlight, and this time, the setup looks even stronger! After testing key support zones, ADA is holding above the crucial $0.775 level. The market is coiled tight, and the breakout could come any moment. Are you ready for the move?
📊 Key Levels to Watch:
📍 Immediate Support: $0.775 – Holding strong.
📍 Short-Term Resistance: $0.8368 – Expect a test soon!
🚀 Breakout Target: $1.1930 – First major target on the breakout path.
🎯 Secondary Targets: $1.4757 and $1.8937 – Next zones of resistance if momentum builds.
🏆 Ultimate Bull Target: $3.65 – The long-term upper trendline from the all-time high!
📚 Historical Pattern:
Remember late 2020? ADA compressed for months before exploding upward. The current price action is forming a very similar pattern, and the breakout trajectory is clearly mapped on the chart.
🛠️ Action Plan:
As long as we stay above $0.775, the bias remains bullish.
A breakout above $0.8368 could ignite the next leg towards $1.1930 and beyond.
With stock markets pumping and crypto lagging slightly—this might be the perfect moment to position for ADA’s next big move!
💬 What’s Your Play?
Are you already loading up on ADA, or waiting for the final confirmation breakout? Let’s hear your plans and favorite targets for this run!
One Love,
The FXPROFESSOR 💙

ADAUSDT – Major Breakout Brewing, Watch These Key Levels! 📈🔥 ADAUSDT – Major Breakout Brewing, Watch These Key Levels! 🚀
Cardano is waking up from its long consolidation phase, and the chart is setting up for a potential major impulsive wave. History shows us what happens when ADA compresses at the lower all-time trendline—and we’re right back at that critical point!
📊 Key Technical Levels:
📌 Immediate Support: $0.6799
📌 Resistance Levels to Watch:
$1.1930
$1.4757
$1.8937 – Major Resistance Zone
🎯 Ultimate Target: $3.65 – Upper All-Time Trendline
📚 Historical Context:
We saw a similar accumulation phase back in late 2020 before ADA skyrocketed.
The current price structure mirrors that move, with a clear breakout pattern forming.
🚦 Action Plan:
As long as ADA holds above the $0.6799 support, momentum favors the bulls.
A break above $1.1930 could trigger the next powerful rally toward $2.00 and beyond.
⚠️ Stay mindful of volatility as this breakout zone is tested. Rejections at key resistance could lead to short-term corrections before the next leg higher.
One Love,
The FXPROFESSOR 💙
PS. You HAVE to watch out for this first:
