Cardano, Next Target (Weak vs Strong Resistance Levels)So the day started with a bearish tune but now is trading green. Based on the overall market conditions, this little event becomes a very strong bullish signal. This happening confirms the continuation of the bullish trend.
Notice thin blue line on the chart, it was drawn weeks ago but ADAUSDT bounced perfectly off this level. This means that the low is in.
With a continuation happening starting now/today, all that matters are the targets.
Where is Cardano likely to face resistance on the way up?
Which level is a strong resistance vs a weak one?
Consolidation has been happening since early February, which means that we have three months the market gaining strength. This means that Cardano can now perform a very strong move.
$0.91 is very easy and should be ignored. This is a weak resistance and Cardano can move straight up. There can be some days as the market never moves straight up, but no corrections or retraces are expected at this point. The same for $1.01. The next resistance is found at $1.15. This one yes, watch out for it.
The $1.15 resistance matches the rejection in early March as well as twice in January. It is also close to the peak in December. I drew a purple dotted line on the chart.
Since the December peak is so close, let's make the next resistance level a zone or range. Between $1.15 and $1.32. Or you can say $1.15 followed by $1.32. This is the first resistance to watch out for but it should break after a few attempts. It will definitely break because we had several months of consolidation and we are super bullish.
After this range, we have $1.83 and $2.64. Can go higher
These targets should all hit within 1-2 months.
I will leave the rest for another article, just so you have a reason to comeback.
Thanks a lot for your continued support.
Namaste.
Cardano

XAU/USD: Gold will fall ? (READ THE CAPTION)By analyzing the gold chart on the 2-hour timeframe, we can see that on Friday, after the price rose to $3248, it once again faced a correction and eventually closed at $3326. I expect that with the market opening, we’ll see further correction from gold, and the first potential target will likely be the $3213–$3216 area.
The key demand zones are $3253–$3274 and the $3313 level.
The key supply zones are $3355–$3369 and $3395–$3408.
Please support me with your likes and comments to motivate me to share more analysis with you and share your opinion about the possible trend of this chart with me !
Best Regards , Arman Shaban

ADA in coming days ...The pattern has broken, and now I expect the price to rise to $1.3 . AB=CD.
Give me some energy !!
✨We spend hours finding potential opportunities and writing useful ideas, we would be happy if you support us.
Best regards CobraVanguard.💚
_ _ _ _ __ _ _ _ _ _ _ _ _ _ _ _ _ _ _ _ _ _ _ _ _ _ _ _ _ _ _ _
✅Thank you, and for more ideas, hit ❤️Like❤️ and 🌟Follow🌟!
⚠️Things can change...
The markets are always changing and even with all these signals, the market changes tend to be strong and fast!!

ADA/USDT: Is ADA Preparing for Its Next Rally?(READ THE CAPTION)By analyzing the #Cardano (ADA) chart on the 3-day timeframe, we can see that over the past few months, the price surged from $0.33 to $1.32, delivering a gain of over 300%. After reaching its highest level in 3 years, it faced selling pressure and corrected down to $0.50.
Currently, Cardano is trading around $0.70, and if the price can hold and close above the $0.65 level, we may expect further upside in the medium term.
The next potential targets are $0.75, $0.81, $0.93, and $1.05, respectively.
Please support me with your likes and comments to motivate me to share more analysis with you and share your opinion about the possible trend of this chart with me !
Best Regards , Arman Shaban

BTC/USD: Get Ready for another Bullrun ! (READ THE CAPTION)By analyzing the #Bitcoin chart on the weekly timeframe, we can see that the price is currently trading around $95,000. Soon, we should expect Bitcoin to enter the key supply zone between $99,500 and $109,500, where we’ll closely watch for the market's reaction.
Bitcoin continues to show strong demand, and we may witness another bullish spike in the short term. All previous assumptions from the last analysis remain valid.
Please support me with your likes and comments to motivate me to share more analysis with you and share your opinion about the possible trend of this chart with me !
Best Regards , Arman Shaban

Cardano, 2nd Entry —Friendly ReminderI am doing a second entry on Cardano for my people with leverage. I know it is more risky as we no longer have bottom prices but the show must go on.
When the action is already ongoing, when it is no longer 100% certain that we are looking at a bottom, we still jump-in but with lower leverage compared to the initial and main entry.
These leveraged trade-setup that I share are long-term based, these are not your conventional type of trades. Traditional traders get in and get out and normally are looking to catch a 1-3% bullish wave. Here we are looking for hundreds of percentages of points of growth and this removes all the complexity of brokers commissions, fees, interest on the margin and so on. We spot the reversal. Of course, every method has its advantages and disadvantages but remember that my group is a more spiritually oriented one; we look for market conditions that produce great results, easy but with peace of mind, time to trade and earn but also to relax.
There is always risk involved. Many trades can fail in a cycle or during a transition period. But as soon as the next wave is in we have great entry and can easily win big, many times more than any of the losses incurred during the transition period.
It is a fallacy to think that trading is about getting them all right or many right, it is about making money, period. What works for you works.
There are many different methods and ways to approach the market. No one owns the golden rules. You can buy and hold, you can use leverage, you can do what works for you and all is good.
Long-term, we end up winning with the Cryptocurrency market. It is hard to lose to be honest because everything grows. When prices are down, we wait and we hold. When prices are up, we collect profits and move up.
When the market is at a new bottom (7-April) and highly depressed, we jump in with full force and make up with huge wins for any natural and unavoidable mistakes.
It is a process of growth. If you can gain control of your mind, the market becomes as easy as waiting for the right time, buying and just watching your money grow. The hardest part is being patient; the easiest part is to trust.
Trust this process. Trust the market. Trust me, and you will be happy with the results.
Namaste.


Cardano: The Future of Decentralized Currency?Why It’s Poised to Surpass Bitcoin Without the Pump-and-Dump Chaos
For years, Bitcoin has dominated the crypto space, hailed as the ultimate decentralized currency. But as time passes, cracks in its foundation are becoming more apparent. High fees, slow transactions, extreme volatility, and the ever-present influence of whales manipulating the market have made Bitcoin less of a currency and more of a speculative asset.
Enter Cardano (ADA)—a blockchain designed with sustainability, security, and real-world usability in mind. Unlike Bitcoin, Cardano isn’t about making millionaires overnight. It’s about creating a stable, decentralized, non-government-controlled currency that can actually function in the global economy.
Cardano vs. Bitcoin: A Clear Advantage
Bitcoin was revolutionary, but it’s far from perfect. Cardano, on the other hand, was built to fix many of Bitcoin’s shortcomings:
Aspect | Bitcoin | Cardano
-----------------|--------------------------------------|---------------------------
Speed | ~7 tps | ~250 tps
Fees | High, unpredictable | Low, stable
Security | PoW (51% risk) | PoS (secure, energy-friendly)
Market Influence | Whale-driven volatility | Fair, less volatile
Usage | Speculative, rarely daily use | Bank-integrated (e.g., Revolut)
Cardano’s Proof-of-Stake (PoS) consensus mechanism makes it far more energy-efficient than Bitcoin’s Proof-of-Work (PoW) model, which requires massive computational power. This not only makes Cardano more sustainable but also more secure, as PoS eliminates the risk of 51% attacks that Bitcoin is vulnerable to.
A Currency, Not a Speculative Asset
One of Bitcoin’s biggest flaws is its pump-and-dump mentality. Whales accumulate massive amounts, hype it up, then cash out at peak prices—leaving retail investors holding the bag.
Cardano, however, is built for steady, organic growth. It’s already available through European banks like Revolut, where users can hold it without staking—just like a real currency—and even earn interest.
This is a game-changer. Unlike Bitcoin, which relies on speculation, Cardano is positioning itself as a functional, usable currency that can integrate seamlessly into the global financial system.
The Path to Global Adoption
For Cardano to truly become the number one decentralized currency, it needs:
✅ Steady community growth without massive whale influence
✅ Global distribution without extreme price manipulation
✅ Institutional adoption without compromising decentralization
If Cardano continues on this path—growing slowly and evenly rather than through artificial pumps—it has the potential to surpass Bitcoin as the true decentralized currency of the future.
It won’t make millionaires overnight. But that’s not the point.
The goal isn’t speculation—it’s real-world usability. And in that regard, Cardano is light-years ahead of Bitcoin.
Final Thoughts
Bitcoin was the first step toward decentralized finance, but it’s not the final solution. Cardano is proving that a cryptocurrency can be secure, scalable, and actually usable—without the chaos of pump-and-dump schemes.
If adoption continues steadily, without whales hoarding too much of it, Cardano could very well become the first truly decentralized international currency—one that isn’t controlled by governments or manipulated by big players.
The future of finance isn’t Bitcoin.
It’s Cardano. 🚀🔥
CRYPTO:ADAUSD

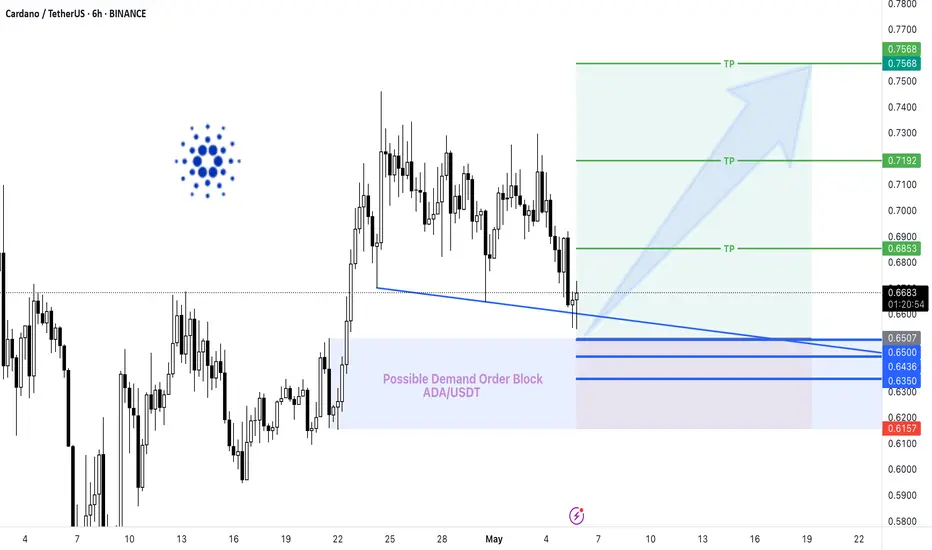
LONG ADA/USDT | Bullish Reversal SetupADA/USDT | Bullish Reversal Setup
📊 Market Structure
Context: After a retest of April highs, ADA pulled back into a shallow down-sloping support line (blue).
Implication: A series of higher-low tests into that line suggests buyers are defending this area.
🔹 Demand Order Block
Zone: 0.6350 – 0.6500 USDT (shaded blue)
Key Entry Levels:
0.6500 USDT
0.6436 USDT
0.6350 USDT
⚔️ Long Entry Strategies
Aggressive: Scale into longs on a bounce off 0.6500 USDT with a strong bullish candle.
🛑 Stop Loss
Close below Level: 0.6157 USDT
Placed just below the demand block to absorb noise yet protect capital.
🎯 Profit Targets
TP1 0.6853
TP2 0.7192
TP3 0.7568
🔧 Trade Management
Scale-Out: Take partial profit at each TP to lock in gains.
Trail Stop: Move to breakeven once TP1 is reached.
Invalidation: A daily close below 0.6157 USDT negates the setup—exit and reassess.
Cardano: Buy Opportunity In The Making (Buy When Red)Retraces, even if these are very small, can be used as an opportunity to buy. Whenever the market turns red that is an opportunity in the making, because we are set to experience growth long-term.
When the market is green, we either wait patiently or secure portions of profits. When the market turns red, that's the time to buy because as soon as the low is in (higher low always) what happens is the continuation of the initial and main move, the bullish wave.
Cardano is red today but it was also red on the 30th of April, the 29 and so on. If you consider the chart closely, the action always fluctuates between green and red. Now, this red action won't last long so the opportunity within hours or days can be gone.
» Any drops, corrections and retraces are an opportunity to buy-in, rebuy and reload. This is true for Cardano as it is true for Bitcoin and the rest of the Altcoins.
Namaste.
ADA - Ready for Launch? Helllooo and welcome!! - Look at this
This is a 4H SVP chart for Cardano,
The price is currently around $0.7078, and the recent structure shows a consolidation phase. The POCs (Point of Control) are clustering between $0.70 and $0.71, which means this is where the most trading volume is happening – a fair value area. Price is being accepted here.
We also see that in the past few sessions, VAH (Value Area High) and VAL (Value Area Low) are narrowing, suggesting reduced volatility and possibly a squeeze building up. The session from April 30th had a deep sell-off, but buyers responded well, and the price recovered quickly above VAL. This is a sign of demand stepping in at lower prices.
However, unless the price breaks above $0.715 (recent VAH zone) with strong volume, we might stay range-bound. If price falls below $0.695, it could slide to lower value zones near $0.685–$0.675
However my doodle is suggesting a move like this as mentioned. Invalid if touches the pink, first touches the cyan box, Purple shows the last place for all buys if it wrecks, what you want is breaking the orange!

ADA BUY LIMIT (FREE)Hello friends
Due to the entry of buyers and the registration of higher ceilings and floors, we can buy in the direction of the trend and with capital and risk management within the specified ranges and move to the specified targets.
*Trade safely with us*

Parallel Channel Ending? Cardano Targets 0.85 With 20% SurgeHello and greetings to all the crypto enthusiasts, ✌
All previous targets were nailed ✅! Now, let’s dive into a full analysis of the upcoming price potential for Cardano 🔍📈.
Cardano is consolidating within a parallel channel, nearing a major daily support level after a sharp decline. This technical setup suggests a potential bullish reversal in the short term. I anticipate at least a 20% move upward, with a primary target of 0.85.📚🙌
🧨 Our team's main opinion is: 🧨
Cardano’s holding strong at key support, and I’m expecting a 20% bounce soon with 0.85 as the main target.📚🎇
Give me some energy !!
✨We invest hours crafting valuable ideas, and your support means everything—feel free to ask questions in the comments! 😊💬
Cheers, Mad Whale. 🐋

btcusdtbtcusdt
Bitcoin has reached an important decision point. Which line do you think will happen?

Cardano: Low Ahead!According to our primary scenario, Cardano's ADA coin should imminently pull back toward the support at $0.31 to finally complete the blue wave (ii). With this low in place, we see the altcoin breaking out above the resistance at $1.32. If the price manages to rise above this mark without forming a new low first (33% likely), we will have to assume that wave alt.(ii) in blue is already complete.

ADAUSDT 1W AnalysisADA ~ 1W Analysis
#ADA Buy gradually from here if you still have a Conviction on this coin with a short -term target of at least 20%+.

ADA/USDT – 3D Long Signal Active
📅 April 29, 2025
The system triggered a long entry at the last 3D bar close.
Currently, the price remains around the same levels.
✅ System conditions for a long are fully met:
MLR > SMA > BB Center > PSAR
Price is trading above the 200 MA on the 3D timeframe.
⚠️ Caution:
On the 1D timeframe, price is still below the 200 MA, which suggests some lingering weakness. Proceed carefully.
📍 Strategy Plan:
Consider entering long at today’s daily close or at the next 3D bar close.
Suggested stop-loss: below the latest PSAR dot for system integrity.
🔔 Keep an eye on updates and thank you for reading! 📈📊

Cardano Is Ready To Move Now! Final Call —Friendly ReminderThere is a very thin line drawn around 0.6950 which is a Fib. support level. Cardano is trading above this level, remains above this level and continues to be green. These candles are composed of two days each... This is it.
Good afternoon my fellow Cryptocurrency trader, I hope you are having a wonderful day.
Cardano is ready now, we are ready now, the market is ready now...
Prepare to profit. Huge profits can be made.
A life changing situation is developing within the Cryptocurrency market right now and prices are still low. We had months and months of a long correction, weeks of sideways, and the market is ready now, we are ready now to go up, see up and grow. This is the opportunity you've been waiting for. Time to take action.
These are the same drawings on the chart as before I haven't changed them because they are good and valid and get the message across. It shows a nice chart structure with a consolidation corrective phase, sort of big bullish flag, or a channel but the upper resistance has been broken and the downtrend is no more.
Remember, the low was hit 3-February and the 7-April wick on the Doji reversal candle was a higher low. This means that Cardano is very strong, buyers were ready and waiting for bears to sell and they bought. Once the action resumes it will be so strong that there will be no time to think, no time to adapt. The market starts moving now or within days.
After a low is hit if there is no continuation on the bearish side this becomes a bullish signal. With the higher low and consolidation this is as bullish as it gets. Cardano is trading back above support.
The conditions are perfect and the action is pointing toward additional growth. This is what I see coming from the chart and the fact that Bitcoin remains strong, really strong not dropping even $2,000 but trading above $90,000 supports the Altcoins market.
Cardano being at the top and moving strongly last year, it is sure to move strong again and out-perform many of the other Altcoins. With a pair like this you can't go wrong.
Get the big one, get the small ones, get anything you want but, diversify and use some stable reputable projects to secure your profits on the way up.
The 2025 bull market is confirmed.
This is the start of the next advance.
Buy and hold. Go LONG!
Enjoy the profits as they come.
Namaste.

Cardano: Is It Too Late To Join The Action?It is not too late. Actually, it is still pretty early.
Notice this chart and the 0.236 fib. extension level. While Cardano is breaking out of a consolidation pattern with a local downtrend, it is still trading below this most primitive fib. resistance. Simply meaning that it is very early when we consider the biggest picture and long-term growth potential.
You see, some smaller Altcoins have grown by 100%+ in a single day. Even some of the big projects moved 20%, 30% and even 50% in a single day. It is the start, now, of a major bullish cycle and phase. It is the start of the 2025 bull market, so there is no such thing as being late.
Imagine daily growth, day by day, week by week, going and going, over and over, for months. This growth can go until November 2025 or even beyond, into early 2026. Knowing this, we know that it is very early.
Now, what about retraces, pull-backs, corrections and shakeouts?
What to do if the market shakes?
Every time there is a drop, this is positive, it is an opportunity to buy at lower prices. Every drop or correction should be considered an opportunity to buy-up, rebuy and reload. And, if you missed the early entry, the first entry, you can buy whenever your favorite pair, in this case Cardano, hits support.
Cardano it still very early in its bullish breakout and bullish cycle, it will grow for months. Knowing this, you can go ahead easily and buy and hold.
You will be happy with the results.
Just focus on the long-term, think of a waiting period of at least 3-6 months. With this mentality, you can't go wrong.
If you think of making money in a matter of days, this can result in anxiety and mistakes. No, that's not the way you should trade.
You should focus on resistance and support. As long as prices remain above support, we are bullish, when resistance hit, we take profits home. That's all there is. After you buy, you hold. The market will take care of the rest.
It is still early for Cardano but once you buy, you have to wait.
Many pairs are still trading at bottom prices. New pairs will be breaking out strongly every single day. Daily. Every day a new pair will produce massive growth. When all is set and done, the entire market will be 20-30X up. It will be awesome.
Thanks a lot for your continued support.
Namaste.

ADA USDT SCENARIOI tried to make 2 scenarios on cardano. You can see it on the chart, Remember this is not a trading advice, and this is just a part of technical analysis, make sure you have researched it first before entering the market.

ADA 1-Year EMA Reclaim and Reversal (1D)After a double bottom at ~$0.50, BINANCE:ADAUSDT reclaimed the 1-year EMA (red) with a ~+9% large bodied daily candle, potentially shifting back to a bullish bias.
Key Levels to Watch
• $0.50-$0.58: Current support, a break below it would invalidate any bullish setup.
• $0.73-$0.77: Current resistance, 0.236 fib extension, HVN, and key S/R in place since February 2022. This is the most crucial level that the bulls need to reclaim.
• $1.10-$1.30: Main supply zone, with significant weekly and daily sell order blocks, plus 0.618 fib extension.
A daily close above above $0.77 would offer a good chance at retesting 2024's highs.

ADA ready for sustained gains?The recent turn in the cryptocurrency market is an interesting one, with many small cryptocurrencies making major moves from the most recent sell-off lows.
It can be said that significant funds have flowed into popular alt coins over the past few days...But is this in preparation of more sustained gains in popular secondary cryptocurrencies such as DOGE, ADA, LINK? Or will alt coins continue with their typical pump and dump style behaviour?
Time will tell...
We have identified a potential opportunity within ADA over the coming weeks(+) for momentum to turn to the upside if the current region can be held - Caution as always is warranted.
We're inspired to bring you the latest developments across worldwide markets, helping you look in the right place, at the right time.
Thank you for reading! Stay tuned for further updates, and we look forward to being of service along your trading & investing journey...
Disclaimer: Please note all information contained within this post and all other Bullfinder-official Tradingview content is strictly for informational purposes only and is not intended to be investment advice. Please DYOR & Consult your licensed financial advisors before acting on any information contained within this post.

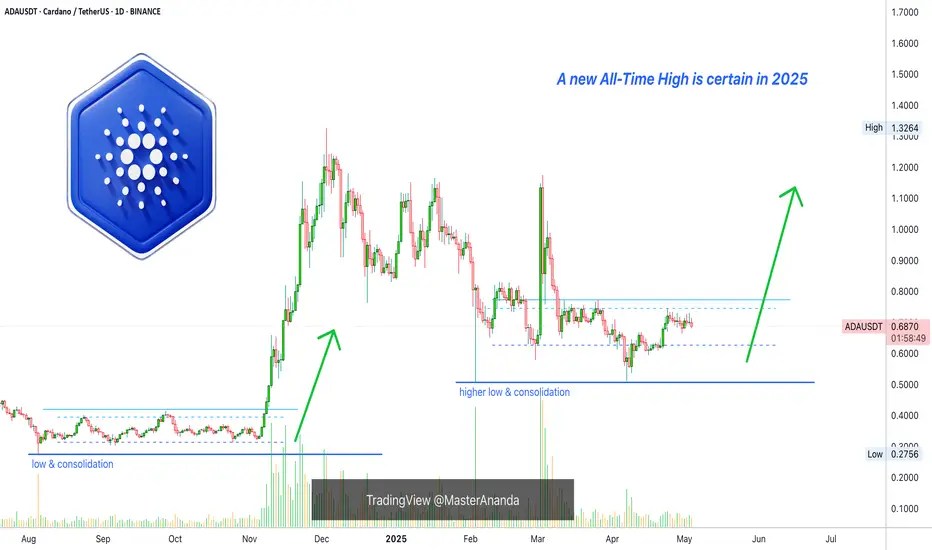
Cardano Prepares For A 300% Rise Mid-TermCardano is preparing to grow and I see a 300%+ potential profits rise within 3 months, which is our mid-term time horizon. This would put ADAUSDT at around $2.65 but this will not be the end of the bull market, this is only a portion of it because we are expecting more growth in this year 2025 or maybe even beyond.
How are you feeling in this wonderful day?
It is wonderful because the market is green.
It is wonderful because we are alive, healthy and happy; are you with me?
Look at the chart, what do you see?
The low was in early February with a long lower wick. That's it, this signal gives it all away. The fact that there is a higher low just two weeks ago, 7-April, signals that the bottom of the correction is in, once the correction is over we get a new bullish impulse and that's the bullish wave that I am talking about. It is happening now but it will last a long time.
Now, the action will not all happen in a single day but the first move tends to leave great entry prices behind. So after the start there can be some swings, some shaking, some down, some up, but always long-term growth based on a chart structure of higher highs and higher lows. As long as you can protect against the present low, any and all positions will hold because Cardano is set to grow.
This is a friendly reminder, we are going up very strong.
Get in now!
The 2025 bull market is here.
Thanks a lot for your continued support.
Namaste.
