ADA/BTC . One last push before correctionNot a financial advice.
Looks like we’ll see ADA making a bearish divergence on 1D TF.
So, here’s an opportunity to long, but close it around 996-1000 sats.
Imo, we still need to retest the support (ema200) before continue a new rally to the upside.
Trade safe everyone.
CARDANOADA

ADA Has Surged More Than 200% But Still Going Better Than BTCHi guys and gals hope you're doing good. Cardano is the coin that is going for better than the Bitcoin in other top altcoins. Today we will try to understand the movement of the price action of ADA coin what it can do next.
The difference between Cardano’s move and other cryptocurrencies:
As in the below chart it can be easily observed that the ADA and Bitcoin both have formed up channels on daily charts after the mid of March 2020. And there were many more other cryptocurrencies that have formed same as like this up channel following the movement of the Bitcoin. But the difference between the Cardano and all other cryptocurrencies is that ADA has broken out the resistance of this channel on the 30th of May but on the other side the Bitcoin and many other top altcoins have broken down the support of the channel.
I have also placed the simple moving averages with the time period of 25, 50, 100 and 200. And when the Cardano broke out the resistance of the channel then there was a big distance between the price action and all the simple moving averages. So there were two possibilities whether the price action starts a correction rally to the downside up to the nearest available moving average to have some support over the moving averages or the moving averages move up to provide the support to the price action. And finally the moving averages moved up to provide the support the price action and that is really very positive move. At this time the price action is at the support of 25 simple moving average and 50 simple moving average is also moving up. And if we watch the 100 and 200 simple moving averages then recently the 100 simple moving average has crossed up the 200 moving averages. After this cross a complete opened alligator mouth is formed by the simple moving averages. As now we have the smallest time period moving average above all other moving averages and the biggest time period moving average is below all the moving averages. On the other side on BTC chart we have the smallest moving average above all other MAs but the biggest time period moving average so far is not below all the moving averages therefore the ADA coin has potential to move against the market its mean that if the Bitcoin will be moving down then it is possible that Cardano will maintain its position.
The exponential moving averages and their synchronized movement with indicators:
If you watch the exponential moving averages with time period of 10 and 21 then it can be easily observed that since the priceline of ADA has crossed up these two exponential moving averages then it is using them as good support. I have also observed the movement of the price action above these two EMAs is very much synchronized with stochastic and MACD indicators. Because whenever the price action touches the exponential moving averages and stochastic gives the bull cross and MACD also turns bullish then the price action starts next bullish rally until it re-tests the exponential moving averages again. This time when the price action again touched the EMAS then stochastic gave bull cross and MACD also truned weak bearish from strong bearish that is also a bullish signal. Then ADA tried to start the next rally. But again the stochastic has given bear cross and the MACD also turned strong bearish in the price action again moved at the support of these to EMAs. Now the MACD is again turning bullish. If the price action will be still on these EMAs and stochastic will again give the bull cross then it is possible that the price action of Cardano will start the next bullish rally.
Different support and resistance level and re-testing of resistance as support:
Now if we switch to the two day chart then on this chart the different support and resistance levels can be seen very clear. In the month of March 2020 the price action bounced from the last support of $0.027 and crossed up the next resistance of $0.045. The price action retested the previous resistance as support and crossed up the $0.065 resistance level and after breaking out the next resistance level the price action has broken out the $0.08 resistance level as well. At this time the price action is retesting $0.08 resistance as a support. If this retest will be successful then the priceline of ADA can move up to the next resistance level that is at 10 cents. Otherwise it can move back to the previous resistance level of $0.065 to re-test it as a support. Now the next move of the Cardano whether to the upside and downside depends on this retesting of previous resistance level as support.
Conclusion:
So far the price action of Cardano is more bullish than Bitcoin and other top cryptocurrencies. Therefore we can expect that ADA can be a safe heaven at the time when the Bitcoin will start correction rally. However we can set a stop loss at next support level that is $0.065 to minimize the risk of investment.
Note: This idea is education purpose only and not intended to be investment advice, please seek a duly licensed professional and do you own research before any investment.

Cardano (ADA) Is Gonna Start Chain Reaction SoonHi folks, hope you are doing good, today I am gonna show you a really very interesting move made by Cardano’s price action. It has formed a series of bullish pattens and formed patterns within other patterns. Therefore this article can be really very interesting for the people who are trading for holding ADA.
Recap:
First of all I would like to take you to my old article that I published on 19th August 2019 and on this chart I revealed that Cardano has formed a bullish harmonic Shark pattern. This pattern was started from Feb 2019 and completed on August 2019.
And as per Fibonacci sequence of bullish Shark it was expected that the price action will enter in the Fibonacci projection of C to D leg from 0.382 to 0.786 Fibonacci projection level. If the price action would cross up the 0.786 Fibonacci projection level then it would turn more bullish but unfortunately after visiting the Fibonacci projection area or sell zone the priceline dropped at the support.
Dropped on strong support:
At this time we have a strong suppor at $0.027 and we can see so far it is proven very strong support as on 13th March 2020 on daily chart a really very strong and long bearish candlestick tried to break down this support but even after hitting far more beyond this support the candlesticks retraced back above the support zone. It can be expected that the priceline would move at this support level sideways for some more time.
Bullish Crab pattern on 2 day chart:
Now let's come to the point that I want to share with you and that is ADA has formed harmonic patterns within other harmonic pattern let's take a look at 2 day chart.
Here on 2 day chart the price line has formed a bullish crab pattern let's have a look how perfect this pattern is formed after initial leg the A to B leg is retraced between 0.382 to 0.618 Fibonacci level and B to C leg is projected between 0.382 to 0.886 Fibonacci projection of A to B leg. After that the last leg is retraced between 1.27 upto 1.618 Fibonacci level. Even though the price action has hit the potential reversal zone and retraced back and has hit the Fibonacci projection area of A to B leg from 0.382 to 0.786 Fibonacci projection but I am expecting that it will be turned more bullish soon and it can even cross up 0.7886 Fibonacci projection level because we have more bullish patterns on log term charts.
www.tradingview.com
Bullish Butterfly pattern on weekly chart:
Now let's move to the weekly chart where the price action of ADA has formed bullish butterfly pattern. Let's have a look how perfect this pattern is formed. The initial leg was started in December 2019 and completed on Feb 2020. Then A to B leg has been retraced between 0.618 to 0.786 Fibonacci level that is the first confirmation of bullish butterfly pattern. Then B to C leg is moved up between 0.382 to 0.886 Fibonacci projection area of A to B leg and here we have received the second confirmation of bullish Butterfly. Now we can see the recent strong bearish rally has helped the price action to complete the final leg off this pattern and C to D leg is retraced between 1.27 upto 1.618 Fibonacci level. Even though we can see that the price action has hit beyond the potential reversal zone of this pattern but in very next candle the priceline is pulled back and has hit the 0.382 to 0.786 Fibonacci projection of A to D leg. But we can expect that soon the priceline will again turn bullish and we will see some green candlesticks on this weekly chart.
Very bit bullish Butterly on monthly chart:
Now let's move to the more bigger time period chart and that is one month chart. On this long term chart price action of ADA has formed another harmonic Butterfly pattern. The first leg of this butterfly was started on November 2018 and completed on June 2019. Then we can see that the price action has been retraced between 0.618 0.786 Fibonacci level and from November 2019 to Feb 2020 the price action moved up between 0.382 to0.886 Fib projection of A to B leg. Then again the price action dropped between 1.27 upto 1.618 Fibonacci retracement level and here we have a complete bullish Butterfly.
A chain reaction to achieve highest price:
Now we have a series of harmonic patterns. The first one is on 2 day time period. The second one is on weekly time period. And third one is on monthly time period chart. The short time period 2 days pattern can provide the push to the pattern that is formed on weekly chart and the weekly chart parent can provide the strong push to the pattern that has been formed on monthly chart. This move of Cardano will be like a chain reaction. And this chain reaction can produce a very powerful bullish divergence even we can see that the ADA can achieve the highest price ever in the history of Cardano.

ADAUSD: Analysis using Ichimoku 10/06/2020H4
A steady uptrend is visually clearly visible.
The price is in the Ichimoku cloud, indicating a local correction.
RSI is near the oversold level.
Conclusion:
We recommend buying when the RSI reaches the oversold level, as well as at the Fibonacci level of 61.8%
H1
The price is below the Ichimoku cloud, forming new lows for local correction of the H4 timeframe.
The RSI is near the oversold level, indicating a near end to the downward movement.
Conclusion:
We have identified local correction for H4 and recommend buying when the RSI oversold level is reached, as well as from key Fibonacci levels of 38.2% and 23.6%.
Good luck!


Cardano Is Pumped More Than Other Top CryptocurrenciesHi friends hope you are doing well and welcome to the new update on Cardano. In today's article we will try to understand why the ADA has surged more than other top cryptocurrencies. And in order to understand this we will try to watch the different chart patterns, moving averages, oscillator and different indicator is well.
Harmonic moves gave advance bullish signals for this surge:
Now before moving to analysis. I would like to show you to harmonic patterns that were formed during the strong bearish trend of March 2020. And while moving down the Cardano formed a harmonic Crab pattern on two day chart and in the meanwhile the price action also formed a very big bullish Butterfly pattern on the monthly chart as well. Therefore as per Fibonacci sequence I predicted that the price action will take bullish divergence from the potential reversal zone of Crab and along with that it will also start a bullish rally from the potential reversal zone of bullish Butterfly pattern on monthly chart. And the this move would be like a chain reaction. And we have witnessed that finally the priceline of ADA started a bullish move after the mid of March. And sofa it has produced more than 300% rally.
Bullish Crab:
Bullish Butterfly:
The SMAs:
In order to observe the power of bullish or bearish trend it is very important to watch moving averages. Therefore I always watch the position of the moving averages. Now on daily chart if we watch the position of the simple moving averages with time period of 25 50 100 and 200 then it is very strong bullish. There is only one move is due and that is the 100 simple moving average should form a bull cross with 200 SMA. And then a complete opened alligator mouth will be formed that can lead the price action to turn more bullish. But there is also a critical point and that is the price action has turned so much bullish and it went very far above the moving averages. And there is a big distance between the moving averages and the price action. Therefore if the priceline will start a correction rally then it can move down up to the first available nearest moving average and at this time it is 25 SMA. Therefore that will be a drastic drop however if the moving averages will be moved up and remove this distance then the price action will have strong support of the SMAs just below the tail of the candlesticks.
Up channel has been broken exceptionally and EMAs are strong bullish:
On the same daily chart the Cardano has formed an up channel like every top cryptocurrency. But exceptionally the ADA turned very strong bullish and it has broken out the resistance of the channel. On the other side if we watch the Bitcoin and all other cryptocurrencies then those are still moving within the channel. For example at this time the Bitcoin is near support of that channel. And if we watch the exponential moving averages 10 and 21 then again Cardano went very far from the support of exponential moving averages and on the other side the Bitcoin is using the exponential moving averages EMA 10 and 21 as support.
Support and resistance levels:
During the previous strong drop the priceline of ADA has re-tested the support of $0.027. Then it moved up and crossed the $0.45 resistance. And after crossing up this resistance the price action re-tested it as a support and then Cardano turned very strong bullish and crossed up $0.065resistance level. This time the priceline was very strong bullish as it did not re-tested the previous resistance of $0.065 as a support. However there is still possibility that price action will start correction rally and re-test the previous resistance as support before next bullish rally. Now the next resistance level for Cardano is $0.10. Amd this level in very strong key level resistance as it is not broken out since April 2019 even after several attempts by the ADA. Therefore the next bullish move is very important for Cardano. If this $0.10 resistance level will be broken out then the price action can start stronger than the previous bullish rally to achieve the higher than previous highest price ever in the history of ADA.
Conclusion:
In the month of Jun 2020 The ADA can behave different as compare to other cryptocurrencies including Bitcoin. And it can show more powerful bullish moves in coming days. However we should be careful about the stop loss because the price action went very far and away from the support of the moving averages. Therefore if price action will move down to retest the support of any moving average then the drop can be severe.

Cardano swing shortReasons to short again, fibonacci levels + oversold, elliot waves, equal to correction on the way.
my entry was 0.083 the first TP at 0.073

ADA Moves Towards The Range HighExpecting ADA/BTC to move towards the range high at 620 satoshis. All explanations are in the chart.
Please leave a like and comment if you enjoyed the analysis.

CARDANO HTF SYM TRIANGLE PLAY ADABTC forming a bullish Sym triangle which normally would play out to the upside, however pending BTC action we may see all alt coins take further dumping as BTC pumps.
Currently waiting for confirmation on ADABTC before taking any positions, will be waiting for the break then re-test/hold of either side of the triangle in order to take positions either way.
Play for either direction is below;
LONG PLAY:
Will be looking for a break in Sym triangle then a re-test confirming break
SL : pending new structure that has formed
TP's on the way up: 590, 620 & final TP at 680
SHORT PLAY:
Will be looking for a break in Sym triangle then a re-test confirming break
SL : pending new structure that has formed
TP's on the way down: 510, 480 & final TP at 450
LEARN TA! At MBA we teach technical analysis from the basics up, learn to trade with our veteran traders with a community of 200+ other traders;
Link in profile description!

Will Cardano (ADA) Breakout The $0.10 Resistance In This Rally?A chain reaction is triggered:
in my previous post I predicted a chain reaction in the price line of Cardano, if you missed my previous post then here is the link:
As in my previous post we have seen that in the month of March after strong bearish trend the ADA completed the final leg of big bullish Butterfly pattern on the monthly chart. And as per Fibonacci sequence of the bullish Butterfly the priceline was supposed to take the bullish divergence from the potential reversal zone and enter in the Fibonacci projection from 0.382 to 0.786 Fib level. And this was the Fibonacci projection of A to D leg. In the meanwhile on the smaller time period 2 day chart the ADA formed another bullish harmonic Crab pattern and entered in the buying zone of this Crab pattern as well. And we can see that 1st price action took a bullish divergence from the buying zone Crab pattern and triggered a kind of chain reaction that the priceline from the potential reversal zone of the big bulllish Butterfly pattern on the monthly chart also moved up and entered in the sell zone or Fibonacci projection area and produced more than 184% bullish rally.
Now what next?
Now the question arises that if both bullish patterns are executed then whether the priceline of Cardano will continue this bullish rally or not? Because so far the ADA has produced more than 184% Big gains. Is there any possibility that the Cardano will move more up to produce more gains? For that we need to study some more indicators and support and resistance levels let's have a look at them.
Support and resistance levels:
If we switch to the daily chart to watch the different support and resistance levels. Then we can observe that the strong bearish rally in the month of March 2020 the price action was trying to breakdown the $0.027 support. This is a very strong support that is not broken down since December 2018 and this time it has worked well and did not let the priceline move down. From here the price action moved up and broke out the next resistance level $0.045. At this time the price action has started a correction rally to re-test the previous resistance as support and after successfull re-test of this previous resistance as support the price action can move up to break out the next resistance level $0.065. And after breaking out the $0.065 resistance level we have key level resistance at $0.10. Once the price action will break out this key level resistance then it can turn more bullish to achieve the highest price ever in the history of Cardano.
Moving averages:
On the same daily chart the moving averages are also doing good. After the bullish rally of March 2020 the price action broke out all the simple moving averages with the time period of 25, 50, then 200 and at the end it has broken out the 100 simple moving average. Sofar the price action has re-tested the 25 and 50 simple moving averages as a support. After breaking them out the price action did not re-tested the 100 and 200 SMAs resistance levels as support. Therefore we can expect that the priceline may start correction rally from here and re-test the 100 and 200 simple moving average resistance levels as support.
Conclusion:
On short term we can expect a correction rally to retest the $0.045 support and 100 and 200 SMAs. The continuation of bullish rally depends on the success of this re-test if the priceline will not breakdown these supports and then it can further move up to breakout the key level resistance at $10 and in case of breakingout the $0.10 resistance it can turn more bullish than previous bullish move.
Note: This idea is education purpose only and not intended to be investment advise, please seek a duly licensed professional and do you own research before any investment.

ADABTC Buyer recovery before continuation First of all, congratulations to all who followed my ADABTC call ! 10%+ gains a day keeps the doctor away!
After letting the dust settle, I will only be looking for SHORT re-entries on ADABTC, will be looking for continuation patterns aswell as weak buyer recovery for confirmation in order to make a final decision on the re-entry. IDEALLY we would be looking at a slow & weak buyer recovery over the next few days up to the golden pocket range for Fibonacci between 0.618-0.65 in order to take our SHORT orders for the next leg down.
If bullish buyback seems extra weak, I will be looking to DCA my entries from the 0.5 Fibonacci line upwards to the 0.618-0.65 golden pocket.
TP's on the way down we will be looking at structures to the left, 555, 540, 525 & FINAL TP within 507->500 golden pocket zone of our initial swing low to high uptrend.
If we reach the zone between 507-500 & the zone holds as support I will re-assess to take LONG's from this retracement.
LEARN TA! At MBA we teach technical analysis from the basics up, learn to trade with our veteran traders with a community of 200+ other traders;
Link in profile description!

Cardano ADAUSD Bullish OutlookCardano is consolidating withing an ascending triangle pattern, with a price target of around 0.05$ in the near term. This pattern will be confirmed with a breakout in price and volume to the upside (resistance level between 0.036$~0.037$).
This is not financial advise, it's just my own opinion.
I also like to keep track of my trading ideas.

Cardano IdeaCardano has formed a strong horizontal range on the BTC pair, which has recently seen some bullish movement
Fibonacci spiral shows a clear head and shoulders pattern on the BTC pair
On the USD pair movement upward can be expected between the two fib spirals
And a bullish rising wedge?? Maybe..

Cardano looking for a breakout of actual fibo resistanceHello there, this is our view on ADABTC, enjoy!
Analysis:
-On chart:
Basically a small uptrend started after breaking out a big falling wedge. Price has just bounced from historical support and historical support trendline, so it needs to jump from there or die out (in fact fibo retracing would send it to 400 - 310). Price managed very well to break above ema50 and further movement upwards is expected once it has definetely broken out ema100 and wma200, targeting first of all ema200 and then fib and weekly resistances. Currently accumulating over the mid band. Also width looks bullish this term. Ichimoku cloud, bullish itself, doesn't give any clear signs of strenght in order to support price now.
-Technicals:
On the other side oscillators are giving strong signals that a complete reversal has occurred. In fact many of them (chaikin, money flow, relativestrenghtindex, stochastic, ultimate) are growing in an uptrend from oversold. Tho some of them are now witnessing a little overbought, in particular stochastic, ultimate and chaikin, which also formed a bear divergence with price. Stochastic relativestrenghtindex looking for a golden cross which will state a complete resistance breakout. While awesome is stating a good momentum, run up is losing strenght and buyers as states movingaverageconvergencedivergence, whose momentum is neutral. In fact, both of the indicators are showing a lack of momentum now, and also indicating a weakness by forming bear divergences with price. Their uptrend support is still holding so no clear reversal has taken place.
Notice there are very few volumes.
Strategy:
We started approaching double strategies as Binance is giving us margin to try both of them. If 1. was negated, then try 2..
1. Entry (long): 476 - 469 - 463 (average 469)
Target (short-term): 504 - 511
Stoploss: 460
Risk/reward: 4.33
Hint: that's a lot! I tend to stay bearish until my trade is far away from stoploss, but that sounds very good to me, so I would recommend you should long 3x 5x margin.
2. Only if trade 1 goes stoploss
Entry (short): 469 - 479
Target (short-term): 444 - 435
Stoploss: 487
Risk/reward: 2.69
Hint: low r/r ratio, you should adopt a thorough money management (I linked a nice educational image from Excavo).
Disclaimer: this is not a trading advice as it could seem like, we're just enjoying ourselves and spending our time onto this activity. Don't ever trade money you can't afford to lose. Don't do such a trade if you're not self-conscious about what you're doing. If cryptocurrencies are not regulated in your country use them only for speculative interests until they'll be. Feel free to ask us every question you have.
Trade safe and stay at home. Anlvis

Cardano buy areaCardano USD pair has formed a falling wedge this a bullish pattern. Amid the falling wedge their is a large resistance zone, above this resistance is a nice possible buy point. 3 Waves down can also be observed (highlighted in red) if a breakout doesn't occur to the upside a drop creating the third wave down and consequent double bottom is likely.

ADABTC: Global support could be broken soonADABTC tested global support 5 times, for how long will it hold?
I like the project, tech side, but as a trader don't touch this, I think the next test could provoke a big dive.
Information is just for educational purposes, never financial advice. Always do your own research.

ADABTC formed bullish BAT | Upto 16% bullish moveHi folks, hope you are doing well. In my previous post on Cardano with Bitcoin pair we have seen that the ADA had completed the formation of bullish BAT pattern. This chart was based on 12 hour time period and as per Fibonacci sequence of BAT I predicted that the price action should move up from the potential reversal zone of this pattern to enter in the Fibonacci projection area of A to D leg from 0.382 to 0.786 Fib projection level.
Then we have witnessed that the price action moved up and entered in the target sell zone. This time the Cardano gave more than 20% profit for its traders on a short term 12 hour chart.
A new harmonic BAT pattern:
This time again on 12 hour chart ADA has formed another harmonic bullish BAT pattern and entered in potential reversal zone. And giving another chance to earn more profits.
Let’s dig the pattern deeper to see how perfect it has been formed.
After initial leg (X to A) the A to B leg is retraced between 0.382 to 0.50 Fibonacci and then B to C leg is projected between 0.328 to 0.886 Fib of A to B Fibonacci projection area and last leg (C to D) is retraced between 0.786 to 0.886 Fibonacci level.
Buying And Sell Targets:
The buying and sell targets according to harmonic Butterfly pattern and its Fibonacci sequence should be:
Buy between: 0.00000441 to 0.00000431 sats
Sell between: 0.00000465 to 0.00000501 sats
So this short term trade can has capacity to produce upto 16% profit.
Stop Loss:
The potential reversal zone area that is up to to 0.00000431 sats can be used as stop loss in case of complete candle stick opens and closes below this level.
Note: This idea is education purpose only and not intended to be investment advise, please seek a duly licensed professional and do you own research before any investment.

ADA at strong supportWhile the world economy fall apart, crypto market also experience bearish mood, while still look much batter than S&P500 or any other index. Will crypto become safe heaven or not, impossible to predict, but it will certainly be the one to pump hard once situation with virus normalize.
ADA price at support left since December'19/January'20. Used to be strong support, but since already cut through on last big dump, lost some of its strength. Still a good spot for a bounce.
And week timeframe

ADAUSD formed bullish BAT | Upto 40% move expectedHi guys and gals hope you are doing good, Cardano (ADA) is giving another long opportunity on 2 day chart and has formed bullish BAT pattern and entered in potential reversal zone and ready to move up at any time from here.
The dimensions of pattern:
After initial leg (X to A) the A to B leg is retraced between 0.382 to 0.50 Fibonacci and then B to C leg is projected between 0.382 to 0.886 of A to B Fibonacci projection area and last leg (C to D) is retraced between 0.786 to 0.886 Fibonacci and now the price action is moving in potential reversal zone of this bullish BAT and now we can expect bullish divergence at any time which will lead the priceline between 0.382 to 0.786 Fibonacci projection of A to D leg.
Buying And Sell Targets:
The buying and sell targets according to harmonic BAT pattern should be:
Buy between: $0.0393 to $0.0352
Sell between: $0.0493 to $0.0493
Stop Loss:
The potential reversal zone area which is up to $0.0352 can be used as stop loss in case of complete candle stick closes below this level.
Note: This idea is education purpose only and not intended to be investment advise, please seek a duly licensed professional and do you own research before any investment.

ADA is being retraced after one and a half month bullish moveIn Aug 2019 I posted an article where I revealed that the priceline of Cardano was forming a shark pattern.
RSI had still some cushion to move in oversold zone and moving average convergence divergence (MACD) was still strong bearish, therefore there was more possibility that the price action will definitely complete the final leg of Shark which was being formed at that time below was the article:
As per Fibonacci sequence the targets were as below:
Buy between: $0.04315 to $0.02760
Sell between: $0.05788 to $0.08991
As per above targets this trade had potential to produce upto 255% gains.
Finally we witnessed that since Dec 2019 to Jan 2020 the priceline of ADA moved up and sofar it has produced up to 138% profit.
Price Correction Started After One And A Half Month:
If we examine the price action of Cardano then it will be realized that since 1st Jan to 14 Feb 2020 there the ADA was moving up in a very bullish manner that there is not even a single red candle stick appeared during this period even it has broken down all simple moving averages from 25 to 200 during this period every professional trader was expecting a price correction move which the Cardano was not making even with every day the buying volume was more being increased that was a clear indication that bull has completely taken over the bears and they are in charge now.
The Moving Averages And Their Bullish Formation:
Now if we move one step back from 2 day to daily chart then here the simple moving averages with time period of 25, 50, 100 and 200 have almost formed an alligator’s bullish opened mouth there is only one move left and that is the golden cross between 100 and 200 SMAs once this bull cross will be formed we can witness a new and more powerful bull rally like once it was happned in April 2019 when Cardano gained more than 80% value from $0.5910 to $0.10687.
Similarity Of Moves Of Price Action:
Now if we switch back to 2 day chart again then in previous move we can see some resemblance with current move when the price action moved up without any price correction from 4TH Mar to 3rd April 2019 and then ADA dropped upto 0.618 (61.8%) Fibonacci level which is considered as ideal drop or retracement among professional traders and Cardano also had a 50 simple moving average support at this leve, and the price action took bullish divergence from this level achieved higher than previous high.
This time the price action is seems to be taking the same move as we can observe that it has moved up from jan to Feb 2020 without any correction and now it is being retraced.
Sofar it has achieved 1st level of ideal retracement upto 0.382 (38.2%) Fibonacci but this time the ADA is in more stronger position than previous move coz from Mar to April 2019 the price action did not have the 200 SMA support even at that time the 200 SMA moving down from a long distance above the price action but this time we have 200 simple moving average support between 0.382 to 0.50 (38.2% to 50%) Fibonacci level therefore this time there are more chances that the priceline will start upward move after taking bounce from 200 SMA and that moving average this time lies at $0.5492.
So most of the professional traders might set this 200 simple moving average as their stop loss and most of the traders may place their buying positions at this level by setting the same 200 SMA as their stop loss.
Conclusion:
At this time there are two decision making levels one is simple moving average 200 and the other one is Fibonacci level of 0.50 (50%) if the price action of Cardano will be successful to retest these levels as support and bounced from here then we may see more powerful bull rally which will lead to achieve an higher than the previous high but if the priceline won’t be successful in retesting these levels as support then we may see the drop up to 0.618 Fibonacci level which is at $0.04753.

ADA gonna test the support it gainedBuy zone => 536-546
Stop Loss => 2x 4H candle closes (unseparated by a reversal candle) below the buy zone
Target => 690

#Cardano | USDT Breakout !#ADAUSDT
We notice that the price has breached the descending channel, and we expect a period of bullishness in the coming weeks for the #ADA coin
Do not hurry to buy, the price may go down to good places
Do not risk a large amount of your money
Please share your opinion in the comments box and do not forget to press the like button
Add to watchlist

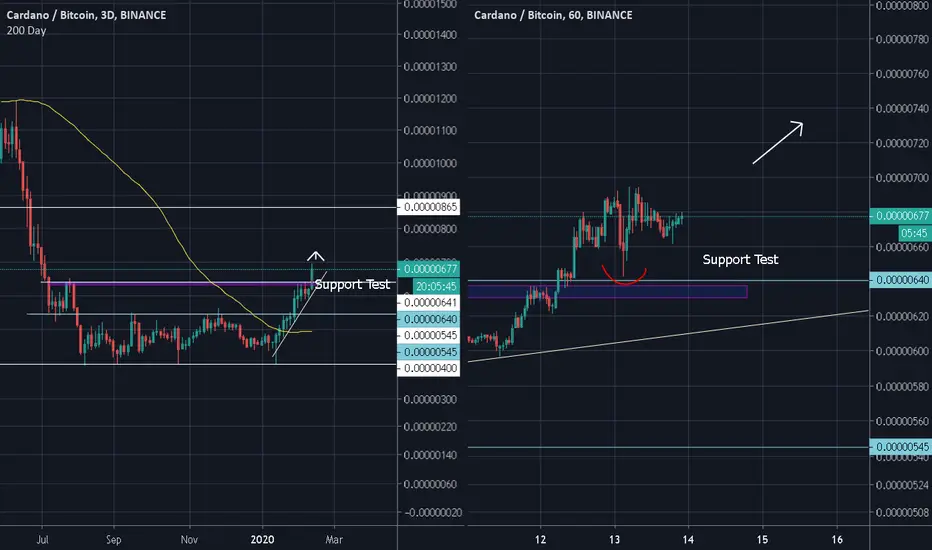
ADA/BTC IdeaWe have broken through resistance held back from July 2019 and have retested on the 1 hourly. I expect continuation towards the upside if we can hold this as a new support area