Cardanoanalysis


ADA Short-term (hourly)BINANCE:ADAUSDT
According to the previous path of ADA, I think Cardana is going up to 0.157; Afterward, it is falling down around 0.14.
Then after 3-4 days later (at 29 July), It pumping up again to 0.20
(no Financial advice)

ADA hitting .10 resistance, head bump ADA eyeing the short side, profit taking correction
RSI lower lows
MA just crossed
TP support level .091
Stop loss placed at .1015 levels
KUCOIN:ADAUSDT
Not Financial advice, for educational purposes only.
DYOR

ADA now in a bullish structure. Pullback and then take off. ADA has broken Bearish Weekly Structure, as a result, we can confirm the beginning of a Bullish trend
Now looking for a minor pullback to grab liquidity at my yellow target at $0.05-0.052 followed by a move to $0.113
Once we pullback We will see a phenomenal long opportunity - an easy 50-60% return
Market Structure is key.
Hope This Helps.

Don't miss the great buy opportunity in ADAUSDTTrading suggestion:
. There is a possibility of temporary retracement to suggested support line (0.0785). if so, traders can set orders based on Price Action and expect to reach short-term targets.
Technical analysis:
. ADAUSDT is in a range bound and the beginning of uptrend is expected.
.The price is above the 21-Day WEMA which acts as a dynamic support.
. The RSI is at 59.
Take Profits:
TP1= @ 0.0904
TP2= @ 0.1011
TP3= @ 0.1135
TP4= @ 0.1555
SL= Break below S2
❤️ If you find this helpful and want more FREE forecasts in TradingView
. . . . . Please show your support back,
. . . . . . . . Hit the 👍 LIKE button,
. . . . . . . . . . . Drop some feedback below in the comment!
❤️ Your Support is very much 🙏 appreciated! ❤️
💎 Want us to help you become a better Forex trader ?
Now, It's your turn !
Be sure to leave a comment let us know how do you see this opportunity and forecast.
Trade well, ❤️
ForecastCity English Support Team ❤️

ADA Moves Towards The Range HighExpecting ADA/BTC to move towards the range high at 620 satoshis. All explanations are in the chart.
Please leave a like and comment if you enjoyed the analysis.

ADAUSD - Which side are you on?--- Please if you find this informative and/or agree with the idea don't forget to give a like. Thank you! ---
It seems that after again testing recent highs in early May, Cardano is sort of waiting for a big move, as other coins are as well. It is just matter of strenght!
It is slightly looking for the resistance level formed by the highs of June 2019 and February of this year.
To be honest, it would take a couple of days in green to reach the 0.786 level and consolidate that area for more growth. On the other side you already know what there is. ;)
In a two-hour view we can see how right now it is trying to return to the highs of April 30, with rising RSI and without being oversold. So far, so good.
We leave this analysis before the imminent supposed golden cross in a few days is completed and thus be able to see the result.
And which side are you on?
Thanks for your appreciation.

ADABTC Buyer recovery before continuation First of all, congratulations to all who followed my ADABTC call ! 10%+ gains a day keeps the doctor away!
After letting the dust settle, I will only be looking for SHORT re-entries on ADABTC, will be looking for continuation patterns aswell as weak buyer recovery for confirmation in order to make a final decision on the re-entry. IDEALLY we would be looking at a slow & weak buyer recovery over the next few days up to the golden pocket range for Fibonacci between 0.618-0.65 in order to take our SHORT orders for the next leg down.
If bullish buyback seems extra weak, I will be looking to DCA my entries from the 0.5 Fibonacci line upwards to the 0.618-0.65 golden pocket.
TP's on the way down we will be looking at structures to the left, 555, 540, 525 & FINAL TP within 507->500 golden pocket zone of our initial swing low to high uptrend.
If we reach the zone between 507-500 & the zone holds as support I will re-assess to take LONG's from this retracement.
LEARN TA! At MBA we teach technical analysis from the basics up, learn to trade with our veteran traders with a community of 200+ other traders;
Link in profile description!

CARDANO (ADAUSD) DailyDates in the future with the highest probability for price direction reversals

#Cardano | USDT Breakout !#ADAUSDT
We notice that the price has breached the descending channel, and we expect a period of bullishness in the coming weeks for the #ADA coin
Do not hurry to buy, the price may go down to good places
Do not risk a large amount of your money
Please share your opinion in the comments box and do not forget to press the like button
Add to watchlist

💎 CARDANO/USD - Very bullish pattern right here! STRONG BUYHello everybody!🧑🏻🚀 If you like this chart THUMB UP!👍 CARDANO shows very strong pattern name "Ascending Triangle". Also we can see Stochastic RSI in the beginning of rising.
With a strong crypto market we can see the breaking of the triangle and jumping to the drew level!
Good luck! All targets on the chart!
___________________________________________________________________________________________________________
Subscribe to my channel and receive fruitful recommendations regularly!
😎 Here just clear and accurate ideas🎯! Max profit idea in crypto - 20%(BTC), Max profit in stock - 40%. Total profit more 300%. Trade my own funds. Consult privately🎩. Link to table with summary results: clck.ru

Possible 50% return on ADA CardanoWe see ADA testing the median line of the Inside Pitchfork, but nicely rejecting the downtrend.
If ADA can hold above the trend line it may shoot for the median line of the Original Pitchfork
for a 50% roi.
Possible targets to take profits are around:
- 0.063 at the 1:1 extension based of the proposed wave 1
- 0.066 around de negative 0.618 fib level
- 0.075 around the 0.382 of the impulse started dec. 2018
- 0.081 around the median line of an original pitchfork and a 1.618 extension

ADABTC Prolonged Diamond TopProlonged diamond top, some symmetry can also be observed which is common with diamond tops and bottoms. Little price action has been observed in ADABTC, will the recent move change this?
Cardano Technical Analysis:Daily Timeframe Chart PatternsConclusion for today’s Cardano analysis: Price closing above ~0.00000520 is bullish for Cardano (ADABTC).
A log scale on the Daily timeframe is used to present today’s Cardano analysis. Data from April 04, 2019 to current date indicates a dominant downtrend, part of which was a falling wedge (diagonal). The wedge lasted over 4 months before price broke out to the upside on August 22, 2019, and therefore confirming the bullish implication of the chart pattern.
Cardano price has moved in a sideways fashion ever since breakout occurred outside the wedge. The ranging price action has lasted over 2 months and is described in this analysis as a rectangle bottom chart pattern. The implication of the aforementioned pattern is ideally bullish and suggests that prices will eventually resolve to the upside.
The top and bottom of the range is marked on the chart as 0.00000520 and 0.00000388 respectively.
Price closing below 0.00000388 decreases the chance of higher Cardano prices and rather suggests more selling. The 200 Day moving average of Cardano is also plotted on the chart to help monitor price level of possible resistance upon breakout to the upside.
Prices eventually moving above the moving average would argue for further improvement in bullish momentum.

Cardano's ADA has a small opportunity for us.Further structure must come up first to surplus us with better projectiles.

Cardano (ADA) -ADAUSD- Technical Analysis - 450% Profit ExpectedCardano (ADA) - ADAUSD - Technical Analysis - 450% Profit Expected
Very Nice Trading Coming Ahead.
Based on AB=CD pattern, Time Ratio & Gann Analysis, It's a potential long position with great returns :)
In a lower time-frame (4hrs) this long position has also been confirmed.
Target Profit Range - 0.038-0.12
(58%-450% Profit Expected)
TP - 1 - 0.038
TP - 2 - 0.046
TP - 3 - 0.059
TP - 4 - 0.069
TP - 5 - 0.086
TP - 6 - 0.097
TP - 7 - 0.12
Buying Zone! Long Position
Early Entry Trigger Point - 0.024 - 0.03
Ideal Entry Trigger Point - 0.018 - 0.023
Adjust your Stop Loss according to your lot size,
account equity, strategy & money management.
***If you want to get in this trade from this point 0.0384 you can still make 17.2% profit till TP2 is reached, however, there is a very high probability that price may continue to move down towards my ideal entry point., It is recommended to enter with a smaller lot size if you want to go long right away & manage your stop loss accordingly.
Good Luck.!
Disclaimer - This is not financial advice. This is my personal view and analysis of this chart.
If you follow this idea please plan your trade according to your lot size and account equity.
Don't forget to like, comment & follow, If you agree with my analysis :)

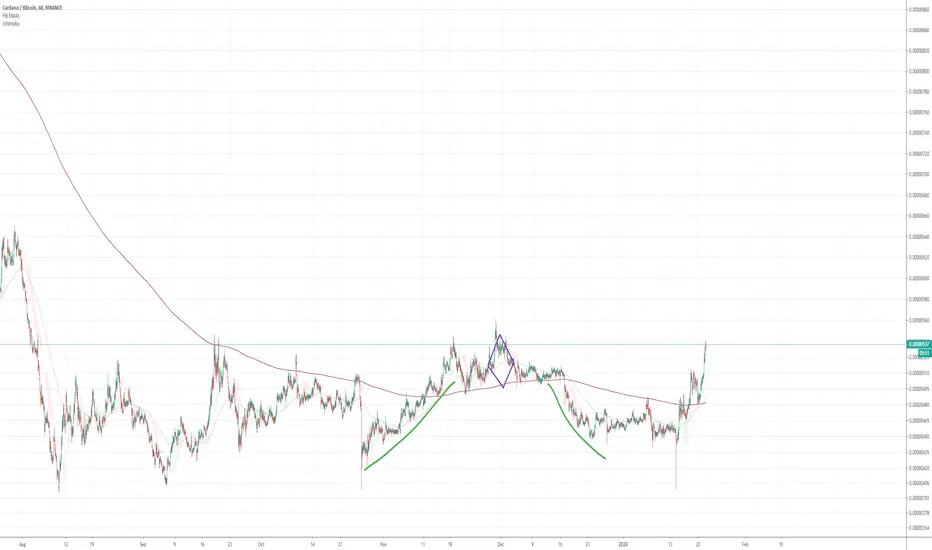
ADA's ConsolidationCardano might have broke its ascending triangle, but this won't bring cardano any higher from its current price. This ascending triangle just looks awful and a tumor hanging from the bigger triangle.
