Cardanobitcoin

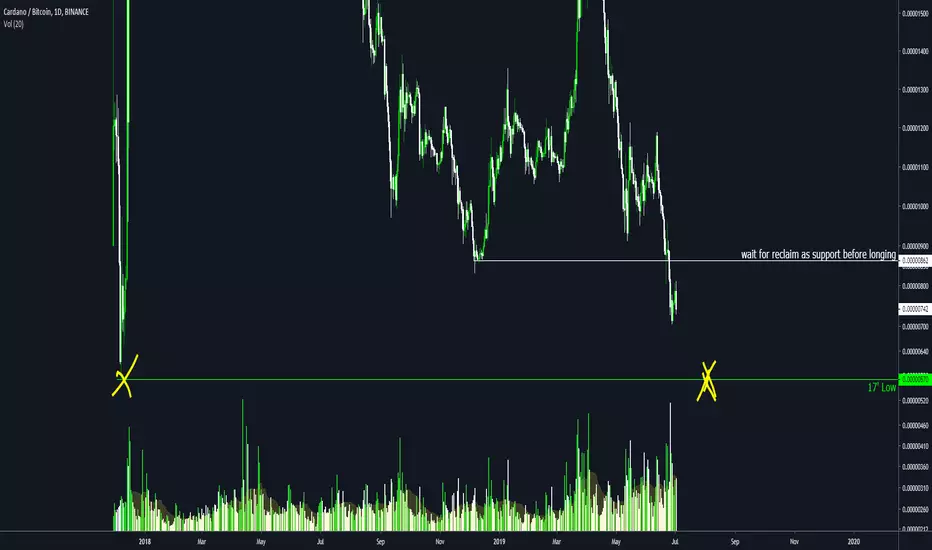
A more in-depth view of ADAOkay i know I've been harsh on ADA the last few days.
Let's look at the positives:
- Falling Wedge pattern (bullish)
- Bullish Divergence
- MACD close to flipping green
- Sell volume decreasing
- Approaching big historical supports
- Slow bleed from 9000 sat ATH to 600 sats
580 sat zone is ideal entry to go long. Can scale in from now though if you'd like.


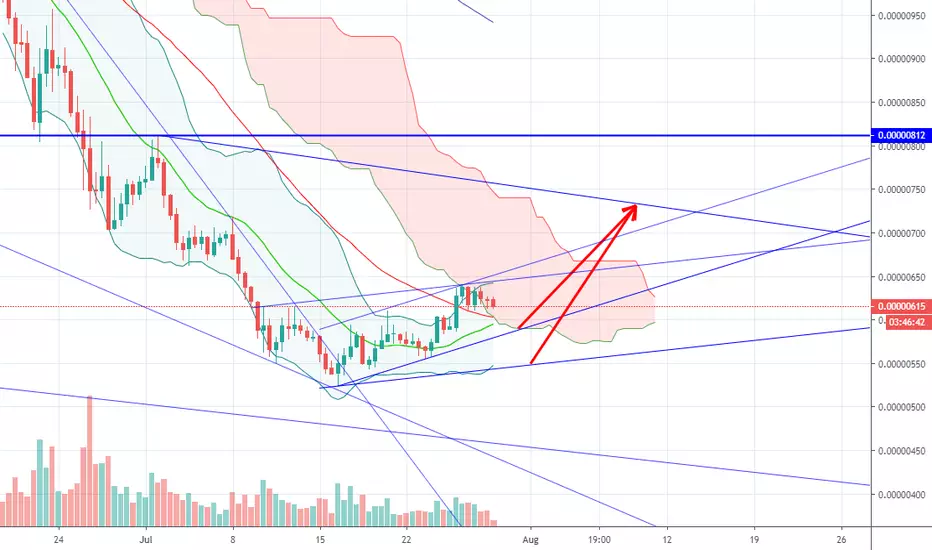
ADA Strategy$ADA
Thoughts in chart. Also, if you're long here, please keep an active stop-loss at all times. If $BTC decides to show some serious strength, where do you think this might head?

[ADA - SHORT] ADA/BTCJust simply supply and demand. Be water my friend. Don't be a Retail Trader.
My Personal Perception.
Trade on Your Own Risk.
Have a nice day! :) Leave your comment below> I am open for any discussions :) <3

ADA / BTC PT 1 Hit, Daily Long Sqz Fire, Looking Higher This is retrospective and I apologize have been busy in my day to day but want to start sharing more thoughts here.
We had a beautiful 4 hr long sqz that is now playing the same on the daily.
Accumulation in the red box *Do not enter here*

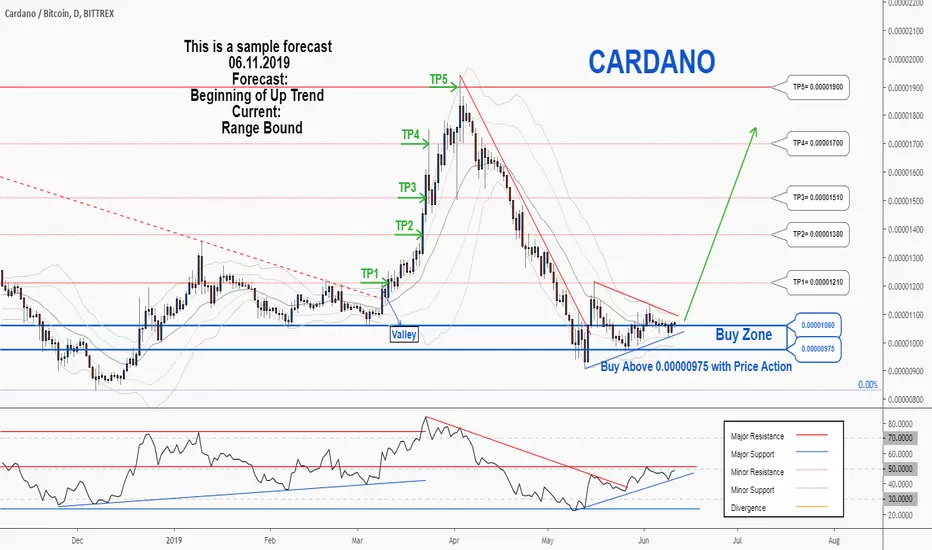
There is a trading opportunity to buy in ADABTCTechnical analysis:
. Cardano/Bitcoin is in a range bound and the beginning of uptrend is expected.
. The price is above the 21-Day WEMA which acts as a dynamic support.
. The RSI is at 50.
. While the RSI downtrend and the price downtrend in the daily chart are not broken, bearish wave in price would continue.
. The RSI downtrend and the price downtrend in the daily chart are broken, so the probability of the resumption of an uptrend is increased.
Trading suggestion:
. There is a possibility of temporary retracement to suggested support zone (0.00001060 to 0.00000975). if so, traders can set orders based on Price Action and expect to reach short-term targets.
Beginning of entry zone (0.00001060)
Ending of entry zone (0.00000975)
Entry signal:
Signal to enter the market occurs when the price comes to " Buy zone " then forms one of the reversal patterns, whether " Bullish Engulfing ", " Hammer " or " Valley " in other words,
NO entry signal when the price comes to the zone BUT after any of the reversal patterns is formed in the zone.
To learn more about " Entry signal " and the special version of our " Price Action " strategy FOLLOW our lessons:
Take Profits:
TP1= @ 0.00001210
TP2= @ 0.00001380
TP3= @ 0.00001510
TP4= @ 0.00001700
TP5= @ 0.00001900
TP6= @ 0.00002440
TP7= @ 0.00002800
TP8= @ 0.00004020
TP9= Free

ADA - BULLISH LOOKADA starts to look really juicy. The BTC is in sideway mode and that's what the alts need so much.
We can see in chart a double bottom with higher low which might be the end of wave 2 of the bigger degree.
So, we may count that the greater move of the wave 3 is ahead of us. This wave will consist of the waves of lesser degree.
I am pointing out the red zones that seem important to me and I see them as my targets. These zones represent the resistances and lvls of the Fib extension.

Cardano/Bitcoin/Tether #ADA $ADA #BTC $BTC #USDT $USDT (13 May)ADA is having good conditions to increase strongly in the coming time, but it's not yet a good buyzone to hold long-term
If you don't have ADA, you can buy it at 1000sts or 0.067$ and target can reach 20-30% profit at 1450sts or 0.1$
Stoploss if price is lower than 930$ or 0.059$

Cardano (ADA/BTC) looks ready to catch up with BitcoinADA saw a sharp bounce from support zone at 969 sats (weekly bullish orderblock).
As price action develops, it will be an easy ride up to 1358 sats.
- Support: 1002 and 1060 sats
- Target 1: 1358 sats
- Target 2: 1883 sats
Stop loss below 969 sats.
Keep it simple, cheers!

Nice extra 5.4% short on good old ADA!Continuing these shorts against Bitcoin at the moment. My 2021 bitcoin forecast is pretty gloomy but I imagine the alts will be first to head back to non-existent/ pre-2017 levels.
Best regards,
Grey

ADA/BTC - VERY BEARISHTarget: 0.00000850
Blue triangle indicates the current range.
Green box is buy.
Red box is sell.
Blue line indicates potential support/resistance .
Red line indicates t/p.
This is a log chart.
This chart is made using fib channels.
This is not financial advice. All charts shown on my page, including this one, are just for fun.
If you enjoy my ideas please give this post a like and follow my page if you would like to see future posts! :)

$ADA #LoadThePump Edition - Day Trader ExplainsLadies and Gentlemen,
Welcome back to TJs' Trade Corner!!
Today, we will be taking a look at $ADA. One of my long time favorites as many know. It is always amazing to see how technical and predictable $ADA is.
Now, lets get started and not waste any more time.
First thing as always, what is our market structure? What can we see? What happened?
As you see on most Coins at the movement, we had a nice ascending triangle, which had its resistance tested twice and then finally broke out to the upside.
Some might say it was an iHnS, yet that looked very scuffed and had not all the correct technicals for it.
After the break of the resistance at 1275, we saw an amazing rally of +50%. Obviously, straight out of the bear market, 50% is amazing and we had to get a retrace. Here the question was, retrace to what level? A fib level? The previous resistance? Or the previous uptrend support?
Well, since $ADA is our beloved child, it is all of them at once.
As you can see on the chart, the candles are approaching exactly the level of 1259/60 where the previous resistance (red), the previous support (green) and the 61.8% line (yellow) cross each other.
Important to notice here is, fibs are applied at the December low and the yearly high. I can see how somebody would apply it at the 1055 Double bottom, yet doing that one has to cut edges at the top and does not get such a clear picture.
Next one is Volume.
We see very dominant and significant volume on the buyers side, before the drop. Yet, during the retrace, we have no significant volume, apart from today. This means that we will either go down more tomorrow, or if we get significant buy volume tomorrow, the sell-off will come to an end.
Next to TJ-Stoch.
Funny enough, it looks pretty much the same on the 3D as on the 4H time-frame. Approaching the 40p for the next impulse move. Nevertheless, on the 3D the rejection at the 40p line would be way stronger for the D% line, or at least a crossover at or above 40p. Either way, an impulse move is very likely.
Something watch out for.
Sure, it looks very bullish and beautiful, yet we have two dangers to overcome. These would be the possibility that the tripple support does not hold and we just dump through. The second one, would be that this is the set-up for a very rare inverse Cup and Handle formation. Yet, for this one we will see if we have on the bounce continuation patterns or reversal patterns.
This trade has been published before in my private learning group "ETG".
We are going over many observations and possible trades very frequently.
It is meant for only those who are really interested in becoming a self sufficient trader and learning about all the secrets of trading.
Should you be interested in ETG or the indicators I use, join my discord channel and say hi in chat, then I will give you a free trial for which you might be interested.
Like and Follow me and you will find the space interesting because I am a TA expert and professional day trader in crypto since 2012 that does daily updates and new posts about the hottest and most discussed coins.
Cheers TJ

WILL CARDANO KEEP BLEEDING ?? Hi Folks,
Based on TA and how Cardano keep moving Downtrend we probably see red~days still.
I will be watching Demand Zone. If you got closer to 4H chart you will see strong order flows and I think we will reach that target.
Hope to say otherwise but I still see Blood on the chart

ADA Again In Buying Range..!!#ADABTC (Binance)
ADA Is in Bearish Phase & Looking Good For Accumulation ..
Both Buying Zones Are Mentioned In Chart..
Be Safe & Buy As Much As You Can In Dip..
SOON it'll Reverse So Buy & Hodl It..
Introducyion..!!
Cardano (ADA) is a decentralized platform that will allow complex programmable transfers of value in a secure and scalable fashion. It is reportedly the first blockchain platform to evolve out of a scientific philosophy and a research-first driven approach, and one of the first to be built in the Haskell programming language. Cardano is developing a smart contract platform which seeks to deliver more advanced features than any protocol previously developed. The development team consists of a large global collective of expert engineers and researchers. The protocol reportedly features a layered blockchain software stack that is flexible, scalable, and is being developed with the most rigorous academic and commercial software standards in the industry. Cardano will use a democratic governance system that allows the project to evolve over time, and fund itself sustainably through a treasury system.
Hit Like & Follow Me ..
Thanks For Your Time..!!


ADA CARDANOAll in Graph.
Nothing to short on this coin.
First Target 1800ish
Second Target 2400ish
Check BTC movements as always.
Happy Tr4Ding !

Cardano(ADA) latest update1 Key Highlights
* Following uptrend channel since December' 2018 and moved 100%+ against BTC(satoshi) pair.
* Trading above 200D-SMAs and Ichimoku cloud on Daily time frame.
* Bearish(sell signal) signs indicate slight correction ahead to levels defined on the chart below.
* Correction downward can provide an opportunity to buy the asset for the long-term hold.
* Pair has moved 60 percent up since last post
Cardano coin has been a runner since December'18 and is in strong bull trend while moving 100%+ against Bitcoin(Satoshi) at the time of writing but will the coin rise more?
Few of the catalyst supporting the uptrend:
* Ledger Nano S wallet support to cardano(ADA) coin.
* Binance adding ADA trading pairs.
* Shelly release on Test-net and Mainet during second quarter(Q2).
If we look at the cardano coin forecast analysis today then we might see a slight correction downward in the coming days which might provide an opportunity for late buyers to enter the asset for a long-term hold.
Let's look at cardamon coin technical analysis 2019 on its Daily-time frame chart.
* Risk taker buyers can look for preliminary support area around 0.00001470 satoshi to enter the asset for mid-term hold.
* If this preliminary support level doesn't hold then one can look for potential resistance turned support(S/R Flip) area around 0.00001337-0.00001376 satoshi to set their bids for a safer entry.
* Sellers can look for areas at resistances(sell zones) around 0.00001920-0.00002000 satoshi (short term) and 0.00002243-0.00002406 satoshi and 0.00002701-0.00002778 satoshi (long-term).
* Breaking down below the last support area around 0.00001102-0.00001112 satoshi would be strong bearish(sell signal) for the asset.
Further cardano coin price analysis suggests that it has crossed the 200D- SMA (simple moving average) on Daily with bullish cross-over of 10 and 20 EMA (exponential moving average) on weekly. These are quite healthy signs for the bulls.
MACD and Stoch-RSI indicator on Daily time frame showing signs of weakness leading to a healthy correction in the coming days but that doesn't make the pair strongly bearish.
3 Conclusion All-Time
Cardano coin has been the top rising cryptocurrencies and its price seems to be in a bullish trend in the long-term with future looks bright because of the upcoming catalyst of launch of Shelly protocol on Test-net and Main-net during Q2'2019.

