CATI/USDT – Massive Descending Trendline Breakout?🔎 Overview:
CATI/USDT is flashing a major trend reversal signal after months of accumulation and suppression under a dominant descending trendline. For the first time in almost 10 months, price action has successfully broken out of the downtrend, potentially setting the stage for a multi-layered bullish rally.
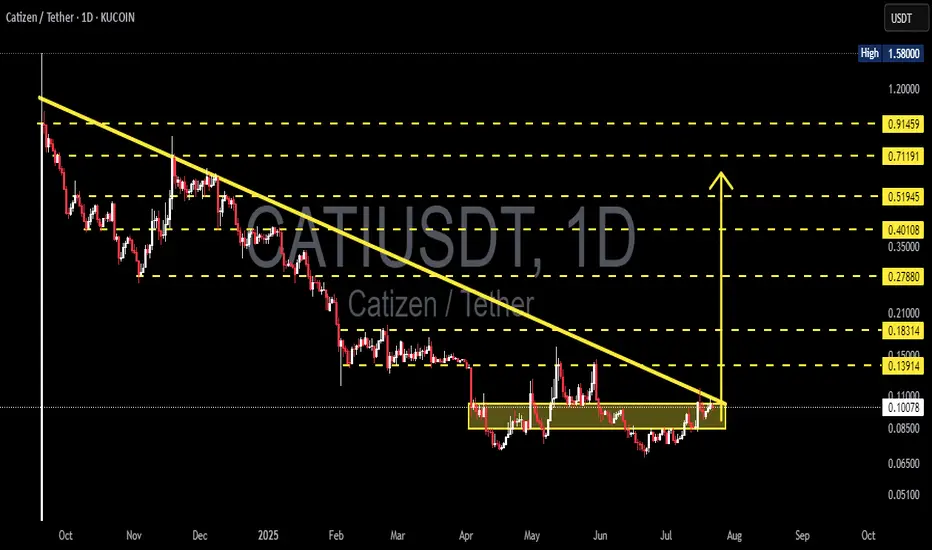
This breakout is not just a technical level — it’s a psychological shift from bearish to bullish sentiment. The consolidation zone between $0.065–$0.085 has acted as a solid accumulation base, and the breakout past $0.10 marks the beginning of a new phase.
📐 Chart Pattern Explanation:
🔻 Descending Triangle Breakout
Structure: Long-term lower highs with a flat support base.
Breakout Point: Around $0.1029, breaking the descending trendline cleanly.
Volume: A potential rise in volume post-breakout would confirm the breakout’s strength.
Target projection: Based on the height of the triangle, the potential move could extend above 200%.
This pattern is often seen at the end of a downtrend and signals a strong bullish reversal, especially when paired with horizontal accumulation like we see here.
📈 Bullish Scenario – Road to Potential 8x Gains:
If the breakout holds and gains momentum:
✅ First Target: $0.13914 – Previous local resistance.
✅ Second Target: $0.18314 – Strong resistance cluster zone.
✅ Third Target: $0.27880 – Clean psychological and structural target.
✅ Mid-term Target: $0.40108 to $0.51945 – Major Fibonacci level and previous breakdown area.
✅ Moon Target: $0.71191 to $0.91459 – If trend extends with volume and market-wide bullishness.
These targets are based on measured move projections, Fibonacci extensions, and historical price memory.
⚠️ Bearish Scenario – What Could Invalidate the Breakout?
❌ False breakout risk if price falls back below $0.095.
❌ A rejection candle or long wick at $0.13–$0.14 without volume could signal exhaustion.
❌ If Bitcoin or broader market faces correction, CATI might retrace to its base at $0.065 or even revisit $0.051.
Traders should watch for bearish divergence or sudden drop in volume as early warnings of reversal.
🧠 Strategic Notes:
Entry zone: Retest of breakout at $0.095–$0.102 could provide a low-risk entry.
Stop loss: Below $0.085 for conservative risk management.
Position sizing: Scale in during pullbacks. Don’t ape in full at resistance levels.
This setup has the classic ingredients of a low-cap altcoin explosion if momentum sustains.
🔥 Final Thoughts:
CATI/USDT is breaking free from its bearish chains and entering what could be the early stages of a parabolic move. With a textbook breakout pattern, clean structure, and well-defined levels — this is one of those charts traders dream of spotting early.
Keep your eyes on volume and structure — this could be one of the hidden gems of this cycle.
#CATIUSDT #CryptoBreakout #AltcoinGems #TechnicalAnalysis #BullishSetup #CryptoTrading #PriceAction #DescendingTriangle #BreakoutPlay #ReversalPattern
Catiusdtidea
CATIUSDT Analysis: Anticipating a Potential Price CorrectionHello traders!
Following a significant price drop, CATIUSDT appears to be poised for a potential price increase or corrective rebound. This upward movement could offer an opportunity for traders who bought at higher prices or are currently holding the cryptocurrency.
The anticipated price correction is likely to target the 0.382, 0.5, and 0.618 Fibonacci retracement levels. This price increase could contribute to a rebalancing of:
1. BINANCE:CATIUSDT CATIUSDT price
2. CATIUSDT market liquidity
3. CATIUSDT open interest
I have identified potential entry and exit points, as well as resistance levels, on the chart.
Good luck!

CATIUSDT IdeaGreetings, traders.
Observing the CatiUSDT BINANCE:CATIUSDT price trend, it appears poised for a further decline after a brief corrective period. The recent touch of the $0.3200 support area, coupled with the formation of a bearish evening star candlestick pattern on the 2-hour chart, suggests a potential downward movement. This pattern emerges notably above the established uptrend line, reinforcing the bearish signal.
Short-term price targets are identified at $0.2600 and, upon a successful breach of this level, a subsequent decline towards the $0.2000 to $0.2200 range is anticipated.
A prudent entry point for short positions would be on a break below $0.3045.
Best of luck in your trading endeavors.
*Remember that this is just a technical analysis and doesn't guarantee future market movements. Always conduct your own research and manage your risk accordingly.
