Elliott Wave in a chopping situationI think I can see Elliott Wave pattern but not sure how it's going to happen in current market situation.
I think the trend is still upwards (which is great) but for next few days price will swing between support & resistance 72.300 and 74.50.
since today's run was reasonably good after 5 days of price correction.
I would be keeping an eye on tomorrow's market situation especially how it opens and closes.
I think we should expect next bull run soon.
CBA

good support at 72.300As I noted in my previous idea, that it's going to get support at 72.300, which it is getting at the moment.
As it can seen in hourly chart. At this point it is still in upwards channel but it it falls below support level it can possibly fall below the up trend channel and come down below 72.00. with current market sentiment it's bit difficult to decide to make a trade. I think I will wait see see how it looks like at market closing.
Please note these are my own notes for my reference and by no means trading advise to anyone. please do your own research before entering into any trade.


next target $74.++just my own notes, by no means trading advice to anyone. please do your own research before entering into any trade.
I think ASX:CBA shares are going to touch $74 soon.

CBA (Common Wealth Bank of Australia) potential LongBuy orders set at Support Level dating back to 2012, the Level has not been tested very often, increasing the probability of a bounce. The level also acted as a strong resistance in the past. FIB level seems the most likely target for the bounce. Possible 8.5% + Trade, with high R.

CBA to retrace back to moving average. $CBACommonwealth Bank of Australia had a good rally the last few trading days and shares likely to retrace back to the moving averages. Technical indicators such as the MACD, RSI, DMI and TD Sequentials are showing bulls are running out of energy.

Commonwealth Bank of AUS to retrace back to moving averages $CBASell or Short $CBA.
Commonwealth Bank of Australia to retrace back to moving averages.
More likely to retrace back to the 200 moving average (red line) at this stage to form an ABC correction.
Or retrace back to trendline support.

CBA.ASX finally giving inFrom everything I’ve read over the years commonwealth bank has been a widow maker for many traders looking to short. I almost bought some $65 put options earlier this year which would have expired in October. Lucky me! Any way, looks like this may finally be it. To me it looks like a big tripple top has been out in here. With the real estate market in Australia easing up a little and commbank being so heavily exposed to the housing market any dip will ravage them. Keeping in mind we have a prime minister who has taken a page out of draghis book looking to do what ever it takes to keep the Aussie housing bubble blowing.
Circled in green are our three tops. It’s also important to note the 200 weekly MA has just punched through the 20MA. There are also two lower lows as valley between our tops. A break below $70 will be the final bell.

Buy and Sell zones for Cba currently bouncing between levelsHi everybody. This is a chart showing you possible sell zones and buy zones due to resistance that we have encountered before and support which is the .618 fib level.

$CBA $70.78 short Thx for the heads up Mr Hugh HNLcapitalChart has notes on what weakness looks like

$CBA the end is nigh?Really not liking this weekly chart. Gap down outside of the support line and well below the 30 week WMA. Still 4 days in the week but if it stays outside of the trend line I think it's only down from here and possibly last time above $70.

[COMMONWEALTH BANK OF AUSTRALIA] SIMPLE SETUPSpeculative bearish setup...
If you think this analysis can be useful, leave a your comment or your LIKE!
Thank you for support and trade with care!

$CBA $70.28 doin a death roll PER requestChart has notes
Bet it doesnt stop next time it pauses on support
Too slow for me but entertaining all the same
See tls.ax for a similar slow death, now in recovery

CBA - Long - 6% by End of Year- Just a simple observation, price is bouncing around the level.
- Looking at it , it has gone up for a 2 month period then down for a 2 month period.
- Looking to go LONG , on the DAILY . So possible 6% growth by 2019 .
What do you guys think? Just by looking at the chart on the daily ?

CBA - Time for an accumulation?The price has been falling since early 2017 from the peak around $88.00.
This drop has been a "healthy" one as we are seeing this as a correction for a longer term accumulation to the upside.
Some quick fundamentals to support the upside -
1) Revenue has been increasing for the past 5 years;
2) Net income has been increasing for the past 5 years;
3) Dividends have been increasing for the past 5 years;
4) FCF has been fluctuating up and down, but has greatly increased for the TTM; and
5) Net margin has been increasing for the past 5 years.
On the technical side of analysis, $66.50 to $68.62 present a very decent area for accumulation, potentially towards $75.59 and $77.23.
We are looking at this setup as a potential dividend play trade as well, which mean we are interested to hold on to this trade for a longer term.
**This analysis alone DOES NOT warrant a sell trade immediately. Before you enter any trade in the financial market, it is very important that you have a proper trading plan and risk management approach.
The sharing of this idea is neither necessarily indicative of nor a guarantee of future performance or success.


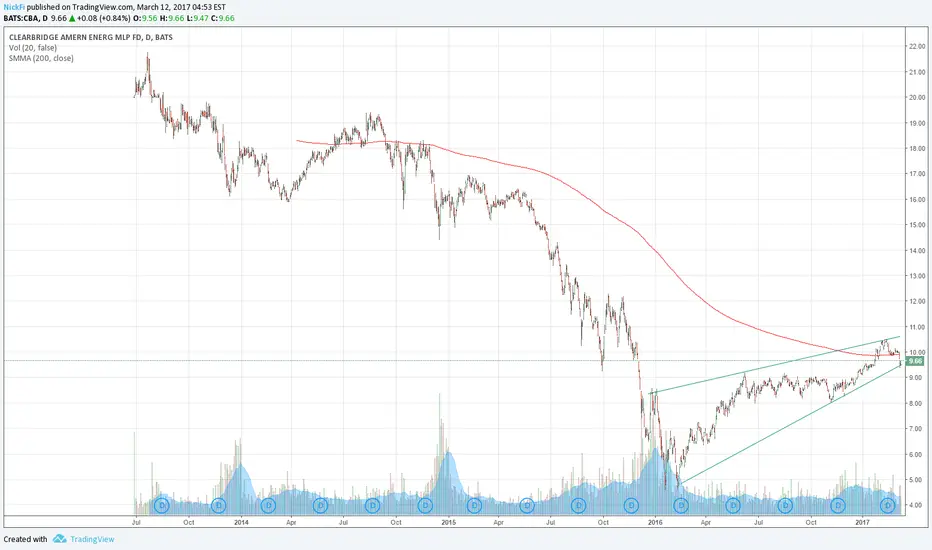
CBA at decision pointIt is obvious from the chart and trend lines that BATS:CBA has two choices - it could break down the trend and go with the long term trend to under $9. If it doesn't, it may bounce back on the support line and go above $11.