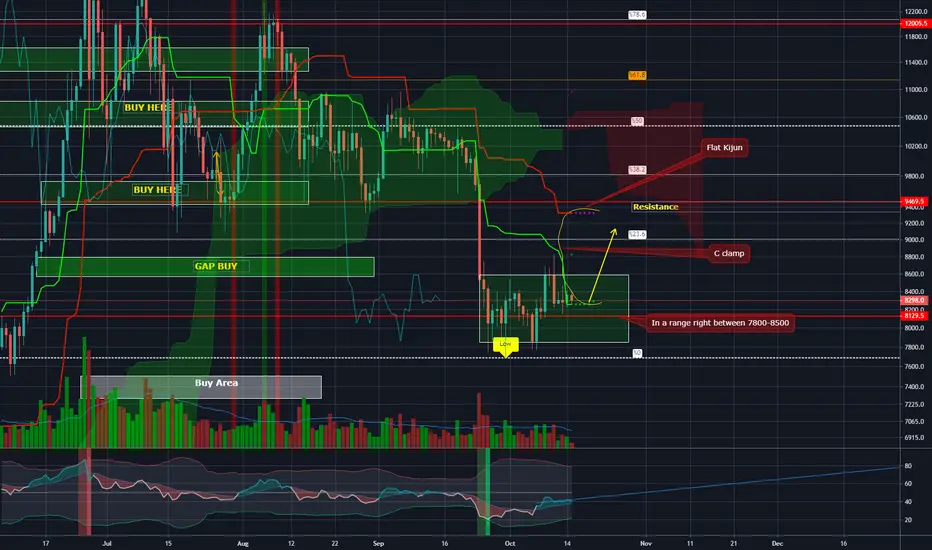
BTC's Time to Go up? C-Clamp on the 1D chart BTC has been randing between 7800 and 8500 for quite some time since the drop in late September.
We see that we had a tweezer bottom and bounced back, but came back to support at 8130. Now it has had a weak bounce but we are seeing a C-Clamp formation and the Kijun Flattening out.
Kijun is a magnet to price and so because of this and how far we are on the daily from the Kijun we will see it act as a magnet and pull the price action up.
I am targeting:
8750 and 9100 as my TP I will leave 20% just in case we go all the way and tap the kijun which is sitting around 9330.
My stop I will start at and use Evolving R around 7860.
If you enjoy the charts throw up a like!
Check me on twitter for some fundamentals as well - @coachkcrypto
Never be too scared to win, only be scared that you didn't try!
Coach K
Cclamp
Bitcoin Daily Update (day 315)Disclaimer: If you are primarily interested in copying other people’s trades then this is not for you. However, if you are willing to put in the work that it takes to learn how to trade for yourself then you have found the right place! Nevertheless please be advised that you can give 10 people a profitable trading strategy and only 1-2 of them will be able to succeed long term. If you fall into the majority that tries and fails then I assume no responsibility for your losses. What you do with your $ is your business, what I do with my $ is my business.
Click here for my Comprehensive Trading Strategy | Click here for my Comprehensive Trading Process | Click here to learn about the 2 BTC' to 20 BTC' Trading Challenge
*Using Monthly Chart*
Consensio: P < S MA < M MA < L MA
Patterns: Phase 7 hyperwave | Potential falling wedge
Horizontals: Monthly close at $3,419 is key area. Watch for it to become resistance based on February’s open
Trendline: Bear trend starting on
Parabolic SAR: $12,895 (lol)
Futures Curve: Backwardation but rapidly decreasing spread. Now 2% spread.
BTCUSDSHORTS: Looks very bullish
Funding Rates: Longs pay shorts 0.01%
TD’ Sequential: Red 7
Ichimoku Cloud: C Clamp with Tenkan-Sen at $5,800
Relative Strength Index: Has created a new all time low on Bitstamp
Price Action: 24h: -1.5% | 2w: -5.6% | 1m: -9.9%
Bollinger Bands: Bottom band is at $1,000 which is curiously in line with hyperwave’s target for the bottom.
Stochastic Oscillator: Monthly buy called the last bottom, and it is posturing for buy signal now.
Summary: This market is at a very interesting spot in my opinion. I would be feeling very bullish if it wasn’t for the spread in the backwardation curve contracting. That has me on my toes watching for a potential short entry.
However I would strongly prefer to long from here. The market seems primed to make a big bounce. Alts are poised, BTC is oversold at support. The monthly Ichimoku Cloud confirms that, with the large C Clamp. The Tekan-Sen at $5,800 is right where my target is if we can close above $4,350. Furthermore there is a strong argument for a falling wedge on the higher TF's which a target that is too high to even think about.
On the other hand there are a few things on the monthly chart that make it look like like we are closer to a bottom than it feels like. The RSI has created a new all time low on Bitstamp. The Stochastic Oscillator is posturing for a buy and it called the last bottom. That provides strong confirmation to my suspicion that breaking down from here would cause the capitulation needed to find a bottom.
While it is currently a better setup for longs, the prospect of finding a bottom sooner is a more attractive long term prospect.

Bitcoin Daily Update (day 283)I believe that it is possible to beat the market through a consistent and unemotional approach. This is primarily achieved through preparing instead of reacting. Click here to learn more about how I use the indicators below and Click here to get my complete trading strategy! Please be advised that I swing trade and will often hold onto a position for > 1 month. What you do with your $ is your business, what I do with my $ is my business.
For a variety of reasons I no longer believe that $2,718 will be the bottom of the 2018 Bitcoin’ bear market. I am now very confident that we will return to $1,000 before finding a bottom. That is due to Tyler Jenks’ hyperwave theory and the Point of Control on the Visible Range Volume Profile with > 2 year look back | Calling for $35 ETH before the end of 2018, however I do not believe that will be the bottom. Strongly expect ETH to return to single digits before the end of 2019 | Calling a top in the S&P 500 at $2,634
Previous analysis: “At this point I think it is about 70% that we remain in the channel and breakdown $3,000. That being said I do not believe that the risk:reward justifies an entry.”
Position: Short ETH:BTC 0.03109 | Short EOS:BTC from 0.0008057 | Short ADA:BTC from 954 sats | Short LTC:BTC from 0.00778 | Short XRP:BTC from 8710 sats | Short USDT:USD from $0.99
Patterns: Bear channel / hyperwave
Horizontal support and resistance: S: $3,330 | R: $3,430
BTCUSDSHORTS: Closed below 4 MA and finding resistance after bearish crossover with 9, however still above trendline
Funding Rates: Longs receive 0.0252%
Short term trend (4 day MA): Barely closed above
Medium term trend (9 day MA): Acted as perfect resistance on todays candle and continues to hold vs the current open
Long term trend ( 33 day MA): Trending down
Overall trend: Bearish
Volume: Nothing of note
Candlestick analysis: Watching for the current to close below today’s body
Ichimoku Cloud: C Clamp is getting more pronounced now after it looked like it was resolving itself yesterday
TD’ Sequential: Bearish price flip | Weekly A13
Visible Range: 1 month lookback shows high volume nodes from $3,600 - $4,400, has been holding as strong resistance
Price action: 24h: +0.8% | 2w: -20.2% | 1m: 46.9%
Bollinger Bands: MA at $3,736 and bottom band starting to trend down again
Trendline: Holding as strong resistance
Daily Trend (Using 1h 33 MA to identify daily trend): Turned bullish and currently being tested for support. I would expect consolidation around it for 3 - 9 hours while we work towards another trendline retest. That would also form a h&s
Parabolic SAR: $4,114
RSI: Back above 30 and looks like it is trying to trend up
Stochastic: %K flattened out but %D is still angled down
Last Day Rule: Need to break $3,641 for setup day
Summary: Love seeing the 9 MA and trendline working together so well, both holding as clean resistance against today’s rally. On the other hand it looks like a slightly higher low on the daily chart. If that turns into a close above the trendline / 9 MA then I will be expecting a return to the 33 MA.
The 1h chart is actually very interesting. The 33 MA being angled up told me to expect support in that area on this last sell off. Turning around a trend that is angled that sharply takes time. Therefore I expect us to consolidate around the 33 hour MA into a trend line retest.
I would expect that the form a h&s with a target that is roughly in line with horizontal support.
Nevertheless I am still staying away from re entering shorts. If we do bounce then that will provide a great selling opportunity. If we don't then I will be keeping a close eye on potential long entries. Staying away from Bitcoin at the prices and focusing on alts continues to be my gameplan.

$MYMMF Eyes on the box. Call limit order with tight S/L.Looks to be consolidating and gathering support here. Call order placed with tight S/L. Parabolic SAR has turned bullish here and ichimoku has formed a Bullish C-Clamp. See Chart for further details.
