Time for Consolidation then BOOM (CELR)Time for Consolidation then BOOM (CELR)
Given are the targets !!
Book profit !!
@Crypto_Sarkaar BINANCE:CELRBTC
Celr

CELR/USDtUpdate on My Last Post.
It Has Finnaly Broke The resistance trend Line. A Good Entry Point Again

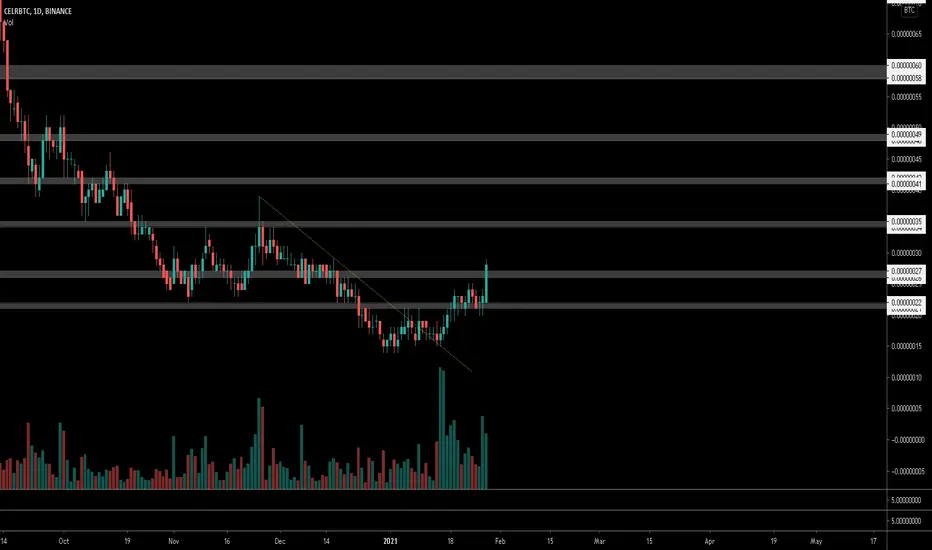
[CELRBTC] Buy the correction - easy 25%Hi all
CELR has been correcting the last two days. It looks like it is ready for a rebound.
We might reach the 100 sats area again pretty soon.
Everything is on the chart, this is not an investment advice.
RSI is already showing bullish signs. Wait for some consolidation on MACD and more volume.
Good luck!


ONE and CELR correlation strong af First Post on Tradingview
Just wanted to point out how crazy the correlation of these two charts, its interesting cause you could probably make good gains by just flipping between these two pairs, if any of these two pairs are at below 1 cent I see it as a good buy, comparing to what the price has reached previously. Has alot of upside potential in the coming months.
Thanks for reading and happy trading

CELR/BTC possible continuation patternsThese are what I believe to the the most likely continuation patterns to play out on CELR BTC pair short term. Posting here as neutral for reference of my own and others.

CELR/BTC first reasonable price target-First reasonable price target for Celr/btc after the break out of this falling wedge pattern..
-After that the real party can begin..

$CELR, Still running up $CELR
Still running up after the .618 fib retracement level test,
Currently making new highs (~130% since entry on UCTS 2D Buy), volume needs to recover momentum tho!
Looking at ~60 sats as next potential resistance but overall looks quite good for continuation..
#CELR

[CELRUSDT] Bullish formationHi everyone! :)
CELR Network is looking good on 4H/1D TF.
Bullish MACD and RSI divergences.
Bullish ascending triangle formation.
If it breaks 2600 (biggest resistance ever on CELR), we can expect it to go for another price discovery.
Wait for more volume for confirmation.
What do you guys think about CELR's chart? Feel free to drop a comment!
This is not an investment advice, just sharing my thoughts.
Good luck!


CELR.USDT (Y21.P1.E1).Upward pressure (stalking)Hi All,
Another coin that broke a wedge formation and is likely to pullback and find support on this level.
Work in the smaller timeframes to find an entrance, if it gives a bullish candle or combination.
All the best,
S.SAri

CELR 1H BUYAlso set some Buy orders near the Trendline
Remember no more than 5% of the deposit in one trade
SL: next sell signal

$CELR, Trying break above ~27sats w/ increasing volume$CELR
Trying break above ~27sats w/ increasing volume & UCTS Buy signal on the daily chart...
Big room to grow.. from current level to '20 highs ~300% (where most alts are heading or already reached)
#CELR
CELR - Broken Out, Ready to put up gains?!CELR network looks like it's go a confirmed breakout on BTC chart. LOADS of headroom, volume confirmed on breakout and bullish ABCD before the breakout.
Very promising signs across the board. I expect to see some serious movement here soon. Target are mapped for long term.


#CELR #CELRBTC $CELR BULL RUN HAS JUST STARTED JUST WATCH :)))))$CELR BULL RUN HAS JUST STARTED JUST WATCH :)))))

#CELR #CELRUSDT There are some small thresholds to achieve. I am an amateur, this is kinda my first sophisticated graph. You should zoom in and out to see correctly.

CELRUSDT can reach previous high after this butterfly moveButterfly move:
The previous Butterfly idea produced more than 189% rally so far.
Support and resistance:
On the weekly chart, after the rally the priceline has found strong support and now moving towards the next resistance level $0.0135. In the meanwhile, the price action of Celr has also broken out the 25 and 50 simple moving averages as well.
Up-channel and harmonic moves:
On the daily chart, the price action of CELER Network has formed an up-channel and forming different harmonic moves. After the formation of a Gartley move, the next Gartley formation is expected. To complete the next Gartley the SMA 200 should be broken down. The Bollinger bands is also moving up. We can also see powerful volume spikes as well.
Conclusion:
The price action of Celr token may move down to complete another bullish reversal Gartley move on the daily chart. On the weekly chart, the priceline is moving up and after breaking out the $0.0135 and $0.022 resistance levels it can easily go to the previous highest price.

