CELR/USDT : Reaching into the descending channel's lower ! BINANCE:CELRUSDT
Hello everyone 😃
Before we start to discuss, I would be glad if you share your opinion on this post's comment section and hit the like button if you enjoyed it !
#CELR is moving in a descending channel and now it has reached the lower line.
Although this could be an opportunity for those who are watching for the potential dips in ALT-Coins !
You can play your strategy in two separate scenarios :
- Wait for a breakout above the current bearish order-block and buy above it, You can set your invalidation as a breakdown confirmation below the entry zone.
- Wait for a retest into the Demand zone and use partial strategy; Buy once when it reaches the last Equal low and buy the rest into the Demand zone, You can set your invalidation as a breakdown confirmation below the Demand zone.
Hope you enjoyed the content I created, You can support us with your likes and comments !
Attention: this isn't financial advice we are just trying to help people on their own vision.
Have a good day!
@Helical_Trades
Celr

Celer short callLooking at this price action unfold. Price broke a key structural level and both the 50 and 100 EMA. On the lower timeframes (1H & 4H) we can see the bulls are fighting to reclaim this support zone.
If we can hold price below it and maybe get a retest on the 4H-chart, this could be an interesting entry for a short position.
With a conservative target at $0.05 and an aggressive target at $0.04.
Would you take this?

Celr ready for 100%+ moveSo far Celr is following this wyckoff accumlation patern to the teeth. According to the model the next move will be a big one!
What do you think?


Week 4: Weekend Watchlist UpdateHere is my Week 4 Crypto Strategy, now with a few tokens on watch.
Holding:
BTCUSD for a dead cat bounce to the 200dEMA
LTCUSD for the same
MANA for a possible breakout of the wedge
On Watch:
ADAUSD for a potential H&S
MATIC for a breakout
Harmony for a breakout
CELR for its resilience at this level.
SAND I might cheat in a bit here at this level
Holding:
Watching:


$CELR, Aiming for continuation toward ~210 sats$CELR
Usually strong chart regarding UCTS signals..
Turning bullish across multiple timeframes
Aiming for continuation toward ~210 sats
#CELR

UPDATE: CELR UP 32% after 4h bull signal - Scalper AnalysisPlease Like or Follow if you enjoyed this content.
UPDATE: The price jumped 32% after bull signal. CELR broke resistance at 0.075. Now moving slowly to 0.09 USDT. RSI is above 70. Price is above Ichimoku cloud. Which are all bullish signals.
This analysis is made with my "Supertrend Ninja - Clean". It displays only the last few signals. Which gives it a clean look. Currently CELR is in an uptrend. Remember you don't need to buy the bottom. You just need to ride a big part of the uptrend.
Supports and Resistances are highlighted as grey blocks. Profits can be taken at each grey block. Supports and resistances are automatically drawn using my indicator "Yo Show Me Some Support - and Resistances". Pun intended.
Thank you for reading.
Namasté 🙏
What Indicators Do I Use:
In the chart I am using my "Supertrend Ninja - indicator", which is a trend-following indicator (Green and red vertical line with arrows). When the background of the candlestick closes green (vertical line) with an upwards pointing pink arrow. It indicates a possible bullish (up)trend.
With each trade proper risk management is essential. Either by using my script "Trailing Stoploss Bottom Activation indicator", visible as grey dots below the candles. Which sends an alert, when current price goes below the previous candle low. Or using my "HA Trailing Stoploss Activation", the indicator below with green and red blocks. Or third option, exit when the Supertrend Ninja indicator displays a vertical red line with a downwards pointing black arrow. Remember, the first stop(loss) is always the cheapest stop.
Disclaimer: Ideas are for entertainment purposes only. Not financial advice. Your own due diligence is highly advised before entering trades. Past performance is no guarantee of future returns.

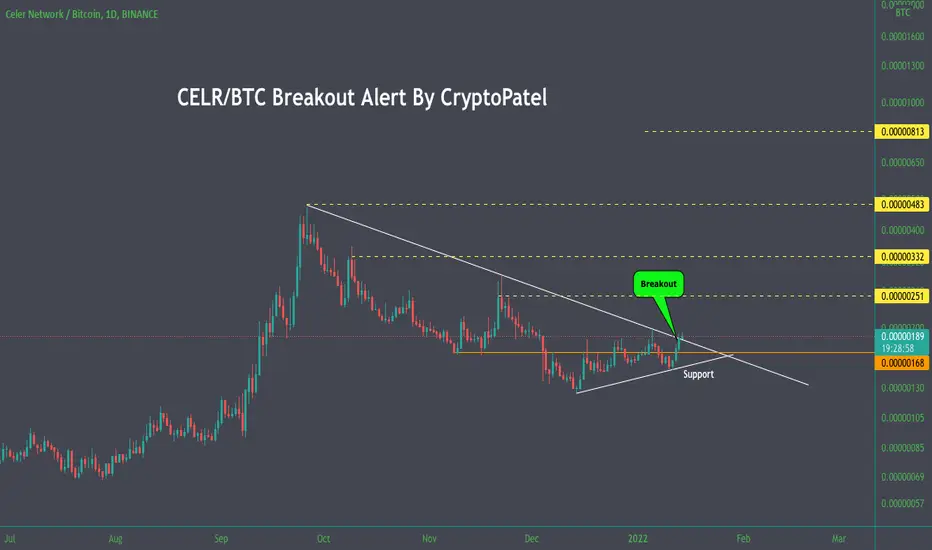
CELR/BTC Trying to breaking out so bullish chart#CRLR/BTC Breakout Alert:-
- #CELR breaking out at Resistance line.
Mean Bull in control for Celr Chart.
- 170-188 Satoshi is good entry.
We can see 170 Satoshi ( Retest Zone)
- If hold this support 170 Satoshi then we can see Big Move upward side.
- Resistance are 251/332/483 Satoshi
- If break all Resistance then we can see New ATH also around 800-1000 Satoshi
Worst case Support = 150 Satoshi
#CelerNetwork #CELR at well respected MA Ribbon resistance.Celer Network (CELR) still at well respected MA Ribbon resistance.
Can the untouched POC above current price help to break it?
What do you think? 😎
Drop me a nice comment if you'd like me to analyze any other cryptocurrency or do another comparison.
*not financial advice
do your own research before investing

CELRUSDT SETUPCELRUSDT is consolidating in a rectangular box. It has a good potential to break the shackles and reach to the top.
Alternatively, the consolidation can break to downward as well.
Trade your levels accordingly.


CELR Long HereFollowing Rising Channel
Buy Between: 0.078 - 0.085
Targets: 0.093 - 0.105 - 0.120 - 0.140
Stop Loss: 0.07

CELR/USDT Parabolic CurveBINANCE:CELRUSDT
The parabolic curve chart pattern is one of the strongest uptrend patterns. This type of pattern goes up the farthest and the fastest as it is under the strongest accumulation and every small pullback is bought by eager traders and investors.


CELR - Bullish Potential According to our current Celer Network price prediction, the value of Celer Network will rise. We have Fibonacci retracement support and a good uptrend line. The Celer Network price is expected to hit at least the highest again.


celer network #CELRdivergence between the peaks ,
Breaking the Corrective channel , support of the LAST PEAK , MA 200 DAY
and Re test :(
Breaking $0.058 complicates the matter more
Breaking $0.0962 with “ high momentum ” may bring it back to life .

$CELR Celer Network - Breakout is imminent double bottom, bullish gartley and supported by RSI
a great project with solid fundamentals too

CELRUSDTHello Crypto Lovers,
Mars Signals team wishes you high profits.
We are in the 4-hour time frame. We gave you the signal to enter at the entry zone. You can see a support line where after hitting it, the signal was issued and it was able to move toward its target which was R1. The price went beyond this line but was not able to stabilize there and fell down. If it is able to break R1 and stabilize there, it can see higher prices. But it is possible for the price to move down to S1 where you can buy so that the price will go up to sell again at R1. If the price moves below S1, it can go further down to S2.
Warning: This is just a suggestion and we do not guarantee profits. We advise you to analyze the chart before opening any positions.
Wish you luck

Celer Network (CELR) at well respected MA Ribbon resistanceCeler Network (CELR) at well respected MA Ribbon resistance.
Can the untouched POC above current price help to break it?
What do you think? 😎
Drop me a nice comment if you'd like me to analyze any other cryptocurrency or do another comparison.
*not financial advice
do your own research before investing

$CELR BUYRetrace complete to .786 - I am personally buying CELR here.
My own ideas! Not financial advice.

[crypto] Celer network - CELR = looking strong in the DCA ZoneCeler Network - CELR - Upward Momentum is starting to kick in? Edutainment Purposes Only!
