Celer Network CELR bearish sentimentSeptember has major catalysts for the crypto market as well as for the stock market.
The Ethereum merge on September 6th, that will end on Sept 20, the inflation report on September 13 and the next FOMC meeting afterwards with the new interest rates hike.
That is reflected in the crypto space in general as a bearish outlook.
Celer Network CELR has a negative overall sentiment recently.
I have the following price targets:
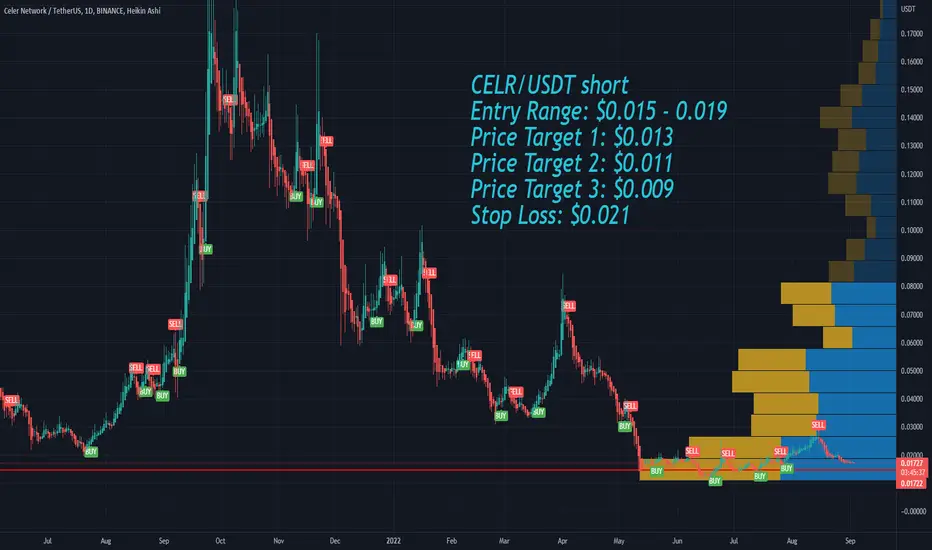
CELR/USDT short
Entry Range: $0.015 - 0.019
Price Target 1: $0.013
Price Target 2: $0.011
Price Target 3: $0.009
Stop Loss: $0.021
Celrusd
Celer to the moon?Volume confirm trend and price has a strong bullish trend. If in 4h it break sr line with good volume. But just I dont like1 thing,rsi divergence.
Thank yo for follow,like and comment.

UNI (bullish flag)UNI / USDT
This coin is one of most impressive coins during bear market and running over 50% in spot after we bought it
Currently it printed a bullflag which is a bullish continuation pattern : a break above this pattern may produce another bullish toward 9$-12$
The only concern these days is BTC , because altcoins wont do much when the king is in decline thanks to the bad international economic environment in background..etc
However we will monitor the price action at resistance if bullflag broken ,, the chance for next bullish wave is high

CELR CELR is not that bad it is almost done with the complicated correction after that it might be bullish as hell
peace :)

#CELR/USDT 4HPOUR UPDATE BY CRYPTOSANDERS !Welcome to this quick CELR/USDT analysis.
I have tried my best to bring the best possible outcome in this chart.
Reason for trade:-CELR/USDT symmetrical triangle pattern inside the trade and loar trade line buy green zone and the bounce upper trend line break and retest 2 and buy zone.
Entry:-$0.01807,$0.01867
Traget:- 110%
Stoploss:- $0.01751
with laverage 5x to 10x
Remember:-This is not a piece of financial advice. All investment made by me is at my own risk and I am held responsible for my own profit and losses. So, do your own research before investing in this trade.
Sorry for my English it is not my native language.
Do hit the like button if you like it and share your charts in the comments section.
Thank you...

CELR LONG SIGNALNice to meet you, everyone
I'm an alt trader
I'm analyzing and recommending things that are similar to my personality among many alt coins
Retest long signal

Celer Network CELR Price Targets and Stop LossCELR/USDT
Entry Range: $0.047 - 0.053
Price Target 1: $0.064
Price Target 2: $0.080
Price Target 3: $0.095
Stop Loss: $0.043
Previews CELR chart

Celer Network CELR Price Targets and Stop LossCELR/USDT
Entry Range: $0.037 - 0.046
Price Target 1: $0.057
Price Target 2: $0.072
Price Target 3: $0.094
Stop Loss: $0.030

burst time for CELR?!during correction in the market, some promising projects like CELR have been underperforming. after a successful break of resistance structure we can expect a rise to indicated levels.
make sure you follow us!

CELR possible replay of the past?$CELR is almost in the exact situation it was in almost a year ago when it had that roughly 850% bull run.
from highest point to now current lowest point, the similarities show. CELR can possibly make another 800% bull run here as we're currently on strong support.
These ideas are my own, not financial advice at all.
Do your own research and form your own opinions.

CELRHi Everyone...
Today sits the news of the US Federal Reserve
If the news of contractionary policies does not come from the United States ...
I think CELR is in a good place and can be bought for higher purposes
But 0.021 can be considered as support if the US tightening contractionary policies are heard.

CELR/USDT : Reaching into the descending channel's lower ! BINANCE:CELRUSDT
Hello everyone 😃
Before we start to discuss, I would be glad if you share your opinion on this post's comment section and hit the like button if you enjoyed it !
#CELR is moving in a descending channel and now it has reached the lower line.
Although this could be an opportunity for those who are watching for the potential dips in ALT-Coins !
You can play your strategy in two separate scenarios :
- Wait for a breakout above the current bearish order-block and buy above it, You can set your invalidation as a breakdown confirmation below the entry zone.
- Wait for a retest into the Demand zone and use partial strategy; Buy once when it reaches the last Equal low and buy the rest into the Demand zone, You can set your invalidation as a breakdown confirmation below the Demand zone.
Hope you enjoyed the content I created, You can support us with your likes and comments !
Attention: this isn't financial advice we are just trying to help people on their own vision.
Have a good day!
@Helical_Trades


UPDATE: CELR UP 32% after 4h bull signal - Scalper AnalysisPlease Like or Follow if you enjoyed this content.
UPDATE: The price jumped 32% after bull signal. CELR broke resistance at 0.075. Now moving slowly to 0.09 USDT. RSI is above 70. Price is above Ichimoku cloud. Which are all bullish signals.
This analysis is made with my "Supertrend Ninja - Clean". It displays only the last few signals. Which gives it a clean look. Currently CELR is in an uptrend. Remember you don't need to buy the bottom. You just need to ride a big part of the uptrend.
Supports and Resistances are highlighted as grey blocks. Profits can be taken at each grey block. Supports and resistances are automatically drawn using my indicator "Yo Show Me Some Support - and Resistances". Pun intended.
Thank you for reading.
Namasté 🙏
What Indicators Do I Use:
In the chart I am using my "Supertrend Ninja - indicator", which is a trend-following indicator (Green and red vertical line with arrows). When the background of the candlestick closes green (vertical line) with an upwards pointing pink arrow. It indicates a possible bullish (up)trend.
With each trade proper risk management is essential. Either by using my script "Trailing Stoploss Bottom Activation indicator", visible as grey dots below the candles. Which sends an alert, when current price goes below the previous candle low. Or using my "HA Trailing Stoploss Activation", the indicator below with green and red blocks. Or third option, exit when the Supertrend Ninja indicator displays a vertical red line with a downwards pointing black arrow. Remember, the first stop(loss) is always the cheapest stop.
Disclaimer: Ideas are for entertainment purposes only. Not financial advice. Your own due diligence is highly advised before entering trades. Past performance is no guarantee of future returns.

CELRUSDT SETUPCELRUSDT is consolidating in a rectangular box. It has a good potential to break the shackles and reach to the top.
Alternatively, the consolidation can break to downward as well.
Trade your levels accordingly.

Celer Network Analysis 04/03/2021as we can see the price has already done its accumulation and established its initial journey,
we can target the parallels legs of Fibonacci projection and if on the same impulsive wave we triggered the extension zone of 161.8% which is our 2 TP then we can be more confirm about the 3TP which is the 261.8% of the same Fibonacci projection.
there are total of 1 TPs and 1 Ultimate Target we have specified here where as the 1 TP is very close to achieve and rest may take some time but alternatively all will be triggered

CELR - Bullish Potential According to our current Celer Network price prediction, the value of Celer Network will rise. We have Fibonacci retracement support and a good uptrend line. The Celer Network price is expected to hit at least the highest again.

celer network #CELRdivergence between the peaks ,
Breaking the Corrective channel , support of the LAST PEAK , MA 200 DAY
and Re test :(
Breaking $0.058 complicates the matter more
Breaking $0.0962 with “ high momentum ” may bring it back to life .

$CELR BUYRetrace complete to .786 - I am personally buying CELR here.
My own ideas! Not financial advice.

CELR network starting run to 1 dollar.Last TA on CELR got invalided this asset is incredibly volatile, massive swings and misleading volume reading but now this time round with the Gann Fans we can get a better idea on where price is going.
16 days we have been holding this trend line , price spikes down to the to the white box but instantly gets bought back , macro structure now finally in a uptrend. Sometime in the next 8 days we will have to see a break of the 2/1 Gann ratio or else we go down again.

Celer Network LONG ✅✅✅This crypto is one of recommended ones fundamentally which you need to have some Celer in your pocket.
it about 2 month we are in correction process, for now we are in strong demand areas which can take price much higher,
you can buy some here as first level and more when it hits our strong supports which determined on the chart perfectly
‼️Dont forget risk management‼️
Any question comment me bellow
@FxShzd

CelrWe're in a Bullish trend.
but have a correction. check it seriously
Supports areas are clear in the Weekly timeframe.
Disclaimer: Information is provided only for educational and exchange purposes only.
Do your research before taking any action or decision in the real market.

