CELR/USDT A successful Breakout this zone, Indicating Bullish!💎CELR has recently shown noteworthy market dynamics, currently encountering resistance at the bearish OB and supply area.
💎 A successful breakout above this supply zone could signify a bullish momentum, probability CELR driving significant upward movement and reaching our target levels.
💎 However, if CELR fails to breach the supply zone, it may face rejection, prompting a retreat in price. In such a scenario, a revisit to the demand zone around 0.0244 could provide an opportunity to gather new momentum.
💎 For the bullish momentum to sustain, it's crucial for the price to bounce decisively from the demand area.
💎 Failure to do so, or worse, a breakdown below the demand zone, would raise concerns and suggest a continuation of the downward movement. In such a case, the price could retreat further towards the strong support area.
CELRUSDT

[CELRUSDT] - breakout after long accumulation phase🔥CELR Cheerful in weekly chart.
Breakout 0.382 Fibonacci level...after many attempt for the breakout and Long time accumulation
(665days)
Catch it before bullishing so hard
Don't forget to support us with your like, comment and follow for more updates 🎯

CELR/USDT Keep an eye, If breakout is valid Possible back to UP!💎CELR has undeniably attracted significant attention in the market. Currently, CELR finds itself situated within the demand area while following a descending channel pattern.
💎 If it manages to successfully break out of this pattern, there's a possibility that the price will reverse its downward trajectory and head back upward, probability reaching our target strong resistance area.
💎 However, if CELR fails to bounce from the demand area and instead breaks down below it, this could signify a continuation of the downward movement, with the next significant support level located at 0.13.
💎 The support area is critical for CELR, and a bounce from this level, along with reclaiming the area above the demand, is necessary to sustain an upward movement. On the contrary, if CELR fails to bounce and breaks down, the price may continue to decline further.

CELR/USDT Could CELR sustain and bounce from the support level??💎 CELR's recent failure to breach a crucial resistance level has resulted in a downturn, bringing it back to a key support area that previously acted as resistance. This is a decisive moment for CELR, as a strong bounce or bullish candle formation at this support, probability could signal a renewed attempt to challenge the resistance.
💎 However, if CELR is unable to hold its ground at this support level and breaks below it, it would be a concerning indicator of weakness. Such a breakdown would likely lead to further declines, with the Bullish OB area becoming the next critical point of focus.
💎 The Bullish OB area is pivotal for determining CELR's market trend. If CELR fails to maintain strength in this zone and breaks below, it would confirm a shift to a bearish trend. This breakdown could precipitate a further slide in CELR's price, potentially reaching the strong support area.
💎 In summary, CELR's market trajectory is currently hinging on its response at the present support level. A rebound from this level could reignite bullish momentum, while a breakdown would likely exacerbate bearish sentiments, leading to lower price levels in the near term.

CELR NEW VOLUME INCREASEThank you for reading this update.
CELR seems to have entered a new volume trend that could get new confirmations in new time frames.
The data frame shows an interesting view of CELR

CELERUSDT UPCOMING BIGMOVE It will take time bcoc it's weekly time frame,
Celer looks bullish.
So keep eye on this.

Celr/Usdt Chart Looks Uktra Bullish On Weekly Time-frame The CELR/USDT market structure is turning bullish on higher timeframes. A trendline resistance breakout and retest have already been confirmed with a double bottom formation. Expect a bullish move—it's just a matter of time. Remember, this is not financial advice; do your own research (DYOR).

seems like celr is ready for 200% bullish wavetrend is already up seems like correction has already over expecting solid recovery in coming days
falling wedge breakout has already broken expecting 200% bullish rally in midterm

CELR SHS - Don't wash your head with head & shoulders.I draw this after buying some celr ://
Even though coins prices dropped too much, there is no such thought like "this is too much we can recover from this".

CELR/USDT Perfect Bounce, Ready to breakout or rejected ??💎 CELR has undeniably captured significant attention in the market. Currently confronting a formidable supply area, CELR needs to overcome this resistance to sustain its upward trajectory. Notably, there has been a perfect bounce from the demand area, hinting at the potential for a breakout from the resistance in the near future. Success in breaking through the supply zone, probability could lead to a substantial upward movement, reaching our target area.
💎 On the flip side, if CELR fails to breach the resistance in the coming sessions, there is a possibility of a retracement, with CELR revisiting the demand area.
💎 The bad scenario is confirmed if, during the retesting phase at the demand area, CELR fails to maintain its position and undergoes a breakdown. In such a case, CELR may revert to a bearish movement, potentially retracing to the strong demand area.

CELR/USDT$CELR appears promising on a daily timeframe. After successfully flipping the red zone, consider entering, and then enjoy the ride. Always incorporate a stop-loss strategy. Everything is on the chart.
Trust @TheCryptoCity1
#1000x #CryptoNews #BULLRUN2024

CELR 📌 macro analysis ⏰COINBASE:CELRUSD :: long term 📌 analysis ⏰
#DYOR #NFA layer1&2 coin ⛓️
Nothing to explain previous bull run it done 👍 excellent performance 🙂 this bull run expecting decent performance 👍 this coin should need every time chart update #ta i will update here so follow the article and give boosting 🚀 binance launchpad project
Support 📌 $0.01-0.013 ( 60% 💰 )
< #BUY >📌 $0.004-0.004 ( 40% 💰 )
Note 👉Losing demand zone 📌 recent low 🔅 will reach 2nd phase
🎯 $0.17-0.16
🎯 $0.61-1.16
$0.03-0.05 key 🗝️ resistance 📌 BINANCE:CELRUSDT
Strong 💪 month should close above 😒 ( important )
#imo bull may get completed
$0.19 below 80% chance
Any doubt 🧐 comment below or DM private box
80% CHANCE coin won't cross $0.19 🤞 in my opinion #imo
If candle 1month strong close above $0.2 then new high 💰 chance so fix minimum target 🎯


CELRUSDT - CELER NETWORK IdeaHey dear traders!
When the price breaks through a resistance level and the subsequent short-term candlestick (e.g., 30-minute, 1-hour) closes above that level, a good opportunity arises to enter a long trade. The entry point for the long trade should be above the highest price of the previous short-term candlestick.
BINANCE:CELRUSDT COINBASE:CELRUSD
⚠️ Disclaimer: The viewpoints shared represent my individual outlook on the market, based on publicly accessible information and historical data. While a portion of these opinions is influenced by my actual trades, others are not. It's important to note that I am not a financial advisor, and I do not assume any responsibility for the decisions you make in your trading activities.
✅ Feel free to share your inquiries or suggestions in the comments. I am more than willing to assess and analyze any cryptocurrency, forex currency pair, or stock index that piques your interest, so, Please don't hesitate to ask or mention the specific currency chart you'd like me to review.

CELR / CELRUSDTGood Luck >>
• Warning •
Any deal I share does not mean that I am forcing you to enter into it, you enter in with your full risk, because I'll not gain any profits with you in the end.
The risk management of the position must comply with the stop loss.
(I am not sharing financial or investment advice, you should do your own research for your money.)

CELR at the Brink of Explosive Journey? 👀🚀CELR Analysis 💎 Paradisers, focus your attention on CELRUSDT, as it presents a notable setup in the demand zone, reinforced by a recent Market Structure Shift (MSS). This scenario suggests a considerable chance for a bullish trend.
💎 On examining CELR's pattern, the CelrNetwork has a consistent record of breaking above its descending trendline, a strong indicator of potential upward trends. It is currently facing a significant Bearish Order Block (OB) challenge, with ongoing momentum above the EMA100, aiming for supply targets around $0.03.
💎 However, given the volatile nature of the crypto market, it's essential for CELR traders to be ready for different potential outcomes. Should the expected bullish surge not come to fruition, pivoting to a rebound strategy from the support level at $0.016 will be vital.
💎 A fall below this support level would necessitate a change in strategy, highlighting the need to reevaluate the bullish stance and modify trading strategies to align with new market developments.
💎 Stay alert and tactically prepared, Paradisers. Your ParadiseTeam is committed to providing you with comprehensive analysis and strategic guidance, helping you make well-informed trading decisions in these fluctuating market conditions.

CELR ANALYSISExamining the CELR waves, we found that the CELR symbol is inside a diametric pattern that is now rising to complete the F wave.
For risk management, please don't forget stop loss and capital management
Comment if you have any questions
Thank You

Celer Network (CELR)Celer Network were in downtrend since birth. However, it seems a Head and Shoulder pattern is formed and due to the crypto market upward movements, CELR too can start an upward impulse wave. There are two possible targets; the horizontal area and the ascending blue line. Let's see what happens.

CELRUSDTIf we look at the weekly time, the price can grow, but the overall trend is still bearish and this is only a pullback

CELR/USDT what next? 👀 CELR Today analysis
💎 Paradisers, keep your eyes peeled! We've observed some intriguing price actions. Notably, there's been a rejection from the bearish OB, hinting at the asset's next potential trajectory.
💎 In our recent observations, the asset broke free from a descending trendline, embarking on an upward journey. Now, we're looking at two potential outcomes:
💎 The asset could experience a minor pullback, seeking support and bullish momentum from the demand level at .1305, aiming to retest the bearish OB.
💎 If it struggles to maintain its stance above the .1303 demand level, there's a heightened likelihood of it finding bullish momentum from the .1255 demand level. However, a breach below this point could pave the way for bearish tendencies.

CELR SEEMS TO GO GAME OVER A CRASH LIKE LUNA AND FTT DIDThanks for reading this update, please remember that this is not trading advice.
We expect that CELR is the next coin that will see a next free fall and game-over trend. Since the big exchanges have played the round.
We see on low time increase but this means noting for the real trend, we did expect before more crash trends on other coins.
The fake volume increase is the reason for the start of the crash. It is all about smart money and transaction data in combination with top whale holding.
The market cap and holders decrease, and the last data shows a connection with the FTT and Luna trend.
CELR is at this moment on a very risky trend as data shows and can be the next fall coins with the game over as Luna and FTT did. If this happens we expect that we will see soon a big free fall and crash trend on Celr like Luna and FTT did.
We did use the same tools to expect the crash we did before on Luna and FTT crash.
The big rule in trading, when a coin loses more than 80% of its value will stay a very risky coin even if it has a small time frame increase.
We have added what we expect, and time will learn what will happen with CELR.
This update is our view and means not to use it as trading advice.
The best traders in the world are traders who can read early data and expect a high chance of what the market can do . Nobody will be able 100% to be right, but with more chance, you can see the side.
* This crash expecting is by ASIA trend and on USDT pairs since its 94% of holding.

CELR SHOWS FALL TREND (CRASH VIEW)Thanks for reading this update, remember that this is not trading advice.
Depending on our last study CELR can meet a new breakdown in the coming time.
This study depends on the volume range and the new data shown.
A decrease of volume holders can show in the coming time frames a new fall for this coin.
There is an important rule in volume following when volume increases and market cap deincreases..

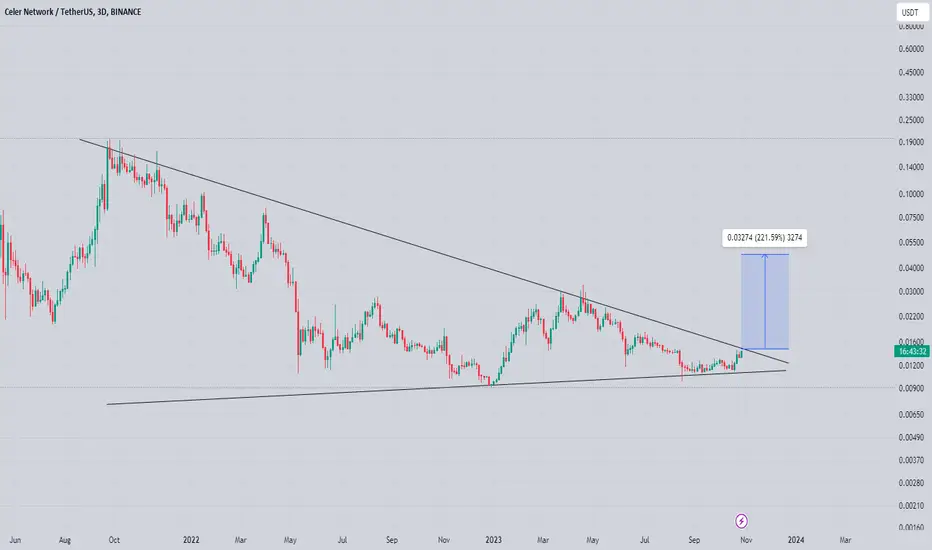
finally celr on verge of massive recovery over all in downtrend from couple of years now seems like its bottomed out recently and finally preparing for massive recovery
formed text book symmetrical triangle and expecting upside breakout incase of successful breakout expecting 200 to 220% bullish rally in midterm