CELR/USDT - wen $0.02+?CELR/USDT - wen $0.02+?
I am expecting CELR to retest the resistance at 0.195. If the bulls can push us above $0.02, I think we can run up to $0.032 - by the end of February my conservative estimate, even if we are rejected at $0.02, I believe we will land in the highlighted area of the chart above which is still above where we are at now. I think Celer is an underrated project in the space that has a function and secure protocol that is definitely helpful in cross chain interactions. Overall, I am long term bullish on Celer network and the future of the project.
CELRUSDT

CELR/BTC A quick Short CELR/BTC had a massive pump today, I am expecting a pullback to about 65 satoshis in the very short term (24-48 hrs).

CELR/USD- I AM GOING LONGCeler Network is pushing upwards and looking like its going to have a huge move coming up.

CELRUSD - pushing right up at resistance!CELR/USD pushing right up at a big resistance, if we break through, the upside move can be massive.
Good luck!

CELR/USD coming to a decision point very shortly. The highlighted region above in the chart has price squeezing tighter and tighter, its time for CELR to make a decision to break up or down. The recent trend has been positive over the last week, and I believe we will see continuation.
Good Luck everyone!

CELR/USD LONGIMO if CELR can break back into the channel (dark blue lines on the chart) we can continue the uptrend.
If it fails below the 1st level of support (green lines in the chart), I would then expect it to go further down to the second level of support on the chart and my theory would be invalidated.
As far as fundamentals go.. Celer is a great product that is needed in the space to enhance interoperability between chains.
Good Luck everyone

CELR/USD LONGlooking for a breakout with increasing volume and three solidiers on the chart signifying a trend reversal.
Target 0.01515

CELR/USD showing strengthCELR/USD meeting resistance but looking like it wants to break to the upside, showing increasing buying pressure as well as daily transaction volume.

CELR/USDTCELR/USDT looking bullish, it is a great project that I have had my eye on for a while. L2's will be a leading narrative going forward in the space. Matic is holding up the best amongst all cryptos, I think that just as L1 coins flourished, L2's with utility, superior tech, and strong communities will succeed. Celer network will help interoperability among blockchains through cross chain bridges.
01/12/2023
Position Entered at 0.0116
Current Price: 0.01205
Target #1: 0.022
Target #2: 0.027
Target #3: 0.030
Good Luck everyone!

CELR USDTCeler Network opportunity
big things coming 2023
..........................................
BUY BUY BUY

CELRUSDTHello Crypto Lovers,
Mars Signals team wishes you high profits.
This is a 4-hour-time frame analysis for CELRUSDT
There are R2 and R1 in this chart that used to be support areas and in both of them the support of price at different points is clear. And S1 and S2 at the bottom are the support areas with their well support of price. Hence, we have the price fluctuating over S1 area and there are two options available here for us. Either the price will provide us some rising signs and an increase would be expected for it upward. Or it is possible that the price loses the support and we receive some falling signs by reaching S1 and then a fall is waiting for the price there. Please be attentive to any piece of information or detail required for a logical trade.
Warning: This is just a suggestion and we do not guarantee profits. We advise you to analyze the chart before opening any positions.
Wish you luck

CELR technical analysisPrice is still moving down from the 2h supply zone as expected. I expect price to move down towards the 5h demand zone where we would be looking to long from.

Celr Daily Chart(Buy zones)hi everyone
as you can see celr is in a downtrend channel and following our path as we told you in previous analyses (check related ideas)
every thing is clear on the chart and doesn't need to explain more...
mentioned levels are best to demand zones and you can buy in there
I am putting some orders around demand zones, expect to bounce from here
please share your opinion in the comments
I consider all analyses performed in relation to that trade position.
Our analysis is not a buy or sell referral.
If you found our analysis useful and interesting, feel free to share it so that more individuals might benefit.
And please don't forget to like and comment; we will read them all.

CELR Final Falling LegWe had the analysis of the CELR symbol from months ago, which is in a significant downtrend with a 5-wave movement and is reaching the final goal.
This last wave will be in the form of a 3 to a 5-wave movement that is currently in the corrective phase. With the end of this phase in the specified Fibonacci range, we can enter a new selling position and will be with it until the final field of this movement.
Follow me For further updates!

CELRUSDTHello Crypto Lovers,
Mars Signals team wishes you high profits.
This is a one-day-time frame analysis for CELRUSDT
Here we have R1 on the top which is a resistance area and the unsuccessful triumphs of price to rise is clear in it. And S1 and S2 are the support areas that have the well support of price representing there. Hence, the price is fluctuating over S1 and our belief would include a rising trend toward R1 after receiving some rising signs at S1. By the time this happens, an increase will happen to the price to reach higher amounts. Bear in mind tat if the price falls below S1, more decline will wait for it. So consider confirmation candles all the time for a logical behavior in your trades.
Warning: This is just a suggestion and we do not guarantee profits. We advise you to analyze the chart before opening any positions.
Wish you luck

CELR start to look constructiveCELR is turning constructive - next couple of days will tell... what do you think?

Celr In weekly view I am always trying to use a simple chart as you can understand, so if you are seeing some simple lines and shapes I should tell you it's pure price action (5 years of 24/7 experience)...
as you can see in the chart celr is going to Demand Zones in weekly
celr is in a downtrend weeky channel I believe the blue zone will break soon so if you want to buy on the spot wait to reach demand zones in weekly and daily so it can bounce here, and try to buy in there.
green lines are strong block orders.(better to put your buy orders around them)
draw on your chart as mine then you can check in the lower time frame that all of the mentioned areas will work!!!
my decision: i am putting some orders on demand zones for a midterm spot...
I consider all analyses performed in relation to that trade position.
Our analysis is not a buy or sell referral.
If you found our analysis useful and interesting, feel free to share it so that more individuals might benefit from it.
And please don't forget to like and comment; we will read them all.

Celr Possibility of price increaseI expect price to reach the 4h supply at $0.0166 before moving down again from there. Price is currently retesting the resistance around $0.0158 from where it is getting rejected from.

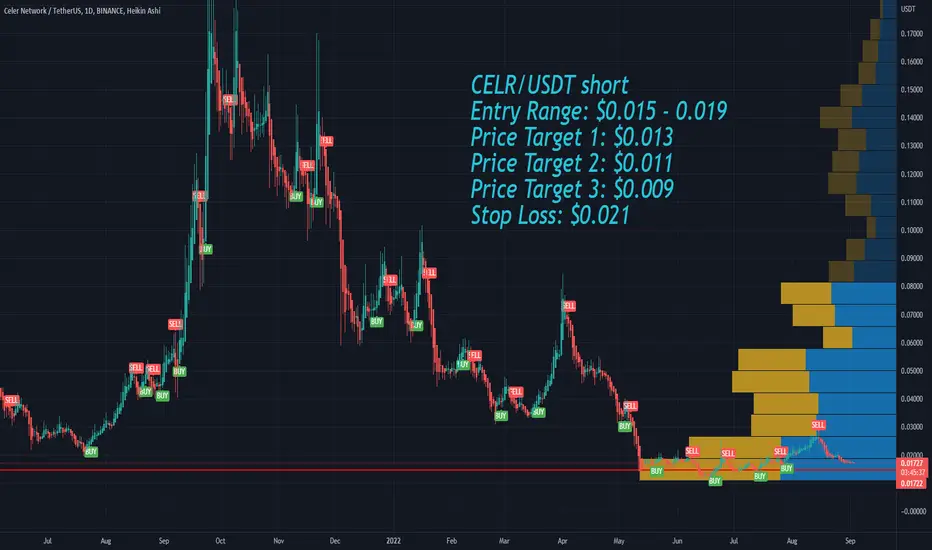
Celer Network CELR bearish sentimentSeptember has major catalysts for the crypto market as well as for the stock market.
The Ethereum merge on September 6th, that will end on Sept 20, the inflation report on September 13 and the next FOMC meeting afterwards with the new interest rates hike.
That is reflected in the crypto space in general as a bearish outlook.
Celer Network CELR has a negative overall sentiment recently.
I have the following price targets:
CELR/USDT short
Entry Range: $0.015 - 0.019
Price Target 1: $0.013
Price Target 2: $0.011
Price Target 3: $0.009
Stop Loss: $0.021
CELRUSDT Short to SupportCELR is quite weak if compared to other cryptocurrencies. This might due to the recent hijacked event on celer bridge. Short now to the next support line 0.1147.


CELRUSDTHello Crypto Lovers,
Mars Signals team wishes you high profits.
This is a 4-hour-time frame analysis for CELRUSDT
Currently we have R1 which used to be a support line and the support of the price at some points is obvious on it. And S1 used to be a resistance area which represents the disability of the price to rise. Here you see the price is fluctuating below R1 and we predict a rise for it to reach this line and at this point, by receiving some signs and confirmation candles, we will consider our short position and a decline is expected for the price in the near future. If the price fixes itself over R1, then more rise will happen.
Warning: This is just a suggestion and we do not guarantee profits. We advise you to analyze the chart before opening any positions.
Wish you luck

CELR Have double top, completed EW so need to be corrected. Hi everyone,
It also has a nice Bearish Divergence. Time to try another short position. It must go bearish from here...
As explained in the title.
Please give me your opinion.
Regards.
