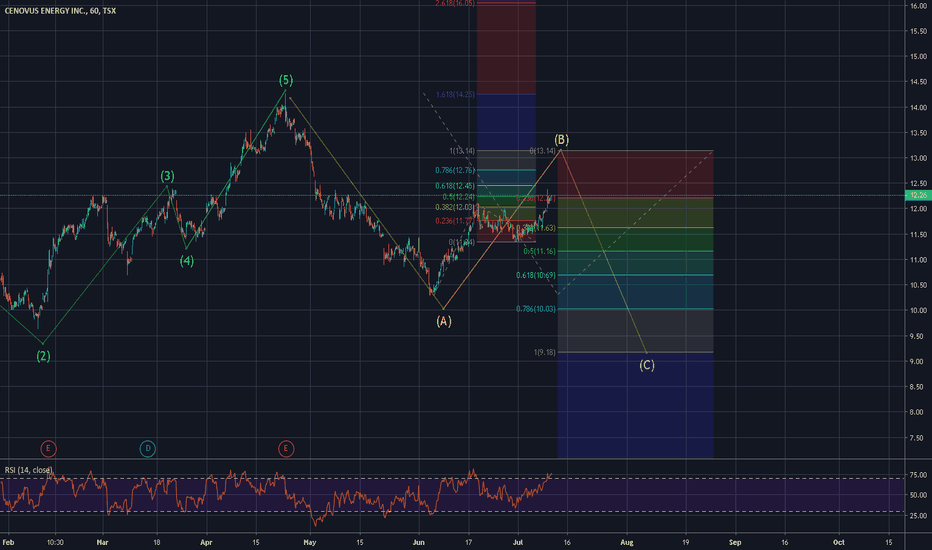
Cenovus
Cenovus Energy Inc. oilCVE stock on the 3Day time frame.
-Looks like a double top to me
-I am bearish to neutral on CVE
-48MA turning down, if the 13MA crosses also I'd be more bearish
-Highly dependant on Oil price but when main market sells off its a double wammy
None of this should be interpreted as financial advice, I am not a professional or certified financial adviser! all charts, and or analysis' are my personal opinions and observations only!
Cenovus Energy INC.CVE price chart analysis on the 3Day time frame 2015-Current.
In line with my "Keep it simple stupid" philosophy, my trend analysis shows that when the 13 SMA crosses the 48 SMA, it is a notable occurrence, possibly indicating a change in trend upcoming. My buy or sell decision occurs when the red 48 SMA turns down (Bear) or up (Bull). This simple strategy shows me possible % gains if playing various long or short market equity instruments and entering/exiting the trade near or at these occurrences. Included is the 200 SMA line.
My method of trading this ticker is to buy or short 100% of my position at the 13/48 SMA crosses (with 48 pivoting up or down) This helps my probability of success and risk factor. Using this method and resulting in 8 trades short and long, I could possibly have made around 75% gain on the downside since 2015, and an additional approx. 400% gain on the long side since Jan. 2021 had I been selling at these level. Normally I would be still holding the position until a new 13/48 SMA cross down (so return would be less). The support line is included around $14/sh mark for interests sake, as price would most likely bounce around there for a bit imo.
I could also add other indicators such as custom buy sell signals and or MACD, RSI, SAR to assist my decision making but the trend based idea keeps me grounded in the trade.
I generally use Heikin-Ashi candles for simplicity/clarity and also remove the wicks.
None of this should be interpreted as financial advice, I am not a professional or certified financial adviser! all charts, and or analysis' are my personal opinions and observations only!
Cenovus $15 targetI see no reasons why this won't go back to test 2018 highs of 14.84 and go beyond that into the end of the year.
Positive macro around oil and canadian producers right now
Lots of calls for $90 even $100 wti from goldman sachs
2018 WTI made a high of $76 before getting slaughtered all of 2019. I believe this time around we have the inverse scenario.
Swing Trading: Catching Up with Cenovus (TSX:CVE)Cenovus Energy seems to be swinging wildly as it gets ready to settle in for the winter.
Here are two trades picked up by our AllTradeSignals Volume Pressure Gauge over the past couple of weeks:
Trade #1 - 10% gain in 9 days
Trade #2 - 6.5% gain in 1 hour (!)
(Side note: For me, trade #2 is still "open" as I feel like there's room to run. But you could have taken profit there for an easy 5% once it started to drop.)
16% in two trades... enough to upgrade your family's Christmas gifts.
Interested in the AllTradeSignals Volume Pressure Gauge? Get in touch with us here on TradingView!


