Altcoins in Focus: Aptos, KAIA, and Ravencoin (RVN)Amid Bitcoin’s rapid growth and renewed interest in Ethereum, investors are increasingly turning their attention to altcoins—alternative cryptocurrencies showing strong potential for sharp gains. As of early June 2025, Aptos (APT), KAIA, and Ravencoin (RVN) stand out for their price surges and growing interest from major exchanges and analysts.
Aptos, a next-generation blockchain platform developed by former Meta (ex-Diem) engineers, has secured its place among the top 50 by market cap. In recent days, the token broke through a resistance level at $9.20, signaling a possible continuation of the uptrend. Its appeal lies in its scalability and its unique MoveVM architecture, which makes it attractive for developers in DeFi and NFT applications.
KAIA, a new token in the AI and metaverse ecosystem, gained over 15% this week following a Binance listing and integration with several major Web3 projects. Investors see KAIA as a potential “new Render,” focusing on neural computation and digital identity infrastructure.
Ravencoin (RVN), a long-time presence in the crypto space, is regaining popularity. With its focus on asset tokenization and copyright protection on the blockchain, RVN surged 14% after announcing partnerships with several independent music platforms.
The rise of these altcoins demonstrates that there is room in the crypto world not just for the giants, but also for innovative, purpose-driven projects capable of capturing market and user interest.
Centered Oscillators

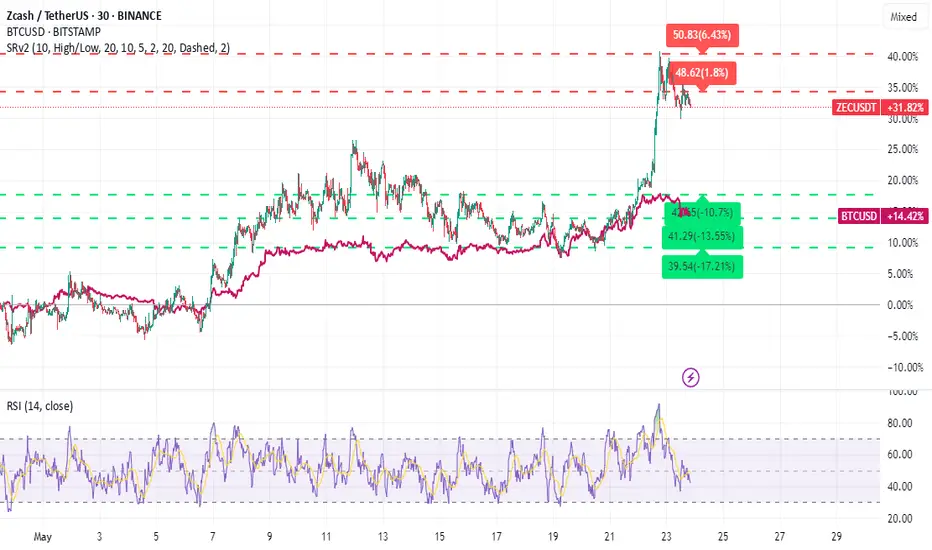
Zcash (ZEC) Explodes 12% Amidst Privacy Coin Rally: Is $300 the With ZEC recovering from $30 to hit $50 and the privacy sector gaining momentum, we delve into the catalysts, challenges, and the bold analyst prediction for Zcash's future.
The cryptocurrency market, a realm of perpetual motion and often unpredictable surges, has recently cast its spotlight on a specific niche that champions user anonymity: privacy coins. Leading this charge, Zcash (ZEC) has registered an impressive 12% gain, a move that has not only gladdened the hearts of its holders but also signaled a broader resurgence in coins designed to obscure transactional data. This rally, which has also seen contemporaries like Monero (XMR) post decent gains, underscores a growing interest or perhaps a renewed appreciation for financial privacy in the digital age.
Zcash, in particular, has demonstrated robust recovery. After languishing at a low of approximately $30 in February, the ZEC token has battled its way back to the significant $50 mark. This psychological and technical level is often viewed by traders as a crucial pivot point. The bullish sentiment is further amplified by a crypto analyst's bold prediction: should Zcash manage a sustained breakout, its price could target an ambitious $300. Such a forecast, while speculative, invites a deeper examination of Zcash's fundamentals, the current market dynamics for privacy coins, and the potential trajectory for ZEC. What exactly is fueling this ascent, and what hurdles might Zcash face on its path to potentially higher valuations?
Understanding Zcash: The Science of Shielded Transactions
To appreciate the current price action and future potential of Zcash, it's essential to understand its core value proposition. Launched in October 2016 by the Electric Coin Company (ECC), spearheaded by Zooko Wilcox, Zcash emerged from the Zerocoin protocol, aiming to address the privacy limitations inherent in Bitcoin. While Bitcoin transactions are pseudonymous (linked to addresses, not direct identities), the public nature of its blockchain means that with enough analysis, transactions can often be traced back to individuals or entities.
Zcash offers a solution through its pioneering use of zk-SNARKs (Zero-Knowledge Succinct Non-Interactive Arguments of Knowledge). This advanced cryptographic technique allows one party (the prover) to prove to another party (the verifier) that a statement is true, without revealing any information beyond the validity of the statement itself. In the context of Zcash:
• Shielded Transactions: Users can send ZEC through shielded addresses (z-addresses). When a transaction occurs between two z-addresses, the sender, receiver, and amount are all encrypted on the blockchain. Zk-SNARKs are used to prove that the transaction is valid (e.g., the sender has sufficient funds, no double-spending) without disclosing the sensitive details.
• Transparent Transactions: Zcash also supports transparent addresses (t-addresses), which function similarly to Bitcoin addresses. Transactions between t-addresses, or between a t-address and a z-address, will have some or all transaction details publicly visible.
•
This optional privacy is a key differentiator for Zcash. Users can choose the level of privacy they require for each transaction. While this flexibility can be seen as an advantage for regulatory compliance and exchange listings, it has also been a point of debate, with some privacy purists arguing that optional privacy is not as robust as mandatory privacy (like Monero's).
The development of Zcash is primarily driven by the Electric Coin Company, with funding initially derived from a "Founder's Reward" where a portion of the block rewards for the first four years was distributed to founders, employees, advisors, and the non-profit Zcash Foundation. This model has since evolved, with community governance playing an increasing role in funding development through new development funds.
The Recent Price Surge: Deconstructing the 12% Jump and the Road from $30 to $50
Zcash's recent 12% price increase is significant not just in its magnitude but also in its context. The climb from a February low of around $30 to the current $50 level represents a more than 66% increase in a relatively short period. This recovery can be attributed to several
interconnected factors:
1. Broader Market Recovery: The entire cryptocurrency market has seen periods of bullish sentiment in recent months. As market leaders like Bitcoin and Ethereum gain, investor confidence often spills over into altcoins, including Zcash. A rising tide tends to lift all boats.
2. Privacy Coin Sector Momentum: There's a discernible trend of renewed interest in privacy coins. Monero, often seen as the flagship privacy coin, has also experienced positive price action. This collective movement suggests a sector-specific catalyst.
o Regulatory Concerns & Censorship Fears: Increased discussions around Central Bank Digital Currencies (CBDCs), financial surveillance, and potential censorship of non-custodial wallets or certain types of transactions may be driving users towards tools that offer greater financial anonymity.
o Geopolitical Instability: In times of global uncertainty or conflict, individuals may seek ways to protect their assets and transact without oversight from potentially unstable or authoritarian regimes. Privacy coins can be perceived as a tool for financial sovereignty.
o Desire for Fungibility: True fungibility means that each unit of a currency is interchangeable with any other unit of the same currency. Bitcoin's transparent ledger means that coins can be "tainted" if they were previously involved in illicit activities, potentially leading to them being rejected by exchanges or merchants. Shielded Zcash aims to provide stronger fungibility.
3. Technical Breakout: The move above key resistance levels on price charts can trigger further buying. For ZEC, overcoming resistance points between $30 and $45 likely attracted technical traders. The $50 mark itself is a significant psychological level. If ZEC can firmly establish $50 as support, it could build a base for further upward movement.
4. Narrative Resurgence: The "privacy narrative" in crypto tends to ebb and flow. It appears to be currently in an upswing, with influencers and media outlets paying more attention to the sector. This increased visibility can attract new investors.
5. Zcash-Specific Developments (Potentially): While not explicitly mentioned in the prompt, ongoing development work by the ECC and the Zcash Foundation, such as improvements to zk-SNARKs (like the Halo Arc upgrade which removed the need for a trusted setup for shielded transactions using the Orchard shielded pool), wallet usability enhancements, or progress on scalability solutions like Proof-of-Stake research, can contribute to positive sentiment over time.
The Analyst's Call: Can Zcash Realistically Target $300?
The prediction that Zcash could target $300 represents a 500% increase from its current $50 level. While such gains are not unprecedented in the volatile crypto market, achieving this target would require a confluence of highly favorable conditions.
Factors that could support such a rally:
1. Sustained Crypto Bull Market: A $300 ZEC is highly improbable without a broader, powerful bull run across the entire cryptocurrency asset class. If Bitcoin were to reach new all-time highs and altcoin season truly kicks in, ZEC could be a significant beneficiary, especially if the privacy narrative remains strong.
2. Major Adoption Catalysts:
o Institutional Interest: If institutions begin to see value in privacy-preserving digital assets, either for their treasuries or for offering privacy-focused financial products, Zcash could attract significant capital inflows.
o Merchant Adoption: Increased acceptance of ZEC (particularly shielded ZEC) for payments would enhance its utility and demand.
o DeFi Integration: If Zcash can be effectively and privately integrated into the Decentralized Finance (DeFi) ecosystem, it could unlock new use cases and demand.
3. Technological Breakthroughs: Further advancements in Zcash's technology that enhance privacy, scalability, or user experience could make it more attractive. For instance, reducing the computational requirements for generating shielded transactions or enabling private smart contracts could be game-changers.
4. Regulatory Clarity (Favorable): This is a double-edged sword. While crackdowns are a risk, clear and favorable regulations that acknowledge the legitimate uses of privacy coins could remove uncertainty and encourage investment. If Zcash's optional privacy model is seen as a compliant way to offer privacy, it might thrive.
5. Weakening of Competitors or Strengthening of ZEC's Unique Selling Proposition: If Zcash can more effectively articulate its advantages over other privacy solutions or if competitors face significant setbacks, ZEC could capture a larger market share.
6. Supply Dynamics: Like Bitcoin, Zcash has a finite supply (21 million coins). As issuance decreases over time due to halvings (Zcash had its first halving in November 2020), reduced new supply coupled with increased demand can lead to price appreciation.
Challenges and Headwinds on the Path to $300 (and Beyond)
Despite the bullish outlook, Zcash faces significant challenges:
1. Regulatory Scrutiny and Delistings: This remains the most significant threat to privacy coins. Governments and regulatory bodies worldwide are wary of technologies that could facilitate money laundering, terrorist financing, or tax evasion.
o FATF "Travel Rule": The Financial Action Task Force (FATF) guidelines require virtual asset service providers (VASPs) like exchanges to collect and share sender and receiver information for transactions above a certain threshold. This is difficult to implement for inherently private transactions.
o Exchange Delistings: Several major exchanges have delisted Zcash (especially its shielded functionality) or restricted its trading in certain jurisdictions due to regulatory pressure or an abundance of caution. Further delistings would severely impact liquidity and accessibility.
2. Competition: The privacy coin space is competitive.
o Monero (XMR): Monero uses a different approach (ring signatures, stealth addresses, RingCT) to provide mandatory privacy. It has a strong community and is often favored by privacy advocates for its "always-on" privacy.
o Newer Privacy Technologies: Other projects are exploring different privacy solutions, including Layer 2 privacy protocols on more scalable blockchains (e.g., zk-rollups on Ethereum that can offer privacy).
3. The "Optional Privacy" Dilemma: While intended as a feature for flexibility, Zcash's optional privacy means that the actual "anonymity set" for shielded transactions (the number of other shielded transactions yours is mixed with) can be smaller if most users opt for transparent transactions. This can, in theory, make shielded transactions less private than if privacy were mandatory and universally adopted on the network. The Zcash community and developers are actively working to encourage greater shielded adoption.
4. Perception and Misinformation: Privacy coins are often unfairly associated solely with illicit activities. Overcoming this negative perception and highlighting legitimate use cases (e.g., protecting commercial trade secrets, personal financial security, dissidents in oppressive regimes) is an ongoing challenge.
5. Scalability and Usability: While zk-SNARKs are powerful, generating shielded transactions has historically been more computationally intensive than transparent ones, leading to slower transaction times or higher fees on less powerful devices. Significant strides have been made with upgrades like FlyClient and the Orchard shielded pool, but continuous improvement is needed for mass adoption.
6. Development Funding and Governance: Ensuring sustainable funding for ongoing research, development, and ecosystem growth is crucial. The Zcash community's ability to effectively govern and allocate resources from its development fund will be key to its long-term success.
What Next for ZEC? Key Areas to Watch
Given the current momentum and the ambitious price targets, several factors will determine Zcash's trajectory:
1. Shielded Adoption Rate: The most critical internal metric for Zcash is the proportion of transactions that are shielded. Increased shielded usage strengthens the network's privacy guarantees and demonstrates the utility of its core technology. Initiatives like the ECC's focus on wallet usability for shielded transactions are vital.
2. Regulatory Developments: Any news related to regulations concerning privacy coins will heavily impact ZEC. Investors should closely monitor pronouncements from major regulatory bodies (SEC, FATF, European regulators, etc.).
3. Technological Roadmap Execution: The successful implementation of planned upgrades, particularly those related to scalability (like potential Proof-of-Stake implementation, which the ECC is researching), interoperability, and enhanced privacy features, will be crucial. The Zcash community recently approved a new roadmap focusing on making Zcash a proof-of-stake chain and introducing Zashi, a new Zcash-focused wallet.
4. Exchange Landscape: The willingness of major exchanges to continue listing ZEC and support its shielded withdrawals/deposits is paramount for liquidity and accessibility. Any new listings or, conversely, delistings will be significant market-moving events.
5. Broader Crypto Market Sentiment: Zcash's fate is still largely tied to the overall health of the cryptocurrency market. A sustained bear market would make significant price appreciation very difficult, regardless of Zcash's individual merits.
6. Institutional Narrative: If a narrative emerges where institutions begin to value or require on-chain privacy for certain operations, Zcash could be well-positioned if it can navigate the regulatory complexities.
7. Community Engagement and Development Activity: A vibrant and active community, along with consistent development contributions, signals a healthy project. Tracking developer activity, community discussions, and governance proposals can provide insights into the project's long-term viability.
Technical Analysis Snapshot (Hypothetical)
While a deep dive requires real-time charts, here's a general technical outlook based on the described price action:
• Current Level ($50): This is a key psychological and potential resistance/support level. A sustained break above and holding this level as support would be bullish.
• Next Resistance Levels: If $50 is overcome, traders would look for previous swing highs or Fibonacci extension levels. These could be in the $60-$70 range initially, then potentially $90-$100 (a previous significant area of activity for ZEC).
• Support Levels: If ZEC fails to hold $50, previous resistance levels around $40-$45 might act as support, followed by the $30 low.
• Moving Averages: Traders will watch if ZEC can stay above key moving averages (e.g., 50-day, 200-day). A "golden cross" (50-day MA crossing above 200-day MA) would be a strong bullish signal.
• Volume: Increased trading volume accompanying price rises is a sign of strong buying interest and validates the move.
• Relative Strength Index (RSI): An RSI moving into overbought territory (>70) might suggest a short-term pullback is due, but in strong uptrends, assets can remain overbought for extended periods.
The analyst's $300 target would likely involve breaking through multiple significant resistance zones established during previous bull markets.
Conclusion: Cautious Optimism for Zcash in a Privacy-Aware Future
Zcash's recent 12% price jump and its recovery to $50 are encouraging signs for the project and the broader privacy coin sector. The renewed interest in financial privacy, coupled with a generally improving crypto market, provides a favorable backdrop. The analyst's $300 price target, while ambitious, highlights the explosive potential that well-positioned altcoins can exhibit during strong bull cycles, especially those with unique and compelling technology.
However, the path forward for Zcash is fraught with challenges, predominantly regulatory uncertainty. The very feature that gives Zcash its value – privacy – is also its greatest vulnerability in the eyes of many global regulators. The project's ability to navigate this complex landscape, potentially by emphasizing its optional privacy as a compliant solution or by fostering a decentralized ecosystem resilient to censorship, will be paramount.
Investors and enthusiasts should monitor the adoption of shielded transactions, the progress on Zcash's technological roadmap (including the move to Proof-of-Stake and Zashi wallet development), the evolving regulatory environment, and the overall health of the crypto market. While $300 remains a speculative target, Zcash's robust technology and the enduring human desire for privacy ensure it will remain a significant and closely watched player in the digital asset space. The "what next" for ZEC will be a dynamic interplay between technological innovation, market sentiment, and the global conversation around financial privacy and freedom.
Las Vegas Sands May Show Signs of PeakingLas Vegas Sands bounced sharply in recent weeks, but some traders may think its longer-term downtrend will resume.
The first pattern on today’s chart is the decline from mid-December through early April. The casino stock retraced half that move before stalling. It also seems to be hitting resistance at a weekly close from March 21.
Second, the 50-day simple moving average (SMA) is under the 100-day SMA. Both are declining. That may be consistent with a longer-term downtrend.
Third, the stock has fallen back below its 8-day exponential moving average. That may suggest its short-term trend is no longer bullish.
Finally, stochastics are dipping from an overbought condition.
Check out TradingView's The Leap competition sponsored by TradeStation.
TradeStation has, for decades, advanced the trading industry, providing access to stocks, options and futures. If you're born to trade, we could be for you. See our Overview for more.
Past performance, whether actual or indicated by historical tests of strategies, is no guarantee of future performance or success. There is a possibility that you may sustain a loss equal to or greater than your entire investment regardless of which asset class you trade (equities, options or futures); therefore, you should not invest or risk money that you cannot afford to lose. Online trading is not suitable for all investors. View the document titled Characteristics and Risks of Standardized Options at www.TradeStation.com . Before trading any asset class, customers must read the relevant risk disclosure statements on www.TradeStation.com . System access and trade placement and execution may be delayed or fail due to market volatility and volume, quote delays, system and software errors, Internet traffic, outages and other factors.
Securities and futures trading is offered to self-directed customers by TradeStation Securities, Inc., a broker-dealer registered with the Securities and Exchange Commission and a futures commission merchant licensed with the Commodity Futures Trading Commission). TradeStation Securities is a member of the Financial Industry Regulatory Authority, the National Futures Association, and a number of exchanges.
TradeStation Securities, Inc. and TradeStation Technologies, Inc. are each wholly owned subsidiaries of TradeStation Group, Inc., both operating, and providing products and services, under the TradeStation brand and trademark. When applying for, or purchasing, accounts, subscriptions, products and services, it is important that you know which company you will be dealing with. Visit www.TradeStation.com for further important information explaining what this means.

BTC Hits New All-Time High: Is a $128K Blow-Off Top Next?Bitcoin's Meteoric Ascent: New All-Time Highs Fuel $128K "Blow-Off Top" Predictions Amidst Unprecedented Adoption
The digital gold rush of the 21st century is reaching a fever pitch. Bitcoin (BTC), the pioneering cryptocurrency, has not only shattered previous records but is now tantalizingly close to new, stratospheric all-time highs, with analysts eyeing a potential "blow-off top" as high as $128,000. This electrifying surge, which saw BTC climb to within 1.5% of new peaks as bullish sentiment decisively overcame final resistance, is underpinned by a confluence of factors: soaring institutional and retail adoption, particularly in the United States, booming ETF inflows, growing political and regulatory support, and a shifting macroeconomic landscape that increasingly favors non-traditional assets. As of May 21, 2025, Bitcoin has firmly established itself above the $109,000 mark, a testament to its resilience and burgeoning mainstream acceptance.
The recent price action has been nothing short of spectacular. Bitcoin bulls have been relentlessly "grilling sellers," pushing the price to historic milestones. On May 21, 2025, Bitcoin etched a new all-time high (ATH) above $109,000, a landmark achievement that notably placed 100% of BTC holders into profit. This surge saw Bitcoin's market capitalization briefly surpass that of e-commerce giant Amazon, a symbolic victory highlighting its growing financial clout. Specific figures around this period include a climb to a record $109,302, and another peak at a historic $109,500, demonstrating the intense buying pressure and bullish conviction in the market. Analysts are now recalibrating their upside targets, with many calling for $116,000 as the next significant milestone on the path to even loftier valuations.
This bullish momentum isn't occurring in a vacuum. It's the culmination of years of development, increasing understanding, and a series of pivotal events that have collectively propelled Bitcoin into the financial limelight.
The American Bitcoin Boom: Adoption Surpasses Gold, Institutions Dive In
One of the most compelling narratives driving Bitcoin's current rally is its explosive growth in the United States. A staggering 50 million Americans now own Bitcoin, a figure that notably surpasses the 37 million gold holders in the country. This demographic shift signifies a profound change in investment preferences, particularly among younger generations who are increasingly comfortable with digital assets. Bitcoin is no longer a niche interest for tech enthusiasts; it's becoming a recognized component of diversified investment portfolios across a broad swathe of the American population.
The institutional embrace within the US is equally, if not more, impactful. US firms now hold an astonishing 94.8% of the Bitcoin reserves held by publicly traded companies globally. This concentration underscores the confidence American corporations have in Bitcoin as a treasury reserve asset, a hedge against inflation, and a potential source of significant returns. Furthermore, the United States is solidifying its position as the global epicenter of the Bitcoin industry, with 40% of all Bitcoin companies headquartered domestically. This robust ecosystem of miners, exchanges, wallet providers, and ancillary service companies fosters innovation and provides a strong foundation for continued growth.
The advent and subsequent success of Bitcoin Exchange Traded Funds (ETFs) have been a game-changer. These regulated financial products have opened the floodgates for a new wave of capital, allowing retail and institutional investors to gain exposure to Bitcoin through traditional brokerage accounts without the complexities of direct ownership and custody. The "booming ETF inflows" are a direct contributor to the recent price surge, creating sustained buying pressure and signaling widespread market acceptance.
Macroeconomic Tailwinds and Regulatory Optimism
Beyond direct adoption, broader economic and political factors are playing a crucial role. The recent new all-time high of $109,000 was notably set just nine days after the US and China closed a 90-day trade agreement. This resolution eased economic uncertainty and market jitters that had previously weighed on global markets. In such an environment, assets perceived as hedges against traditional market volatility or fiat currency devaluation, like Bitcoin and gold, often thrive. Indeed, concurrent with Bitcoin's rise, concerns such as Japan's debt woes have contributed to gold surpassing the $3,300 mark, indicating a broader flight to alternative stores of value.
Furthermore, there's growing optimism around US regulations concerning cryptocurrencies. While the regulatory landscape is still evolving, recent pronouncements and actions suggest a move towards greater clarity and a more accommodative stance, rather than outright prohibition. This "growing political support" is crucial for long-term institutional commitment, as regulatory uncertainty has historically been a significant barrier to entry for larger, more conservative investors. The fact that Bitcoin climbed to a record of $109,302, breaching a previous high set around the time of a major political event like a presidential inauguration (specifically referenced as Trump's inauguration on Jan. 20 in a historical context for a previous ATH), often correlates with market sentiment interpreting political or regulatory shifts as favorable.
The "Bitcoin Strategic Reserve" (BSR): A Paradigm Shift for National Economies?
An intriguing, albeit more speculative, concept gaining traction is the idea of a "Bitcoin Strategic Reserve" (BSR). While not yet a formal policy in any major nation, the discussion itself highlights Bitcoin's evolving perception from a purely speculative asset to one with potential strategic geopolitical and economic importance.
A BSR would involve a nation-state, such as the United States, acquiring and holding Bitcoin as part of its national reserves, much like it currently holds gold or foreign currencies. The rationale behind such a move could be multifaceted:
1. Hedging Against Fiat Devaluation: As central banks globally continue to engage in monetary expansion, concerns about the long-term purchasing power of fiat currencies persist. Bitcoin, with its fixed supply, offers a potential hedge against this inflation.
2. Participating in a New Financial System: If Bitcoin continues its trajectory towards becoming a globally recognized store of value or even a medium of exchange for certain international transactions, holding it in reserve would position a nation to participate actively in this emerging financial infrastructure.
3. Technological Leadership: For a country like the US, which already leads in Bitcoin company headquarters and corporate holdings, establishing a BSR could further cement its leadership in the digital asset space, attracting talent and capital.
4. Economic Resilience: In a future where digital currencies play a more significant role, a BSR could offer a degree of economic resilience and autonomy, reducing reliance on traditional financial systems or the currencies of other nations.
The implications of a major economic power like the US even seriously considering, let alone implementing, a BSR would be monumental for Bitcoin's legitimacy and price. It would signal ultimate institutional acceptance and could trigger a wave of similar considerations by other nations, creating immense demand for a limited supply of BTC. While the "Bitcoin Strategic Reserve Explained and What BSR Means for the US Economy" remains a topic of forward-looking discussion, its emergence in financial discourse is a testament to how far Bitcoin has come.
The Path to $128K: Understanding the "Blow-Off Top"
With Bitcoin having decisively broken past $109,000 and upside targets of $116,000 now in common parlance, the ultimate bull-case scenario being discussed is a "blow-off top" potentially reaching $128,000 or even higher.
A "blow-off top" is a chart pattern that signifies a steep and rapid price increase in an asset, often on high volume, followed by an equally sharp reversal. It typically occurs at the end of a prolonged bull market or a parabolic advance. The psychology behind it involves:
1. Euphoria and FOMO (Fear Of Missing Out): As prices accelerate, media attention intensifies, and stories of quick riches abound. This draws in a flood of retail investors who don't want to miss out on the gains.
2. Exhaustion of Buyers: The parabolic rise eventually becomes unsustainable. The last wave of enthusiastic buyers enters at or near the peak.
3. Smart Money Distribution: Experienced traders and institutions, who may have accumulated positions much lower, begin to sell into this heightened demand, taking profits.
4. Sharp Reversal: Once buying pressure is exhausted and selling pressure mounts, the price can fall dramatically as latecomers panic-sell and stop-losses are triggered.
Predicting the exact peak of a blow-off top is notoriously difficult. However, analysts use a combination of technical analysis (chart patterns, momentum indicators, Fibonacci extensions), on-chain data (network activity, holder behavior), and market sentiment to identify potential price targets and warning signs. The $128,000 figure is likely derived from such analyses, representing a significant psychological level or a projection based on previous market cycle behavior.
Navigating the Bull Market: Indicators for Identifying a Cycle Top
While the current sentiment is overwhelmingly bullish, savvy Bitcoin traders and investors are always mindful of market cycles and the potential for corrections or trend reversals. The question, "Is Bitcoin price close to a cycle top?" is one that prudent market participants constantly evaluate. Several indicators can help traders gauge whether a market might be overheating:
1. Moving Average Convergence Divergence (MACD): This trend-following momentum indicator can show bearish divergences, where the price makes new highs, but the MACD fails to do so, signaling weakening momentum.
2. Relative Strength Index (RSI): An RSI reading above 70 is generally considered overbought, and readings above 80 or 90 in a strong bull market can signal extreme conditions, though Bitcoin can remain overbought for extended periods. Bearish divergences on the RSI are also key.
3. On-Chain Metrics (e.g., MVRV Z-Score, Puell Multiple, SOPR):
o MVRV Z-Score (Market Value to Realized Value): Compares Bitcoin's market cap to its realized cap (the price at which each coin last moved). High Z-scores indicate the market cap is significantly higher than the average cost basis, suggesting the asset is overvalued and potentially near a top.
o Puell Multiple: Looks at the supply side of Bitcoin's economy – miners and their revenue. It divides the daily issuance value of bitcoins (in USD) by the 365-day moving average of daily issuance value. High values suggest miner profitability is high compared to historical norms, which has sometimes coincided with market tops.
o Spent Output Profit Ratio (SOPR): This indicates if holders are, on average, selling in profit or loss. Values significantly above 1 suggest holders are realizing substantial profits, which can increase sell pressure. A sustained drop below 1 after a peak can signal a shift in trend.
4. Logarithmic Growth Curves: Bitcoin's long-term price action has often respected logarithmic growth channels. When the price reaches the upper band of these channels, it has historically indicated a market top.
5. Funding Rates and Open Interest in Derivatives Markets: Extremely high positive funding rates on perpetual swaps indicate that an overwhelming number of traders are long and paying a premium to maintain those positions. This can signal excessive bullishness and a crowded trade, making the market vulnerable to a long squeeze if prices reverse. High open interest can also exacerbate volatility.
While Bitcoin is currently refusing to give up on its quest to revisit $108,000 (a level now surpassed) and beyond, concerns over a trend change, though perhaps quieter amidst the euphoria, are always present in the minds of seasoned investors. These indicators provide a more objective lens through which to assess the sustainability of the current rally.
The Road Ahead: Uncharted Territory with Immense Potential
As Bitcoin forges new all-time highs, it enters uncharted territory. The confluence of unprecedented US adoption, robust institutional investment via ETFs, a more favorable regulatory outlook, and supportive macroeconomic conditions has created a potent cocktail for price appreciation. The surpassing of Amazon's market cap, even if temporary, and the fact that 100% of BTC holders are in profit, are powerful psychological milestones that can fuel further confidence.
The predictions of a $116,000 interim target and a potential $128,000 blow-off top are no longer fringe theories but are being seriously discussed by mainstream analysts. The narrative of Bitcoin as "digital gold" is gaining more traction than ever, especially as traditional safe havens like gold also see increased interest amidst global economic uncertainties like Japan's debt situation.
However, the path is unlikely to be linear. Bitcoin's inherent volatility means that sharp corrections can and will occur, even within a broader uptrend. The "concerns over a trend change" will likely grow louder as prices reach more extreme levels, and profit-taking becomes more tempting. Investors should remain vigilant, utilize the available indicators to assess market conditions, and practice sound risk management.
In conclusion, May 2025 has marked a historic period for Bitcoin. Its surge above $109,000, driven by a powerful combination of fundamental adoption and favorable market dynamics, has set the stage for potentially even more dramatic price action. Whether the ultimate peak of this cycle is $116,000, $128,000, or another figure entirely, one thing is clear: Bitcoin has firmly cemented its place in the global financial landscape, and its journey is far from over. The coming weeks and months will be closely watched by investors worldwide as the world's preeminent cryptocurrency continues to redefine the boundaries of financial assets.
________________________________________
Disclaimer: This article is for informational purposes only, based on the provided snippets, and should not be considered financial advice. Investing in Bitcoin and other cryptocurrencies is highly speculative and carries a significant risk of loss. Past performance is not indicative of future results. Always conduct your own thorough research and consult with a qualified financial advisor before making any investment decisions.

Potential Uptrend in NewmontNewmont has been climbing this year, and some traders may see further upside in the S&P 500’s only pure-play gold miner.
The first pattern on today’s chart is the pullback since mid-April. The lower low, lower high and second lower low may be viewed as a potential A-B-C correction. Completion of such a formation may suggest a longer-term uptrend is poised to resume.
Second, the 50-day simple moving average (SMA) had a “golden cross” above the 200-day SMA in April and has remained there since. That may reflect a bullish longer-term trend.
Third, prices are back above the 50-day SMA and bounced above the 200-day SMA.
Finally, stochastics are turning up from an oversold condition.
Check out TradingView's The Leap competition sponsored by TradeStation.
TradeStation has, for decades, advanced the trading industry, providing access to stocks, options and futures. If you're born to trade, we could be for you. See our Overview for more.
Past performance, whether actual or indicated by historical tests of strategies, is no guarantee of future performance or success. There is a possibility that you may sustain a loss equal to or greater than your entire investment regardless of which asset class you trade (equities, options or futures); therefore, you should not invest or risk money that you cannot afford to lose. Online trading is not suitable for all investors. View the document titled Characteristics and Risks of Standardized Options at www.TradeStation.com . Before trading any asset class, customers must read the relevant risk disclosure statements on www.TradeStation.com . System access and trade placement and execution may be delayed or fail due to market volatility and volume, quote delays, system and software errors, Internet traffic, outages and other factors.
Securities and futures trading is offered to self-directed customers by TradeStation Securities, Inc., a broker-dealer registered with the Securities and Exchange Commission and a futures commission merchant licensed with the Commodity Futures Trading Commission). TradeStation Securities is a member of the Financial Industry Regulatory Authority, the National Futures Association, and a number of exchanges.
TradeStation Securities, Inc. and TradeStation Technologies, Inc. are each wholly owned subsidiaries of TradeStation Group, Inc., both operating, and providing products and services, under the TradeStation brand and trademark. When applying for, or purchasing, accounts, subscriptions, products and services, it is important that you know which company you will be dealing with. Visit www.TradeStation.com for further important information explaining what this means.

Apple Might Be StuckThe broader market has rebounded sharply in the last month, but Apple might be getting left behind.
The first pattern on today’s chart is the April 15 peak of $212.94. The smartphone giant probed that level in early May and again last week without breaking it. (The more recent high was also slightly lower.) That may suggest resistance is in place.
Second, the Nasdaq-100 and S&P 500 are back to levels from late February and early March. AAPL’s smaller bounce compared with the broader market may reflect weaker relative strength.
Third, the stock is below its 200-day simple day moving average (SMA). That also contrasts with the bigger indexes, which are above their respective 200-day SMAs.
Fourth, the 50-day SMA had a “death cross” below the 200-day SMA in early April and has remained there since.
Next, stochastics are dipping from an overbought condition.
Finally, AAPL is one of the most active underliers in the options market. (Its average volume of 1.1 million contracts ranks third in the S&P 500, according to TradeStation data.) That could help traders take positions with calls and puts.
TradeStation has, for decades, advanced the trading industry, providing access to stocks, options and futures. If you're born to trade, we could be for you. See our Overview for more.
Past performance, whether actual or indicated by historical tests of strategies, is no guarantee of future performance or success. There is a possibility that you may sustain a loss equal to or greater than your entire investment regardless of which asset class you trade (equities, options or futures); therefore, you should not invest or risk money that you cannot afford to lose. Online trading is not suitable for all investors. View the document titled Characteristics and Risks of Standardized Options at www.TradeStation.com . Before trading any asset class, customers must read the relevant risk disclosure statements on www.TradeStation.com . System access and trade placement and execution may be delayed or fail due to market volatility and volume, quote delays, system and software errors, Internet traffic, outages and other factors.
Securities and futures trading is offered to self-directed customers by TradeStation Securities, Inc., a broker-dealer registered with the Securities and Exchange Commission and a futures commission merchant licensed with the Commodity Futures Trading Commission). TradeStation Securities is a member of the Financial Industry Regulatory Authority, the National Futures Association, and a number of exchanges.
Options trading is not suitable for all investors. Your TradeStation Securities’ account application to trade options will be considered and approved or disapproved based on all relevant factors, including your trading experience. See www.TradeStation.com . Visit www.TradeStation.com for full details on the costs and fees associated with options.
Margin trading involves risks, and it is important that you fully understand those risks before trading on margin. The Margin Disclosure Statement outlines many of those risks, including that you can lose more funds than you deposit in your margin account; your brokerage firm can force the sale of securities in your account; your brokerage firm can sell your securities without contacting you; and you are not entitled to an extension of time on a margin call. Review the Margin Disclosure Statement at www.TradeStation.com .
TradeStation Securities, Inc. and TradeStation Technologies, Inc. are each wholly owned subsidiaries of TradeStation Group, Inc., both operating, and providing products and services, under the TradeStation brand and trademark. When applying for, or purchasing, accounts, subscriptions, products and services, it is important that you know which company you will be dealing with. Visit www.TradeStation.com for further important information explaining what this means.

Mastering the MACD - How to use it in trading?The MACD, or Moving Average Convergence Divergence, is one of the most widely used technical indicators in trading. It was developed by Gerald Appel in the late 1970s and is designed to reveal changes in the strength, direction, momentum, and duration of a trend in a stock's price. At its core, the MACD is a momentum oscillator, though it is commonly plotted as a line chart rather than the traditional bounded oscillators like the RSI. Despite being unbounded, traders use the MACD primarily to identify potential buy and sell signals.
What will be discussed?
- How does the MACD work?
- How to use the MACD in trading?
- Divergences
- Conclusion
How does the MACD work?
The MACD is calculated by subtracting the 26-period Exponential Moving Average (EMA) from the 12-period EMA. The result of this calculation is the MACD line. A nine-period EMA of the MACD line, known as the signal line, is then plotted on top of the MACD line. The third component is the MACD histogram, which represents the difference between the MACD line and the signal line. The histogram gives traders a visual cue about momentum: when the histogram bars are growing in height, momentum is increasing in the direction of the MACD line; when they shrink, momentum is slowing down.
How to use the MACD in trading?
Understanding how to use the MACD in trading requires some interpretation of the relationships between these components. One of the primary signals traders look for is a crossover between the MACD line and the signal line. When the MACD line crosses above the signal line, it is considered a bullish signal, suggesting that it might be a good time to buy. Conversely, when the MACD line crosses below the signal line, it indicates a bearish signal and potentially a good time to sell. These crossovers tend to be more significant when they occur below or above the zero line, which is where the MACD and signal line are equal. A crossover below the zero line followed by a move above it could signal the beginning of an uptrend, while a crossover above the zero line followed by a move below it might signal a downtrend.
Divergences
Another important application of the MACD is identifying divergence between the MACD and the price action of the asset. Divergence occurs when the price is moving in one direction and the MACD is moving in the opposite. For instance, if the price makes a new high but the MACD forms a lower high, it can be a warning sign that the upward momentum is weakening and that a reversal could be on the horizon. Similarly, if the price hits a new low but the MACD makes a higher low, it might suggest a potential bullish reversal.
Conclusion
In summary, the MACD is a versatile and powerful indicator that helps traders analyze the momentum and direction of a market trend. Its ability to provide both trend-following and momentum signals makes it a valuable tool in a trader’s toolkit. While it is not a standalone solution, when used properly and in conjunction with other strategies, the MACD can greatly enhance the accuracy and confidence of trading decisions.
Thanks for your support.
- Make sure to follow me so you don't miss out on the next analysis!
- Drop a like and leave a comment!

Understanding Williams %R In TradingThe Williams %R is a fast, sensitive momentum oscillator ideal for short-term trading strategies. It provides early signals of overbought and oversold conditions by comparing the current close to the high-low range over a defined lookback period (typically 14 bars).
By understanding where Williams %R fits among other oscillators, traders can better utilize it within a well-rounded, context-aware strategy.
✅ 1. What Are Momentum Indicators?
Momentum indicators are technical analysis tools used to measure the speed and strength of a price movement over time. Rather than focusing on absolute price direction, momentum indicators assess how quickly prices are changing and help traders identify potential turning points, continuation patterns, or overbought/oversold conditions.
They are particularly useful in sideways or ranging markets, where momentum shifts often precede breakouts or reversals.
Key characteristics of momentum indicators:
Often bounded within fixed ranges (e.g., 0–100 or -100 to 0)
Typically leading indicators, aiming to provide early entry/exit signals
Help spot divergence between price and momentum — a common sign of weakening trends
✅ 2. Understanding the Williams %R Indicator
≫ The Origin: Developed by Larry Williams
The Williams %R indicator was developed by Larry Williams, a renowned trader and author, in the late 1970s. Williams introduced this tool to identify potential market turning points by measuring a security’s momentum relative to its recent high-low range.
Originally intended for short-term futures trading, the indicator has since become a staple for both day traders and swing traders across various markets, including stocks, forex, and crypto.
Larry Williams famously used this indicator in his trading system when he won the 1987 World Cup Trading Championship, turning $10,000 into over $1 million in a single year—demonstrating its real-world impact when used effectively.
≫ Formula Breakdown
The Williams %R formula is as follows:
Williams %R= = (HighestHigh − Close) / (HighestHigh - LowerLow) × −100
Highest High = The highest price over the lookback period (typically 14 periods)
Lowest Low = The lowest price over the same lookback period
Close = The current closing price
This formula normalizes the current price within its recent trading range and expresses it as a negative percentage between 0 and -100.
Example:
If price is at the highest point in the range → %R = 0 (overbought)
If price is at the lowest point in the range → %R = -100 (oversold)
This inverted scale (compared to RSI) helps traders see how close the current price is to the top or bottom of the recent range, providing clues about potential reversal zones.
Williams %R in Pinescript:
//@version=5
indicator("Custom Williams %R", overlay=false)
length = input.int(14, title="Period")
highestHigh = ta.highest(high, length)
lowestLow = ta.lowest(low, length)
williamsR = (highestHigh - close) / (highestHigh - lowestLow) \* -100
plot(williamsR, title="%R", color=color.purple)
hline(-20, "Overbought", color=color.red)
hline(-80, "Oversold", color=color.green)
≫ Key Settings: 14-Period Default and Customizations
The default setting for Williams %R is 14 periods, which Larry Williams originally recommended. However, this lookback period can be customized based on your trading style and timeframe.
Here’s how different settings can be applied:
❖ Intraday Trading (5-minute to 15-minute charts):
Use a 9 to 14-period setting for faster, more responsive signals.
Ideal for scalpers or short-term traders seeking quick entries and exits.
❖ Swing Trading (1-hour to Daily charts):
Stick with the standard 14 to 21-period range.
Balances sensitivity and reliability; helps capture short- to mid-term reversals.
❖ Position/Long-Term Trading (Weekly charts or higher):
Use 21-period or longer to smooth out signals and reduce noise.
Best for spotting high-conviction turning points with less frequent trades.
🔁 Customization Tip:
You can also use multiple %R settings (e.g., 14 and 50) together to analyze short-term momentum inside longer-term trend cycles, adding depth and context to your strategy.
≫ Interpretation: Overbought and Oversold Conditions
The Williams %R scale ranges from 0 to -100 and is interpreted as follows:
❖ Overbought: %R above -20
Indicates that price is near the top of its recent range
Suggests potential for a pullback or reversal downward
❖ Oversold: %R below -80
Indicates price is near the bottom of its recent range
Suggests potential for a bounce or reversal upward
⚠️ Important: Overbought does not mean “time to sell” and oversold does not mean “time to buy.” These are conditions, not signals. Use them with confirmation tools like support/resistance zones, candlestick patterns, volume analysis, divergences and more.
✅ 3. Using Williams %R Effectively
≫ Entry Signals
Williams %R can be used to time entries based on shifts in momentum, especially around key overbought and oversold zones.
❖ Overbought/Oversold Reversals
This is the most common use of Williams %R - identifying turning points when price reaches extreme levels in its recent range:
Overbought Zone (above -20):
Signals potential bearish reversal
Look for confluence with resistance levels or bearish candlestick patterns
Confirmation often comes as %R drops back below -20
Oversold Zone (below -80):
Indicates a possible bullish reversal
Stronger when aligned with support or demand zones
Confirmation often comes when %R climbs back above -80
⚠️ Note: These are signals of potential exhaustion, not guaranteed reversals. Always pair with price action context or volume.
❖ Pullback Continuations
Williams %R can also support trend-following strategies by identifying momentum retracements within an ongoing trend:
In an uptrend, wait for Williams %R to dip below -80 (short-term oversold) and then re-enter above -80 as the trend resumes
In a downtrend, look for a rally where %R rises above -20 (short-term overbought), then re-enters below -20 to confirm trend continuation
This technique helps you buy the dip or sell the rally with better timing and risk control.
≫ Exit Signals
Williams %R can also guide exit timing by showing when momentum is weakening, especially as price moves away from extremes.
❖ Returning to Neutral Zones
When Williams %R moves back toward the -50 midpoint, it can signal that the current move is losing steam.
In a long position, if %R returns from oversold to above -50 but then flattens or dips again, it may be time to take profit
In a short position, if %R rises from overbought back below -50, it suggests selling pressure is decreasing
Exiting before full reversals can help you lock in gains while reducing risk exposure.
❖ Crossovers at Extremes
Some traders look for quick crossovers back through key thresholds (-80 and -20) as exit or reversal alerts:
If %R drops from above -20 back below it, the overbought condition may be ending
If %R rises from below -80 back above it, the oversold condition may be ending
These sharp shifts often precede momentum flips, making them useful for both exit timing and new trade setups in the opposite direction.
❖ False Signal Filtering Techniques
Williams %R can produce false signals, especially in trending or volatile markets. To improve signal quality, consider these filters:
Use with Trend Filters:
Apply moving averages (e.g., 50- or 200-period MA) to define trend direction and avoid counter-trend trades
Only trade overbought signals in a downtrend and oversold signals in an uptrend
Add Price Action Confirmation: Look for candlestick patterns (e.g., engulfing, pin bars) or support/resistance reactions before acting on %R signals
Volume Analysis: Confirm signals with volume spikes or divergences to validate strength or weakness in a move
Multiple Timeframe Confluence: Use Williams %R on a higher timeframe (e.g., 4H or daily) to establish the broader context, then align trades on a lower timeframe
Avoid during High Volatility Events: News releases and earnings reports can create erratic spikes that cause misleading %R readings
❖ Best Market Conditions: Ranging vs Trending Markets
Williams %R performs best under specific market conditions. Understanding when to use it—and when to avoid it—is key to success.
Ranging Markets: Ideal Conditions
Williams %R excels in sideways or consolidating markets
In ranges, price frequently oscillates between support and resistance, making overbought/oversold signals highly effective
Reversals from the -20 or -80 zones often align with the top and bottom of a trading range
Trending Markets: Use With Caution
During strong trends, Williams %R can stay in the overbought or oversold zone for extended periods
This makes reversal signals less reliable and more prone to false exits
In trending conditions, it’s better to:
Use Williams %R for pullback entries
Combine it with a trend filter to stay on the dominant side of momentum
✅ 4. Optimizing the Period Setting (5, 9, 14, 21, etc.)
The length of the lookback period in Williams %R significantly affects signal behavior:
Shorter periods (5, 9):
Produce faster, more frequent signals
Best for scalping and intraday trading
More sensitive but can result in higher noise and false signals
Default period (14):
Balanced responsiveness
Suitable for swing trading and multi-hour charting
Longer periods (21+):
Generate fewer but more stable signals
Best for position trading or slower-moving markets
Reduced noise but may lag in volatile conditions
🔍 To optimize:
Test various period values under consistent rules (e.g., entry/exit and risk management stay the same)
Compare outcomes across different market environments (trending, ranging, volatile)
✅ 4. Key Takeaways
Williams %R is a momentum oscillator that measures the close relative to the recent high-low range on a scale from 0 to -100.
It was developed by Larry Williams to help identify short-term overbought and oversold market conditions.
A reading above -20 suggests overbought conditions, while a reading below -80 indicates oversold conditions.
The default 14-period setting balances signal responsiveness and stability for most traders.
Shorter periods generate faster signals with more noise, while longer periods produce smoother signals with more lag.
Williams %R works best in ranging or sideways markets rather than strongly trending environments.
Traders can use %R for reversal signals or to confirm pullbacks within a broader trend.
Filtering signals with price action, support/resistance, or volume improves accuracy.
The indicator is not meant to be used in isolation and requires confirmation before acting on signals.
Backtesting across different timeframes and period settings is essential for identifying optimal usage.
Performance metrics such as win rate, R:R ratio, and drawdown help evaluate the indicator’s reliability.
Williams %R is easy to code and automate in platforms like TradingView using Pine Script.
The indicator adds value when used as part of a broader, disciplined trading system.
Williams %R is a simple yet deeply insightful momentum oscillator. While often overlooked in favor of more complex indicators, it provides a unique lens into market sentiment and price extremes. Its greatest strength lies in its clarity — helping traders time entries and exits with greater confidence when paired with context.

Solana (SOL) Rallies Above $162 Zone: Technical and FundamentalSolana (SOL) Rallies Above $162 Zone: A Technical and Fundamental Analysis of Its Path to $180 and Beyond
Solana (SOL), the high-performance blockchain network known for its lightning-fast transactions and scalable infrastructure, has once again captured the attention of cryptocurrency markets. After a fresh surge above the $162 psychological level, SOL price has entered a consolidation phase near $175, hinting at a potential breakout toward $180 and even $200. This article delves into the technical indicators, fundamental catalysts, and market sentiment driving Solana’s recent rally, while offering a balanced perspective on its short- and long-term prospects.
Technical Analysis: Rising Channel and Key Resistance Levels
1. Recent Price Action and Consolidation Phase
Solana’s price trajectory in recent weeks has been marked by volatility, but the broader trend remains bullish. On , SOL initiated a fresh upward move above the $155 and $162 zones, fueled by renewed investor confidence and macroeconomic tailwinds. The rally, however, faced resistance near $165, causing a temporary pullback.
SOL is trading near $175, consolidating gains after a 22% intraday surge. This consolidation phase aligns with the formation of a short-term rising channel on the hourly chart (data sourced from Kraken), with immediate support at $172. The channel’s upper boundary currently resides near $176, a critical resistance zone that, if breached, could trigger a fresh rally toward $180 and beyond.
2. Key Technical Indicators
• 100-Hourly Simple Moving Average (SMA): SOL price is currently trading below the 100-hour SMA, suggesting short-term bearish sentiment. However, a close above this level could signal a resumption of the uptrend.
• Relative Strength Index (RSI): The RSI on the hourly chart hovers near 50, indicating neutral momentum. A move above 60 would confirm bullish dominance.
• Volume Profile: Recent price spikes have been accompanied by elevated trading volumes, reinforcing the strength of the rally.
3. Bullish Scenario: Breaking $176 and Targeting $180
If Solana successfully clears the $176 resistance, the next immediate target would be the $180 psychological level, which coincides with the 200-day moving average. Analysts note that a sustained close above $180 could open the door to $200, driven by momentum traders and institutional inflows.
4. Bearish Scenario: Support at $172 and $165
Conversely, a breakdown below $172 would invalidate the rising channel pattern, exposing the $165 support zone. Further weakness could retest the $155 level, though this outcome appears less likely given the current bullish momentum.
________________________________________
Fundamental Drivers: 1inch Integration and Memecoin Frenzy
1. 1inch Network Integration: A Catalyst for Growth
One of the key fundamental catalysts behind Solana’s rally is its integration with 1inch Network, a decentralized exchange (DEX) aggregator and liquidity protocol. This partnership enhances Solana’s ecosystem by:
• Improving Liquidity: 1inch’s aggregation algorithms optimize trade execution on Solana-based DEXs, attracting traders and liquidity providers.
• Expanding Use Cases: The integration enables seamless cross-chain swaps, positioning Solana as a hub for multi-chain DeFi activity.
• Boosting Developer Activity: Increased infrastructure support could accelerate the launch of new decentralized applications (dApps) on Solana.
2. Memecoin Surge: The Role of Speculative Capital
Solana has emerged as a preferred platform for memecoin launches, driven by its low transaction fees and high throughput. Projects like SEED_DONKEYDAN_MARKET_CAP:BONK and NASDAQ:WEN have gained viral traction, drawing retail investors and creating a “fear of missing out” (FOMO). This speculative frenzy mirrors Ethereum’s memecoin boom in 2021–2022, with Solana’s faster and cheaper network offering a competitive edge.
3. Institutional and Retail Adoption
• Institutional Interest: Grayscale and other asset managers have added Solana to their crypto investment products, signaling growing institutional confidence.
• Retail Participation: On-chain data reveals a surge in small-cap wallet creations, indicating grassroots retail adoption.
________________________________________
Market Sentiment and Analyst Predictions
1. Bullish Outlook from Analysts
Technical analysts and on-chain experts have highlighted several factors supporting Solana’s bullish case:
• Accumulation by Whales: On-chain analytics firm Santiment reported a spike in large whale transactions, suggesting institutional accumulation.
• Network Activity Metrics: Solana’s daily active addresses and transaction volume have surged to 3-month highs, reflecting heightened network usage.
• Rare Chart Pattern: A “cup-and-handle” pattern on the daily chart implies potential for a 30–40% rally if resistance at $180 is cleared.
2. Skepticism and Risks
Critics argue that Solana’s rally is overextended, citing:
• Overbought RSI on Weekly Charts: The RSI currently resides near 75, signaling overbought conditions that could precede a correction.
• Competitive Pressure: Ethereum’s Layer 2 solutions (e.g., Arbitrum, Optimism) and rivals like Sui and Aptos continue to challenge Solana’s market share.
• Regulatory Risks: The SEC’s ongoing crackdown on crypto exchanges and tokens could dampen investor sentiment across the sector.
________________________________________
Future Projections: Path to $200 and Beyond
1. Short-Term Target: $180–$200
If Solana sustains its rally above $176, the next resistance zones to monitor are:
• $180: Psychological barrier and 200-day SMA.
• $190: Fibonacci extension level from the recent rally.
• $200: Historical resistance-turned-support from late 2023.
2. Long-Term Potential: $300+ in Q4 2024
Bullish scenarios envision SOL reaching $250–$300 by year-end, driven by:
• Spot SOL ETF Approvals: Regulatory greenlights in the U.S. could unlock billions in institutional inflows.
• AI and Web3 Integration: Solana’s partnership with AI projects (e.g., ChatGPT integration on Solana-based apps) could drive mainstream adoption.
• Bitcoin’s Bull Run: A broader crypto market rally, spurred by Bitcoin’s potential breakout above $80,000, would likely lift Solana’s price.
________________________________________
Risks and Challenges
1. Market-Wide Volatility
Cryptocurrencies remain highly correlated with macroeconomic factors, including U.S. interest rates and equity market performance. A sudden Federal Reserve pivot toward hawkish policy or a stock market crash could trigger a sector-wide sell-off.
2. Network Downtime and Security Risks
Solana has experienced periodic network outages and congestion during high demand. While the team has addressed these issues through upgrades, any future disruptions could erode trust.
3. Regulatory Uncertainty
The SEC’s classification of SOL as a security (vs. commodity) remains unresolved. Adverse regulatory rulings could impose restrictions on trading and staking.
________________________________________
Conclusion: Is Solana a Buy Ahead of the Next Leg Up?
Solana’s recent rally above $162 and consolidation near $175 underscores its resilience and growing appeal among traders and developers. Technical indicators, coupled with fundamental catalysts like 1inch integration and memecoin adoption, paint a bullish picture for SOL’s trajectory toward $180 and $200. However, investors must remain cautious of overbought conditions, competitive pressures, and regulatory risks.
For those considering exposure, a dollar-cost averaging (DCA) strategy could mitigate volatility risks, while close monitoring of on-chain metrics and macroeconomic trends will be critical. As with all investments in crypto, thorough research and risk management are paramount.
Disclaimer: This article is for informational purposes only and does not constitute financial advice. Cryptocurrency markets are highly volatile and speculative. Always consult a qualified professional before making investment decisions.

ETH Surges 20% Post-Pectra: Crypto's Ultimate Comeback?Ether Clocks 'Insane' 20% Candle Post-Pectra — A Turning Point?
The cryptocurrency market witnessed a remarkable event as Ethereum (ETH) surged by an impressive 20% following the successful implementation of the Pectra hard fork. This dramatic price movement has caught the attention of traders, investors, and analysts alike, sparking intense debate about whether this represents a genuine turning point for the second-largest cryptocurrency by market capitalization or merely a temporary respite in a challenging market environment.
The Pectra Catalyst
The Pectra hard fork, representing one of Ethereum's most significant technical upgrades since its transition to proof-of-stake, was successfully implemented in early 2025. This upgrade introduced crucial improvements to the Ethereum network, including enhanced transaction processing efficiency, reduced gas fees, and expanded smart contract functionality.
Unlike previous upgrades that sometimes resulted in "buy the rumor, sell the news" reactions, Pectra's implementation appears to have triggered substantial positive price action. The 20% candle marked Ethereum's largest single-day gain in over 18 months, propelling ETH past the crucial $1,900 resistance level that had previously acted as a ceiling for price movements.
The timing of the upgrade coincided with increasing institutional interest in Ethereum, creating perfect conditions for a significant price movement. Data from on-chain analytics platforms indicates that large wallet addresses began accumulating ETH in the weeks leading up to Pectra, suggesting informed capital was positioning ahead of the technical catalyst.
Institutional Buying Signals
On-chain metrics reveal compelling evidence of institutional participation in Ethereum's recent surge. Blockchain analytics firm Glassnode reported a substantial increase in large-value transactions exceeding $1 million in the 72 hours surrounding the Pectra implementation, with transaction volume reaching levels not seen since late 2023.
Several key metrics support this institutional narrative:
1. Exchange outflows have accelerated, with over 200,000 ETH leaving centralized exchanges in a single 48-hour period post-Pectra, indicating buyers intend to hold rather than trade.
2. The number of addresses holding more than 1,000 ETH increased by 2.8% in just one week, representing substantial accumulation by wealthy entities.
3. Futures open interest has expanded by over $2 billion since the Pectra announcement, demonstrating increased leveraged positioning.
4. Options markets show a significant skew toward calls, with the put/call ratio reaching its lowest level in 14 months.
These metrics collectively suggest that smart money sees the Pectra upgrade as a legitimate inflection point for Ethereum rather than a temporary technical bounce.
The Long Position Explosion
Perhaps most intriguing is the dramatic increase in long positions across various trading platforms. Data from cryptocurrency derivatives exchanges shows that long-to-short ratios have reached levels not seen since Ethereum's previous major bull run in 2021.
This positioning dynamic creates an interesting technical setup where further price increases could trigger a positive feedback loop as short sellers are forced to cover their positions, potentially accelerating ETH's upward movement.
Retail Sell-Off vs. Whale Accumulation
A fascinating dynamic has emerged in Ethereum's market structure: while retail investors appear to be reducing exposure, larger entities ("whales") are aggressively accumulating. This divergence in behavior between market participants has created an unusual tension in ETH's price action.
Blockchain analytics firm Santiment reported that addresses holding between 0.1 and 10 ETH have decreased their collective holdings by approximately 3% over the past month, indicating retail profit-taking or repositioning. Simultaneously, addresses holding over 1,000 ETH have increased their positions by nearly 7%.
This pattern often emerges during major market transitions, where retail participants, scarred by previous drawdowns, remain skeptical of recovery signals while institutional investors position for longer-term trends based on fundamental catalysts.
This dynamic creates an interesting market structure where future price movements may depend on which cohort ultimately proves correct in their assessment of Ethereum's prospects.
Technical Breakout Analysis
From a technical analysis perspective, Ethereum's 20% surge represents a significant breakout from multiple resistance levels that had contained price action for months. The move pushed ETH decisively above its 200-day moving average, a key indicator watched by trend-following traders.
The volume profile accompanying the move also supports the legitimacy of the breakout, with transaction volume reaching its highest level in nine months. This high-volume breakout typically indicates strong conviction behind the price movement rather than a technical fake-out.
Additionally, the Relative Strength Index (RSI), while showing overbought conditions in the short term, has broken out of a long-term downtrend on higher timeframes, suggesting potential for sustained momentum despite possible near-term consolidation.
Macro Context and Ethereum's Narrative Shift
Ethereum's dramatic move occurs against a complex macroeconomic backdrop that had previously contributed to crypto market weakness. Recent signals of potential monetary policy shifts, including discussions of rate cuts by central banks, have created a more favorable environment for risk assets broadly.
Beyond pure price action, Ethereum's narrative has evolved considerably in recent months. After facing criticism regarding high transaction fees and scaling limitations, the successful implementation of Pectra addresses several key concerns that had dampened enthusiasm for the network.
The upgrade's focus on reducing gas fees and improving transaction throughput directly counters the competitive threats from alternative Layer 1 and Layer 2 solutions that had been gaining traction by positioning themselves as more efficient alternatives to Ethereum.
This narrative rehabilitation, combined with Ethereum's established network effects and developer ecosystem, creates compelling fundamental support for the recent price action.
Sustainability Questions and Potential Challenges
While enthusiasm surrounding Ethereum's post-Pectra surge runs high, significant questions remain regarding the sustainability of this momentum. Several potential challenges could impact ETH's trajectory in the coming months:
1. Technical Overextension: The speed and magnitude of the 20% move have pushed short-term technical indicators into overbought territory, potentially setting up conditions for a correctional pullback.
2. Regulatory Uncertainty: The evolving regulatory landscape for cryptocurrencies, particularly regarding potential security classifications and staking activities, continues to create background uncertainty for Ethereum.
3. Competitive Pressures: Despite Pectra's improvements, alternative blockchains continue to innovate rapidly, potentially challenging Ethereum's dominance in specific use cases.
4. Macro Reversal Risk: Any shift back toward hawkish monetary policy could negatively impact risk assets broadly, potentially including Ethereum despite its technological progress.
5. Execution Risk: While Pectra's implementation was successful, future technical upgrades still carry execution risk that could impact market confidence.
Conclusion: A Genuine Turning Point?
As market participants attempt to determine whether Ethereum's "insane" 20% candle represents a genuine turning point or a temporary deviation, the weight of evidence increasingly suggests this could indeed mark a significant inflection point in ETH's market cycle.
The confluence of technical breakouts, on-chain accumulation signals, derivative positioning, and fundamental improvements through the Pectra upgrade creates a compelling case for sustained momentum. The divergence between retail selling and institutional accumulation further supports the notion that a meaningful market transition may be underway.
However, sustainable price appreciation will likely require continued technical execution, expanding adoption metrics, and at minimum, a neutral macro environment that doesn't actively handicap risk assets.
For investors and traders, the coming weeks will be crucial in determining whether Ethereum can build upon this momentum or if the surge represents another false dawn in a challenging market. But regardless of short-term price action, the successful implementation of Pectra unquestionably strengthens Ethereum's long-term value proposition as a leading blockchain infrastructure platform.

Best Buy Bounces Toward GapBest Buy has rebounded from last month’s sharp drop, but some traders may expect another push to the downside.
The first pattern on today’s chart is the price zone between $67.16 and $73.28. That matches the bearish price gap on April 3, one day after hefty tariffs were announced.
The electronics retailer’s recent peak has also occurred at its trough last May, which was the low for all of 2024. Has old support become new resistance?
Next, the stochastic oscillator is turning down from an overbought condition.
Third, BBY is near its 21-day exponential moving average. Slipping below it could suggest the short-term direction is getting less bullish.
Finally, the 50-day simple moving average (SMA) had a “death cross” below the 200-day SMA in January and has remained there since. Such an alignment may be consistent with a longer-term downtrend.
TradeStation has, for decades, advanced the trading industry, providing access to stocks, options and futures. If you're born to trade, we could be for you. See our Overview for more.
Past performance, whether actual or indicated by historical tests of strategies, is no guarantee of future performance or success. There is a possibility that you may sustain a loss equal to or greater than your entire investment regardless of which asset class you trade (equities, options or futures); therefore, you should not invest or risk money that you cannot afford to lose. Online trading is not suitable for all investors. View the document titled Characteristics and Risks of Standardized Options at www.TradeStation.com . Before trading any asset class, customers must read the relevant risk disclosure statements on www.TradeStation.com . System access and trade placement and execution may be delayed or fail due to market volatility and volume, quote delays, system and software errors, Internet traffic, outages and other factors.
Securities and futures trading is offered to self-directed customers by TradeStation Securities, Inc., a broker-dealer registered with the Securities and Exchange Commission and a futures commission merchant licensed with the Commodity Futures Trading Commission). TradeStation Securities is a member of the Financial Industry Regulatory Authority, the National Futures Association, and a number of exchanges.
TradeStation Securities, Inc. and TradeStation Technologies, Inc. are each wholly owned subsidiaries of TradeStation Group, Inc., both operating, and providing products and services, under the TradeStation brand and trademark. When applying for, or purchasing, accounts, subscriptions, products and services, it is important that you know which company you will be dealing with. Visit www.TradeStation.com for further important information explaining what this means.

Crude Oil 4h time frame , potential double bottom🛢️ WTI Crude Oil (WTI3!) 4H Chart Analysis – May 5, 2025
🧠 Technical Snapshot:
Market Structure:
Clear downtrend from late April into early May.
Price recently found support at $54.38, a level that previously held as demand in early April.
Current Price Action:
Strong bullish reaction from the $54.38–54.16 zone.
Breakout attempt forming a higher low after retesting the lows, suggesting a potential bullish reversal or range play.
Trade Setup Observed:
Entry: ~$56.08
Stop-Loss: ~$54.17
Take-Profit: ~$63.50
Risk-to-Reward: ≈ 1:3.5 — excellent setup from a reward perspective.
🔍 Bias: Bullish (Short-term to Mid-term Reversal)
Why?
Price bounced from key support zone where price also previously reversed in early April.
Bullish engulfing candle suggests buyer interest.
Entry aligned with a potential double-bottom formation.
📍 Key Technical Levels:
Support:
$54.38 (Major swing low support)
$54.16 (Stop zone)
Resistance:
$63.50 (Major horizontal resistance zone)
Above $63.50 = Potential trend reversal confirmation
🔔 Strategy Suggestion:
A pullback entry toward $55.50–$56.00 may offer a better risk-adjusted entry.
Close partial profits near $60.00 if momentum slows before final TP.

$100k Bitcoin IMMINENT? Price Ignites After Major Surge!The cryptocurrency market is once again crackling with energy, and at the heart of the storm stands Bitcoin (BTC). The world's largest and original cryptocurrency is staging a remarkable comeback, shattering recent resistance levels and reigniting fervent speculation about its potential to not only revisit but decisively conquer the psychologically potent $100,000 milestone. Following a period of consolidation and downward pressure, a powerful surge has propelled Bitcoin to its highest price point in over ten weeks, signaling a potential paradigm shift in market sentiment and trading behavior.
The Breakout: Shaking Off Recent Slumber
The recent price action has been decisive. Bitcoin climbed as much as 3.1% to achieve a weekly high of $97,483. This marks the most robust price level observed since February 21st, representing a significant break from the sideways and sometimes downward trajectory that characterized parts of the preceding weeks. The memory of Bitcoin crossing the $100,000 threshold on February 7th is still fresh, adding weight to the current push towards that level.
This upward momentum provides a stark contrast to the market conditions seen earlier. There is downward pressure attributed to geopolitical factors and economic policies, such as potential tariff implementations, which had previously triggered sell-offs impacting both traditional stock markets and the digital asset space. Furthermore, the market had to digest a significant correction following Bitcoin's earlier peak. While the specifics of past peaks can be debated based on different exchange data, the narrative of a significant pullback followed by the current strong recovery is clear. Bitcoin weathered a period where it seemed momentum might stall, but the bulls have evidently returned with renewed vigor.
Shifting Market Dynamics: From Macro-Driven to Momentum-Fueled
Perhaps one of the most crucial insights from the current rally is the apparent shift in what's driving price action. For much of the past year or two, Bitcoin's price movements often seemed heavily correlated with macroeconomic factors – inflation data releases, central bank interest rate decisions, geopolitical tensions, and regulatory pronouncements. While these factors undoubtedly still play a role, the current surge suggests a transition towards a market more heavily influenced by internal dynamics: spot market demand and trading momentum.
There are traders who are increasingly reacting to price action itself, buying into strength and potentially creating a self-reinforcing cycle. The focus is less on predicting the next Federal Reserve move and more on the immediate supply and demand dynamics visible on exchanges.
Bitcoin isn't entirely decoupled from macro trends, but its internal market structure, particularly the influence of new financial instruments like ETFs and strong spot buying, is asserting greater influence on short-to-medium term price discovery.
The ETF Factor: Opening the Floodgates for Capital
The launch and subsequent success of spot Bitcoin ETFs in the United States have been a game-changer, and their impact is arguably a primary catalyst for the current bullishness. These regulated investment vehicles provide traditional investors and institutions with a familiar and accessible way to gain exposure to Bitcoin without directly holding the underlying asset. The result has been a torrent of new capital flowing into the market.
There has been a staggering inflow of over $3.2 billion entering Bitcoin and Ethereum tracking ETFs in the preceding week alone. BlackRock's Bitcoin Trust ETF (IBIT), a major player in the space, recorded nearly $1.5 billion in inflows during that period, marking its highest weekly intake for the year according to Bloomberg data.
These inflows are not just numbers on a spreadsheet; they translate directly into buying pressure in the spot market. ETF issuers must purchase actual Bitcoin to back the shares they issue to investors. This sustained, large-scale buying provides a powerful tailwind for the price, absorbing sell orders and driving the market upwards. The success of these ETFs also lends legitimacy to Bitcoin as an asset class, potentially encouraging further adoption and investment from previously hesitant institutional players. The "demand" aspect of the current rally is heavily underpinned by this ongoing ETF phenomenon.
Options Market Signals: Betting Big on $100,000
Further evidence of the bullish sentiment surrounding Bitcoin, particularly the $100,000 target, comes from the derivatives market, specifically options trading. Options contracts give traders the right, but not the obligation, to buy (call option) or sell (put option) an asset at a specific price (strike price) before a certain expiration date.
According to data from Coinglass and the major crypto options exchange Deribit, demand for upside options has surged. Notably, call options with a $100,000 strike price exhibit the most significant open interest across various expiration dates. Open interest represents the total number of outstanding contracts that have not yet been settled. High open interest in $100k call options indicates that a large number of traders are positioning themselves to profit from Bitcoin reaching or exceeding this level. While options data reflects expectations rather than guarantees, such concentrated betting on a specific upside target underscores the powerful psychological pull of the $100k mark and the conviction held by a significant segment of the market.
Warming Up: Reading the Technical and On-Chain Pre-Rally Signals
Beyond the ETF flows and options market sentiment, analysts are pointing to various technical and on-chain indicators suggesting Bitcoin is indeed "warming up" for a potentially larger move, exhibiting signals seen before previous major breakouts. This aligns with the theme of "Bitcoin Flashing Pre-Rally Signals Seen Before Major 2024 Breakouts."
• Technical Analysis:
o Breaking Resistance: The surge above the 10-week high ($97,483) was a critical technical breakout, overcoming a level that had previously capped price advances. Holding above this level turns former resistance into potential support.
o Moving Averages: Traders watch moving averages closely. A "Golden Cross" (where a shorter-term moving average, like the 50-day, crosses above a longer-term one, like the 200-day) is often considered a strong long-term bullish signal. While specific configurations vary, bullish alignment of key moving averages often precedes sustained rallies.
o Momentum Indicators: Indicators like the Relative Strength Index (RSI) and Moving Average Convergence Divergence (MACD) can signal building momentum. An RSI breaking above key levels without yet reaching extremely overbought territory, or a bullish MACD crossover, can suggest further upside potential.
o Volume Confirmation: Crucially, significant price breakouts should ideally be accompanied by strong trading volume, indicating conviction behind the move. Analysts look for volume confirmation to validate the strength of the rally.
• On-Chain Analysis: On-chain data provides insights into the behavior of Bitcoin holders and network activity.
o Exchange Outflows: Sustained periods where more Bitcoin is withdrawn from exchanges than deposited often suggest investors are moving coins to private wallets for long-term holding ("HODLing"), reducing the immediately available supply for sale.
o Accumulation Trends: Metrics tracking the behavior of large holders ("whales") and long-term holders can reveal accumulation patterns. Increased buying from these cohorts is typically seen as bullish.
o Supply Dynamics: Indicators looking at the supply held by short-term versus long-term holders, or metrics like the Long-Term Holder Spent Output Profit Ratio (LTH-SOPR), can gauge whether significant profit-taking is occurring that could stall a rally. A low LTH-SOPR might suggest long-term holders are not yet selling aggressively.
o Funding Rates: In the perpetual futures market, positive funding rates generally indicate that traders holding long positions are paying those holding short positions, suggesting a bullish bias in the derivatives space.
When multiple technical and on-chain indicators align, as some analysts suggest is happening now, it builds a stronger case that the market is preparing for a significant move, lending credence to the "pre-rally signals" narrative.
Mapping the Path to $100k and Beyond: Three Potential Scenarios
While the current momentum is palpable, the path forward is never certain. Analysts are mapping various possibilities, acknowledging both the bullish potential and the inherent risks. Here are three broad scenarios that could unfold:
1. The Momentum Continuation Scenario: Fueled by continued strong ETF inflows, positive market sentiment amplified by the $100k narrative, and potentially favorable (or at least neutral) macroeconomic developments, Bitcoin continues its ascent relatively unimpeded. It decisively breaks the $100,000 barrier, potentially triggering a wave of Fear Of Missing Out (FOMO) from retail investors and further institutional interest. In this scenario, the market quickly looks towards higher targets, exploring price discovery in uncharted territory above $100k (or above its previous ATH depending on the data source used). Key challenges would be maintaining buying pressure and overcoming psychological resistance levels beyond $100k.
2. The Consolidation and Recharge Scenario: Bitcoin's rally meets significant resistance near or just below the $100,000 level. Profit-taking increases, and early ETF buyers might look to secure gains. Instead of a sharp rejection, the price enters a period of consolidation – trading sideways within a defined range or experiencing a moderate pullback. This phase allows the market to digest recent gains, build a stronger base of support (potentially around the recent breakout level near GETTEX:97K or slightly lower), and allows moving averages to catch up. If support holds and buying demand re-emerges (perhaps triggered by fresh ETF inflows or positive news), this consolidation could form the launchpad for the next sustained leg up towards and beyond $100k. This scenario tests the resilience of the buyers.
3. The Macro Headwind or Correction Scenario: Despite the strong internal dynamics, external factors reassert control. An unexpected negative catalyst emerges – perhaps significantly worse-than-expected inflation data forcing a hawkish central bank response, a major geopolitical escalation, unforeseen regulatory action against crypto, or a sharp downturn in traditional markets triggering widespread risk-off sentiment. Alternatively, the rally could simply run out of steam, hitting a "sell wall" at $100k that overwhelms buying pressure, leading to a sharper correction back towards lower support levels ($90k, $85k, or even lower). This scenario underscores the ever-present volatility and risk in the crypto market, reminding investors that parabolic runs can face abrupt reversals.
The Crucial Question: Can BTC Buying Demand Meet the Challenge?
Ultimately, whether Bitcoin successfully retests and surpasses $100,000 hinges on the sustainability of the current buying demand. Several factors support continued demand:
• Ongoing ETF Flows: As long as institutions and retail investors continue allocating capital to spot Bitcoin ETFs, this provides a consistent source of buying pressure.
• Growing Adoption Narrative: Each price surge and new institutional product launch reinforces the narrative of Bitcoin's growing acceptance and potential role as a store of value or portfolio diversifier.
• Halving Effect (Long-Term): While the Bitcoin Halving (reduction in new supply issuance) is a past event, its long-term supply-constricting effects are believed by many to contribute to price appreciation over time.
• Potential Retail FOMO: A decisive break above $100k could capture mainstream media attention and trigger a wave of buying from retail investors fearing they might miss out on further gains.
However, potential headwinds exist:
• Profit-Taking: Investors who bought at lower levels, including early ETF participants, may look to lock in substantial profits as the price approaches major milestones.
• Regulatory Uncertainty: While ETFs marked progress, the broader regulatory landscape for crypto remains complex and subject to change globally.
• Macroeconomic Risks: Inflation, interest rates, and potential recessionary fears haven't disappeared and could resurface to dampen risk appetite.
• Market Saturation/Exhaustion: Rallies can lose momentum if buying power becomes exhausted without fresh catalysts.
The interplay between these forces will determine if the current buying wave has the strength and endurance to overcome sell pressure and propel Bitcoin into six-figure territory sustainably.
Conclusion: A Critical Juncture for Bitcoin
Bitcoin stands at a fascinating and potentially pivotal juncture. The recent surge, breaking a 10-week high and pushing towards the $100,000 horizon, is fueled by a powerful combination of factors unlike those seen in previous cycles. The institutional validation and massive capital inflows brought by spot Bitcoin ETFs represent a fundamental shift, seemingly driving a transition towards momentum and spot-demand-based trading. Bullish signals from the options market and various technical/on-chain indicators add fuel to the fire, painting a picture of a market "warming up" for potentially significant further gains.
Yet, the path to $100,000 and beyond is fraught with challenges. Market history teaches that parabolic advances often face corrections, and the ever-present risks of macroeconomic shifts and regulatory developments cannot be ignored. The sustainability of the current buying frenzy, particularly the crucial ETF inflows, will be rigorously tested as Bitcoin confronts the immense psychological and technical resistance clustered around the six-figure mark.
Whether Bitcoin achieves a swift breakout, undergoes a period of consolidation, or faces a pullback remains to be seen. However, the current price action and underlying market dynamics have undeniably reignited excitement and placed the $100,000 target firmly back in the spotlight, marking a critical chapter in Bitcoin's ongoing evolution within the global financial ecosystem. Investors and observers alike will be watching intently to see if the current surge has the power to meet the demand challenge and etch a new all-time high into the history books.
Disclaimer: The information presented in this article is for informational and educational purposes only. It is based on the analysis of the provided source material and general market knowledge. It does not constitute financial advice. Investing in cryptocurrencies involves significant risk, including the potential loss of principal. Readers should conduct their own thorough research and consult with a qualified financial advisor before making any investment decisions.

Is Seagate Overbought?Seagate Technology has rallied sharply in recent weeks, but some traders may think the data-storage company is overbought.
The first pattern on today’s chart is the March low of $82.88. STX plunged three sessions later after tariffs were announced. Prices have returned to that level and now seem to be stalling. Has old support become new resistance?
Next, stochastics have reached an overbought condition.
Third, the 50-day simple moving average (SMA) had a “death cross” below the 200-day SMA in December. It’s stayed below that slower line since, which may suggest its longer-term trend has gotten more bearish.
TradeStation has, for decades, advanced the trading industry, providing access to stocks, options and futures. If you're born to trade, we could be for you. See our Overview for more.
Past performance, whether actual or indicated by historical tests of strategies, is no guarantee of future performance or success. There is a possibility that you may sustain a loss equal to or greater than your entire investment regardless of which asset class you trade (equities, options or futures); therefore, you should not invest or risk money that you cannot afford to lose. Online trading is not suitable for all investors. View the document titled Characteristics and Risks of Standardized Options at www.TradeStation.com . Before trading any asset class, customers must read the relevant risk disclosure statements on www.TradeStation.com . System access and trade placement and execution may be delayed or fail due to market volatility and volume, quote delays, system and software errors, Internet traffic, outages and other factors.
Securities and futures trading is offered to self-directed customers by TradeStation Securities, Inc., a broker-dealer registered with the Securities and Exchange Commission and a futures commission merchant licensed with the Commodity Futures Trading Commission). TradeStation Securities is a member of the Financial Industry Regulatory Authority, the National Futures Association, and a number of exchanges.
TradeStation Securities, Inc. and TradeStation Technologies, Inc. are each wholly owned subsidiaries of TradeStation Group, Inc., both operating, and providing products and services, under the TradeStation brand and trademark. When applying for, or purchasing, accounts, subscriptions, products and services, it is important that you know which company you will be dealing with. Visit www.TradeStation.com for further important information explaining what this means.

MACD^3LOOKS GOOD. The graphing indicator looks good based on the fascinating relationship to where the whereabouts of the price remains inline with the outward pressure all around the world; I better get going then why don't I.

Industrial ETF May Face ResistanceThe SPDR Select Sector Industrial ETF dropped in early April, and some traders may expect another push to the downside.
The first pattern on today’s chart is the March 13 low of $128.26. XLI peaked $0.44 under that level this month, which may suggest old support has become new resistance.
Second, the 50-day simple moving average (SMA) recently had a “death cross” below its 200-day SMA. That may suggest the long-term trend has gotten more bearish.
Third, the stochastics oscillator’s leading line crossed under the smoothing signal line.
Fourth, the 8-day exponential moving average (EMA) has remained under the 21-day EMA.
Finally, XLI hit a 52-weeek low of $112.75 on April 7. Is a retest of that support needed?
Standardized Performances for the ETF mentioned above:
SPDR Select Sector Industrial ETF (XLI)
1-year: +4.06%
5-years: +122.11%
10-year: +135.02%
(As of March 31, 2025)
Exchange Traded Funds ("ETFs") are subject to management fees and other expenses. Before making investment decisions, investors should carefully read information found in the prospectus or summary prospectus, if available, including investment objectives, risks, charges, and expenses. Click here to find the prospectus.
TradeStation has, for decades, advanced the trading industry, providing access to stocks, options and futures. If you're born to trade, we could be for you. See our Overview for more.
Past performance, whether actual or indicated by historical tests of strategies, is no guarantee of future performance or success. There is a possibility that you may sustain a loss equal to or greater than your entire investment regardless of which asset class you trade (equities, options or futures); therefore, you should not invest or risk money that you cannot afford to lose. Online trading is not suitable for all investors. View the document titled Characteristics and Risks of Standardized Options at www.TradeStation.com . Before trading any asset class, customers must read the relevant risk disclosure statements on www.TradeStation.com . System access and trade placement and execution may be delayed or fail due to market volatility and volume, quote delays, system and software errors, Internet traffic, outages and other factors.
Securities and futures trading is offered to self-directed customers by TradeStation Securities, Inc., a broker-dealer registered with the Securities and Exchange Commission and a futures commission merchant licensed with the Commodity Futures Trading Commission). TradeStation Securities is a member of the Financial Industry Regulatory Authority, the National Futures Association, and a number of exchanges.
TradeStation Securities, Inc. and TradeStation Technologies, Inc. are each wholly owned subsidiaries of TradeStation Group, Inc., both operating, and providing products and services, under the TradeStation brand and trademark. When applying for, or purchasing, accounts, subscriptions, products and services, it is important that you know which company you will be dealing with. Visit www.TradeStation.com for further important information explaining what this means.

BTC.D Bitcoin Dominance!Are you ready for a big Altcoin rally? We are facing an Altcoin Season that may not last long. Load Your Bullets!

XRP: Fresh Gains Ahead? Bullish Setup Intensifies.XRP Price Poised for Potential Breakout? Bulls Eye Fresh Gains Amid Bullish Setup as Open Interest Surges
The cryptocurrency market is a relentless arena of volatility, sentiment shifts, and technical battles. Among the major digital assets, XRP, the native token of the XRP Ledger, often finds itself at the center of intense debate and speculation, largely due to its unique position, technological proposition, and the long-standing regulatory shadow cast by the Ripple vs. SEC lawsuit in the United States. Recently, however, a confluence of factors has ignited discussions about XRP's potential for a significant upward move. With the price consolidating and holding firm above the psychologically crucial $2 mark, coupled with a notable surge in derivatives' open interest, bullish traders are keenly watching for signs that XRP might be coiling up for its next major run.
The Significance of the $2 Threshold: A Psychological and Technical Battleground
Price levels ending in round numbers often act as powerful psychological magnets in financial markets, and $2 is no exception for XRP. Crossing and holding above such a level can signal a significant shift in market sentiment, transforming previous resistance into potential support. For XRP, reclaiming and maintaining ground above $2 carries several implications:
1. Psychological Boost: A sustained presence above $2 instills confidence among existing holders and can attract new buyers who perceive it as a validation of strength. It breaks a mental barrier that may have previously deterred accumulation.
2. Technical Support: Historically significant price levels often become areas where buying interest clusters. If XRP consistently finds buyers stepping in around the $2 mark, it establishes this zone as a credible technical support level. A strong support base is crucial for launching further upside attempts, as it provides a foundation from which bulls can stage rallies.
3. Confirmation of Strength: In technical analysis, breaking above a major resistance level (which $2 may have been previously) and then successfully defending it as support (a "resistance-support flip") is considered a strong bullish signal. It suggests that the underlying demand is robust enough to absorb selling pressure at that level.
The current price action, characterized by XRP holding above $2 despite broader market fluctuations, is therefore a key factor fueling bullish optimism. It suggests resilience and a potential accumulation phase where buyers are absorbing supply, potentially setting the stage for the next leg higher. However, a decisive break below this level could conversely signal weakness and potentially trigger further downside.
Decoding the Bullish Technical Setup: Chart Patterns and Indicators Aligning?
Beyond the $2 level itself, chart patterns and technical indicators are providing further clues that bulls are closely monitoring. While specific patterns evolve rapidly, several common bullish setups could be in play or forming:
1. Consolidation Patterns: Often, before a significant price move (either up or down), an asset enters a period of consolidation. This can take the form of patterns like:
o Ascending Triangles: Characterized by a horizontal resistance line and a rising trendline of support (higher lows). A breakout above the horizontal resistance is typically considered a bullish continuation signal.
o Bull Flags or Pennants: These are short-term continuation patterns that form after a sharp price increase (the "flagpole"). They represent a brief pause before the trend potentially resumes. A breakout above the flag/pennant's upper boundary signals a likely continuation of the prior uptrend.
o Range Consolidation: Price trading sideways between defined support and resistance levels. A decisive break above the range resistance, especially on high volume, can signal the start of a new uptrend.
2. Moving Averages: Key moving averages (MAs) like the 50-day and 200-day simple moving averages (SMAs) are widely watched indicators of medium and long-term trends.
o Golden Cross: A bullish signal occurs when the shorter-term MA (e.g., 50-day SMA) crosses above the longer-term MA (e.g., 200-day SMA). This indicates that short-term momentum is strengthening relative to the long-term trend.
o Price Above Key MAs: XRP trading consistently above both the 50-day and 200-day MAs is generally viewed as a sign of a healthy uptrend. These MAs can also act as dynamic support levels during pullbacks.
3. Momentum Indicators:
o Relative Strength Index (RSI): This indicator measures the speed and change of price movements. An RSI reading above 50 suggests that bullish momentum is dominant, while readings above 70 indicate potentially overbought conditions (though an asset can remain overbought during strong uptrends). A sustained RSI above 50, possibly bouncing off this level during dips, supports a bullish outlook.
o Moving Average Convergence Divergence (MACD): This trend-following momentum indicator shows the relationship between two exponential moving averages (EMAs). A bullish signal occurs when the MACD line crosses above the signal line, especially if this happens above the zero line.
o
If multiple technical indicators and patterns align – for instance, XRP holding above $2, breaking out of a consolidation pattern, trading above key MAs, and showing strong momentum on the RSI and MACD – the case for a potential run becomes significantly stronger.
Open Interest Surges: Fueling the Fire or Adding Risk?
A particularly noteworthy development often accompanying potential price breakouts is a surge in Open Interest (OI) in the derivatives market (futures and perpetual swaps). Open Interest represents the total number of outstanding derivative contracts that have not been settled. It essentially measures the total amount of capital committed to that market.
• Rising OI + Rising Price: This is generally considered a bullish sign. It suggests that new money is flowing into the market, primarily opening long positions, reflecting increasing conviction among buyers that the price will continue to rise. The new longs add buying pressure and fuel the uptrend.
• Rising OI + Falling Price: This is typically bearish, indicating new money is entering to open short positions, betting on further price declines.
• Falling OI + Rising Price: This might suggest that the rally is driven by short-covering (short sellers buying back to close their positions) rather than new buying interest, potentially making the rally less sustainable.
• Falling OI + Falling Price: This often indicates that traders are losing conviction and closing out existing long positions, potentially signaling the end of a downtrend but not necessarily the start of an uptrend.
The reported surge in XRP's Open Interest while the price holds above $2 aligns with the bullish interpretation (Rising OI + Stable/Rising Price). It implies that traders are increasingly betting on upside continuation, adding capital to back their bullish theses.
However, high Open Interest also introduces risks. A large number of leveraged long positions makes the market vulnerable to a "long squeeze." If the price unexpectedly drops (perhaps due to negative news or a broader market downturn), it can trigger cascading liquidations of these leveraged longs. This forced selling adds intense downward pressure, potentially leading to a sharp price crash. Therefore, while rising OI can confirm bullish sentiment, it also amplifies potential volatility in both directions.
Fundamental Factors: The Ever-Present Shadow of the SEC Lawsuit and XRPL Developments
No analysis of XRP is complete without considering the fundamental factors, dominated by the ongoing legal battle between Ripple Labs and the U.S. Securities and Exchange Commission (SEC). The lawsuit, initiated in December 2020, alleges that Ripple conducted an unregistered securities offering through its sales of XRP.
• The SEC Lawsuit: This remains the single most significant factor influencing XRP's price potential, particularly concerning US-based investors and exchanges.
o Positive Outcome/Settlement: A favorable ruling for Ripple, a clear settlement defining XRP as not being a security, or favorable legislation clarifying the status of digital assets could remove a massive cloud of uncertainty. This would likely lead to relistings on US exchanges and potentially trigger a substantial price rally, potentially decoupling XRP somewhat from the broader market trend.
o Negative Outcome: A ruling deeming XRP a security could have severe negative consequences, potentially limiting its utility, hindering adoption (especially in the US), and causing a significant price decline.
o Ongoing Uncertainty: As long as the case drags on, it acts as a headwind, potentially suppressing XRP's price relative to other cryptocurrencies that don't face similar regulatory challenges. Positive developments or perceived wins for Ripple during the legal proceedings often cause short-term price spikes.
• XRP Ledger (XRPL) Developments and Adoption: Beyond the lawsuit, the underlying technology and its adoption matter.
o On-Demand Liquidity (ODL): Ripple's primary use case for XRP, facilitating low-cost, instant cross-border payments, continues to see adoption, primarily outside the US. Growth in ODL volume signifies real-world utility.
o Central Bank Digital Currencies (CBDCs): Ripple is actively engaging with central banks globally, exploring how the XRPL could potentially support CBDC initiatives. Success in this area could significantly boost the ledger's profile and potentially XRP's utility.
o Other Use Cases: Developments around NFTs, decentralized finance (DeFi), and smart contracts on the XRPL, while perhaps less mature than on other blockchains, contribute to the ecosystem's overall value proposition.
Will Buyers Push XRP Further? Potential Targets and Risks
Given the confluence of factors – holding the $2 support, potentially bullish technical setups, and rising open interest – the question remains: can buyers sustain the momentum and push XRP significantly higher?
• Potential Upside Targets: If the bullish scenario plays out and XRP breaks decisively upwards, potential resistance levels and targets could include:
o Recent swing highs (e.g., $2.20, $2.50, depending on recent price action).
o Psychologically important levels ($2.50, $3.00).
o Fibonacci extension levels based on previous price swings.
o The previous all-time high (around $3.40 - $3.84 depending on the exchange data).
• Key Risks: Despite the bullish signals, significant risks persist:
o SEC Lawsuit: Any negative news or ruling remains the primary threat.
o Market-Wide Correction: A downturn in Bitcoin or the broader crypto market could easily drag XRP down, regardless of its individual setup.
o Failure at Resistance: If XRP attempts to rally but fails to break through key overhead resistance levels, it could lead to a reversal.
o Breakdown Below Support: A decisive drop below the $2 support level would invalidate the immediate bullish thesis and could open the door to lower targets (e.g., $1.80, $1.50, or key moving averages).
o OI Liquidation Cascade: As mentioned, high open interest could fuel a sharp sell-off if sentiment sours.
Conclusion: Cautious Optimism Warranted
The current situation for XRP presents a compelling, albeit complex, picture. The ability to hold the crucial $2 support level is a significant show of resilience. Combined with potentially forming bullish technical patterns and a notable surge in open interest suggesting fresh capital inflow and conviction, the ingredients for a potential price run appear to be gathering. Bulls are rightly eyeing fresh gains, encouraged by these developments.
However, caution remains paramount. The cryptocurrency market is inherently volatile, and XRP carries the unique and substantial burden of the SEC lawsuit's uncertainty. While technicals and derivatives data might point towards bullish potential in the near term, fundamental risks and the ever-present possibility of market-wide corrections cannot be ignored. A breakdown below $2 support or negative news from the legal front could quickly invalidate the bullish outlook.
Traders and investors considering XRP must weigh the potentially explosive upside against these considerable risks. Monitoring the $2 level, key resistance zones, developments in the SEC case, and overall market sentiment will be crucial in navigating XRP's next potential move. While the setup looks promising for the bulls, confirmation through decisive price action and continued positive momentum is needed before declaring that XRP is definitively "ready to run."
Disclaimer: This article is for informational purposes only and should not be considered financial advice. Trading cryptocurrencies involves significant risk, and you could lose your entire investment. Always conduct your own thorough research and consult with a qualified financial advisor before making any investment decisions.

CrowdStrike: Member of a Small ClubThe broader market has been tumbling for months, but CrowdStrike has stood its ground.
The first pattern on today’s chart is the March 10 low of $303.79. While the Nasdaq-100 has revisited levels from over a year ago, CRWD has held lows from a month prior. Support at such a recent level may reflect positive sentiment.
Second, Wilder’s Relative Strength Index (RSI) made a higher low as the cybersecurity company made a slightly lower low. That positive divergence could also be viewed as a bullish signal.
Third, the 50-day simple moving average (SMA) had a “golden cross” above the 200-day SMA in November and has stayed there since. Is a longer-term uptrend still in effect?
Speaking of SMAs, CRWD is above its 20- and 200-day SMAs. That puts it in relatively elite clubs: Only 104 members of the S&P 500 are above their 20-day SMAs and just 138 are above their 200-day SMAs, according to TradeStation data.
Those points may also suggest sellers have been less active in the name.
TradeStation has, for decades, advanced the trading industry, providing access to stocks, options and futures. If you're born to trade, we could be for you. See our Overview for more.
Past performance, whether actual or indicated by historical tests of strategies, is no guarantee of future performance or success. There is a possibility that you may sustain a loss equal to or greater than your entire investment regardless of which asset class you trade (equities, options or futures); therefore, you should not invest or risk money that you cannot afford to lose. Online trading is not suitable for all investors. View the document titled Characteristics and Risks of Standardized Options at www.TradeStation.com . Before trading any asset class, customers must read the relevant risk disclosure statements on www.TradeStation.com . System access and trade placement and execution may be delayed or fail due to market volatility and volume, quote delays, system and software errors, Internet traffic, outages and other factors.
Securities and futures trading is offered to self-directed customers by TradeStation Securities, Inc., a broker-dealer registered with the Securities and Exchange Commission and a futures commission merchant licensed with the Commodity Futures Trading Commission). TradeStation Securities is a member of the Financial Industry Regulatory Authority, the National Futures Association, and a number of exchanges.
TradeStation Securities, Inc. and TradeStation Technologies, Inc. are each wholly owned subsidiaries of TradeStation Group, Inc., both operating, and providing products and services, under the TradeStation brand and trademark. When applying for, or purchasing, accounts, subscriptions, products and services, it is important that you know which company you will be dealing with. Visit www.TradeStation.com for further important information explaining what this means.

Gold to print historic 30% correction?On the above 2 week chart Gold price action has completed the much anticipated Cup and Handle forecast to $2700, which was where Without Worries dabbled with a “short” position and was promptly stopped out much to the bugs delight.
Price action has rallied 180% since the 2016 lows, amazing. The increased Money supply / Money printing is the reason I’m often given for this historic rally. The facts are the money supply has increased 68% since the 2016 lows and not 180%, which would price an ounce at $1750 today. Now I know someone will be quick to comment my being selective with dates. To that end we can go back further, 18 years since that fits over the well understood business cycle, which is approaching its peak. Since 2007 money supply has increased 195% with Gold price action 400%. This is a bubble.
This idea is not about fundamentals however, it is technical only.
1) Price action is in bubble territory. Look left, 50% above the 5 week Gaussian channel saw corrections of at least 30%.
2) Price action on the 2 week chart prints the strongest negative divergence since the positive divergence in December 2013 at 1190 an ounce.
3) The $2000 support breakout has never confirmed support.
4) On the weekly chart a bearish engulfing candle prints as price action enters the Bollinger Band. A correction to 2730 is now highly probable.
Is it possible price action continues up? Sure.
Is it probable? No.
Ww
5 week Gaussian channel
Weekly bearish engulfing

SPY Analysis & Tariff TurmoilLast Friday, the market pressure was intense, and my bullish call option, targeting $537.64 on SPY, seemed overly ambitious as tariffs and political uncertainties peaked. I stated, " AMEX:SPY Trump went all in thinking he had the cards. We were getting sent back to the McKinley era," wondering when or if Trump would fold under international pressure and market realities.
Fast-forward to Wednesday, April 8—Trump didn't just blink; he folded utterly, reversing the harsh tariff policies he initially defended aggressively. Prompted by China's aggressively dumping of U.S. Treasuries and stark recession warnings from Goldman Sachs, BlackRock, and JPMorgan, Trump pivoted significantly:
• Base tariffs: 10%
• Tariffs on China: Increased to 125%
• Tariffs on U.S. goods entering China: Increased to 84% starting April 10
While temporarily bullish, these sudden, dramatic policy swings underline ongoing instability and volatility. However, with big bank earnings on deck this Friday, short-term momentum looks positive.
Technical Levels & Trade Ideas
Hourly Chart
The hourly chart reveals a critical zone—dubbed "Liberation Day Trapped Longs"—between $544.37 (H. Vol Sell Target 1b) and $560.54 (L. Vol ST 2b). Bulls trapped here from recent highs may now look to exit on a relief rally.
• Bullish Scenario:
• Entry: SPY reclaiming and holding above $544.37.
• Target 1: $560.54 (top of trapped longs)
• Target 2: $566.54 (next resistance area)
• Stop Loss: Below recent lows near $535 to limit downside.
• Bearish Scenario (if tariffs intensify again or earnings disappoint):
• Entry: Breakdown confirmation below $535.
• Target 1: $522.20 (Weeks Low Long)
• Target 2: $510.00, potential further support
• Stop Loss: Above $544.50 to manage risk effectively.
Daily Chart Perspective
The broader daily chart shows SPY stabilizing around key lower supports after significant volatility. Recent price action suggests cautious optimism for an upward bounce, but considerable headwinds remain if tariff escalations resume.
Final Thoughts
The rapid tariff reversals and heightened volatility are unsettling. The short-term bullish move offers potential quick upside trades into earnings, but caution remains paramount. You can continue managing risks prudently and watch closely for political or economic headlines that could quickly shift market sentiment again.

What Is The #1 Candlestick Pattern?When I decide to help the Trading community I think about which market news gets the most "organic" likes I noticed it was the Dow Jones industrial Average (US30).
Because of this i decided to help you trade them now my expertise is in buying Bitcoin,Gold & Silver.
So learning to trade stock options was going to be a challenge.
I decided to learn 3 things:
#1-So I started by learning about the "3 Step-Rocket Booster Strategy"
#2 -Then I learned about the Candlestick Patterns
#3 -Then I learned about how to use oscillators
--
What Is The Rocket Booster Strategy?
--
This is a strategy used in trend analysis it has 3 Steps
--
1)The price has to be above the 50 EMA
2)The price has to be above the 200 EMA
3)The price has to Gap up
Remember the last step is very important because that step is what you need in order to execute the best candlestick pattern
-
What Is The #1 Candlestick Pattern?
-
They are alot of candlestick patterns and you have to choose your favorite in this case I chose to use the "long lower shadow"
If you want to learn more about candlestick patterns read Steve Nissan's Book about Japanese Candlestick Patterns
-
What is The Best Oscillator ?
-
Now the most common one is called MACD.
But I prefer to use Bull Power
Because this is the oscillator I first used when I was learning about forex trading and lost when I didn't understand how to use it.
Now thanks to the new TradingView Screener I have been able to use in stock options trading.
I will try to make a video tomorrow demonstrating how to trade stock options on US 30 Dow Jones Industrial Average
As today I was so exhausted from a very long walk and day from yesterday.
Stay tuned for a video demo tomorrow
Rocket boost this content to learn more
Disclaimer ⚠️ Trading is risky please learn risk management and profit taking strategies and feel free to use a simulation trading account before you use real money.
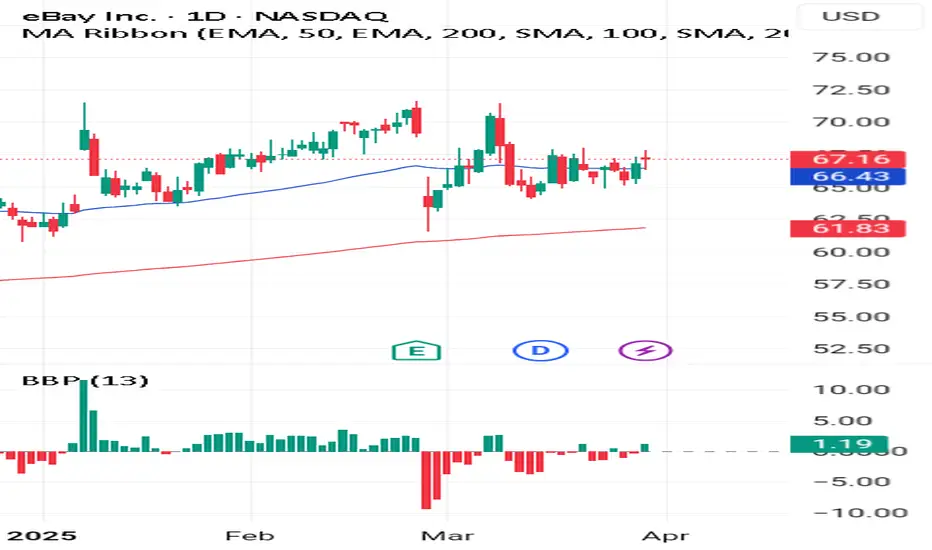
Reddit Has Pulled BackReddit hit a record high early last month. Will some traders see an opportunity in the current pullback?
The first pattern on today’s chart is the bullish gap on October 30 after earnings beat estimates. RDDT approached the low of that session on March 10 and again last week. It bounced both times. That apparent double bottom may suggest new support has been established.
Next, the rebounds occurred around the 200-day simple moving average. Holding that line may suggest an uptrend is in place.
Finally, stochastics have turned up from an oversold condition. The stock also closed above its 8-day exponential moving average. Those patterns are potentially consistent with prices bottoming.
TradeStation has, for decades, advanced the trading industry, providing access to stocks, options and futures. If you're born to trade, we could be for you. See our Overview for more.
Past performance, whether actual or indicated by historical tests of strategies, is no guarantee of future performance or success. There is a possibility that you may sustain a loss equal to or greater than your entire investment regardless of which asset class you trade (equities, options or futures); therefore, you should not invest or risk money that you cannot afford to lose. Online trading is not suitable for all investors. View the document titled Characteristics and Risks of Standardized Options at www.TradeStation.com . Before trading any asset class, customers must read the relevant risk disclosure statements on www.TradeStation.com . System access and trade placement and execution may be delayed or fail due to market volatility and volume, quote delays, system and software errors, Internet traffic, outages and other factors.
Securities and futures trading is offered to self-directed customers by TradeStation Securities, Inc., a broker-dealer registered with the Securities and Exchange Commission and a futures commission merchant licensed with the Commodity Futures Trading Commission). TradeStation Securities is a member of the Financial Industry Regulatory Authority, the National Futures Association, and a number of exchanges.
TradeStation Securities, Inc. and TradeStation Technologies, Inc. are each wholly owned subsidiaries of TradeStation Group, Inc., both operating, and providing products and services, under the TradeStation brand and trademark. When applying for, or purchasing, accounts, subscriptions, products and services, it is important that you know which company you will be dealing with. Visit www.TradeStation.com for further important information explaining what this means.
