Exxon Pulled Back. Now It’s BouncingEnergy, energy, energy: It’s been the manta of 2022, so let’s take a look at Exxon Mobil.
Earlier this month, the oil-and-gas giant hit triple digits for the first time in almost eight years. As noted at the time , prices were extended and a pulled back sharply. And now they’re bouncing.
The main pattern on this chart is the falling trendline along the highs during the slide. XOM closed above that resistance Monday and continued its rebound yesterday.
Next you have $89.49, a high in April 2019. It offered resistance again in February, but turned into support in May. Interestingly, this was almost exactly the stock’s bottom last week.
Third, prices rose after testing the 100-day simple moving average (SMA) for the first time since December. That may indicate the longer-term uptrend remains in effect.
Finally, notice how stochastics are turning up after hitting the most oversold condition since last August.
TradeStation has, for decades, advanced the trading industry, providing access to stocks, options, futures and cryptocurrencies. See our Overview for more.
Important Information
TradeStation Securities, Inc., TradeStation Crypto, Inc., and TradeStation Technologies, Inc. are each wholly owned subsidiaries of TradeStation Group, Inc., all operating, and providing products and services, under the TradeStation brand and trademark. You Can Trade, Inc. is also a wholly owned subsidiary of TradeStation Group, Inc., operating under its own brand and trademarks. TradeStation Crypto, Inc. offers to self-directed investors and traders cryptocurrency brokerage services. It is neither licensed with the SEC or the CFTC nor is it a Member of NFA. When applying for, or purchasing, accounts, subscriptions, products, and services, it is important that you know which company you will be dealing with. Please click here for further important information explaining what this means.
This content is for informational and educational purposes only. This is not a recommendation regarding any investment or investment strategy. Any opinions expressed herein are those of the author and do not represent the views or opinions of TradeStation or any of its affiliates.
Investing involves risks. Past performance, whether actual or indicated by historical tests of strategies, is no guarantee of future performance or success. There is a possibility that you may sustain a loss equal to or greater than your entire investment regardless of which asset class you trade (equities, options, futures, or digital assets); therefore, you should not invest or risk money that you cannot afford to lose. Before trading any asset class, first read the relevant risk disclosure statements on the Important Documents page, found here: www.tradestation.com .
Centered Oscillators

CLS: ShortSlow stochastic bearish divergence
Stop loss: R298.29
Take profit: R285.03
Risk/Reward: 3.7
*No.1 Manage your Risk*

LTCUSD: ShortWill price respect the trend line?
Stop loss: 56.39
Take profit: 43.67
R/R: 3
*No.1 Manage your RISK*

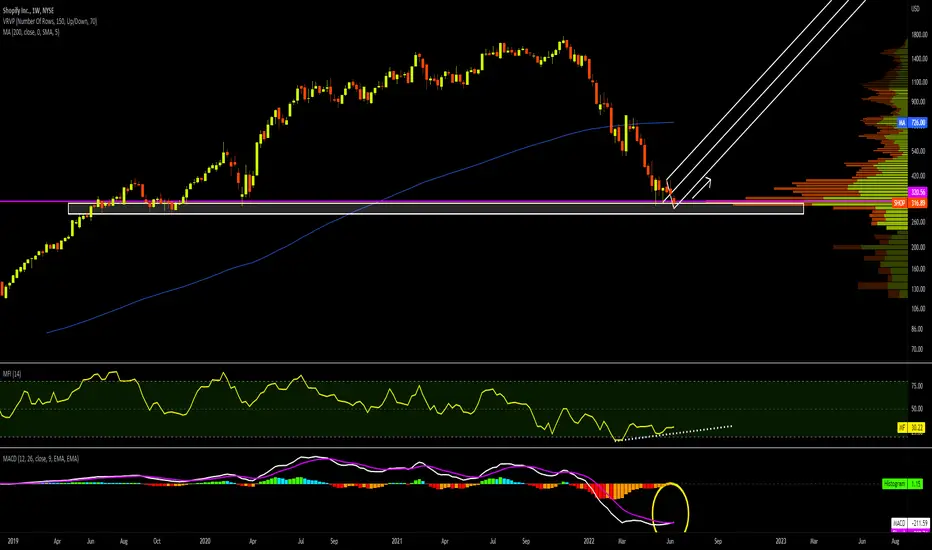
Long ShopifyNYSE:SHOP
Shopify dumped to a major support level.
Weekly MACD crossing up, Weekly MFI showing bullish divergence.
10/1 stock split coming on June 29th.
See AMZN prior to June 6th split. (27% rally)
I'm anticipating SHOP rallies here. (Perhaps to low $400s or $470)
I'm going long tomorrow on the market open.
I hope to hold the position until price exits the fork.
I'll be watching for this on daily and lower timeframes.
Is Nvidia Rolling Over?Nvidia had a sharp countertrend rally two weeks ago, but now the chip giant may be rolling over.
Prices jumped over $183 on May 27. They remained above that level and started making lower highs on June 2. That kind of descending triangle is a potential bearish continuation pattern, which was broken to the downside yesterday.
Second, this month’s high was slightly lower than May’s. That’s consistent with a downtrend.
Next, stochastics reached an overbought condition on the last bounce. That could also make traders think its near-term trajectory is lower.
NVDA additionally slipped back under its 21-day exponential moving average (EMA), which may indicate its short-term trend is turning bearish again.
TradeStation has, for decades, advanced the trading industry, providing access to stocks, options, futures and cryptocurrencies. See our Overview for more.
Important Information
TradeStation Securities, Inc., TradeStation Crypto, Inc., and TradeStation Technologies, Inc. are each wholly owned subsidiaries of TradeStation Group, Inc., all operating, and providing products and services, under the TradeStation brand and trademark. You Can Trade, Inc. is also a wholly owned subsidiary of TradeStation Group, Inc., operating under its own brand and trademarks. TradeStation Crypto, Inc. offers to self-directed investors and traders cryptocurrency brokerage services. It is neither licensed with the SEC or the CFTC nor is it a Member of NFA. When applying for, or purchasing, accounts, subscriptions, products, and services, it is important that you know which company you will be dealing with. Please click here for further important information explaining what this means.
This content is for informational and educational purposes only. This is not a recommendation regarding any investment or investment strategy. Any opinions expressed herein are those of the author and do not represent the views or opinions of TradeStation or any of its affiliates.
Investing involves risks. Past performance, whether actual or indicated by historical tests of strategies, is no guarantee of future performance or success. There is a possibility that you may sustain a loss equal to or greater than your entire investment regardless of which asset class you trade (equities, options, futures, or digital assets); therefore, you should not invest or risk money that you cannot afford to lose. Before trading any asset class, first read the relevant risk disclosure statements on the Important Documents page, found here: www.tradestation.com .

CCI AND %R INDICATE A POTENTIAL SELL+ POSSIBLE CUP AND HANDLE This is my prediction for GBP/JPY on Daily time frame.
The next candle can see the CCI and %R indicators going back to the range after being overbought wich indicates a sell opportunity. If it opens, makes a wick up and breaks the low of this candle don't hesitate to take it. The target being a previous support/resistance level.
On the other hand, the previous chart shows a "cup" formed and combining it with the previous sell we might see a cup and handle pattern forming. The target being a support/resistance level from July 10th 2014 and Jan 29th 2016.
It might take a couple days to have a clear picture so stay updated!
Feel free to comment your thoughts and ask your questions in the comments, I will be really happy to help!

CPS likely to continue downtrendBased on historical movement, the peak could occur anywhere in the larger red box. The final targets are in the green boxes. The pending bottom should occur within the larger green box as has been the historical case. Half of all movement has ended in the smaller green box. In this instance, the signal indicated SELL on June 3, 2022 with a closing price of 5.72.
If this instance is successful, that means the stock should decline to at least 5.675 which is the top of the larger green box. Three-quarters of all successful signals have the stock decline 2.502% from the signal closing price. This percentage is the top of the smaller green box. Half of all successful signals have the stock decline 4.91% which is the end point of the black dotted arrow. One-quarter of all successful signals have the stock decline 9.026% from the signal closing price which is the bottom of the smaller green box. The maximum decline on record would see a move to the bottom of the larger green box. These are the same concepts for the levels in the red boxes as well.
The ends/vertical sides of the boxes are determined in a similar fashion. The trough of the decline can occur as soon as the next trading bar after signal close, while the max decline occurs within the limit of study at 40 trading bars after the signal. A 0.75% decline must occur over the next 40 trading bars in order to be considered a success. Three-quarters of successful movement occur after at least 9.5 trading bars; half occur within 20.0 trading bars, and one-quarter require at least 34.0 trading bars.
The black dotted arrow represents median historical movement. Medians are a good metric, but they are just one of many I use when forecasting future movement.
As always, the stock could decline the very next bar after the signal without looking back (therefore the red boxes would not come into play) or the stock may never decline (and the green boxes may never come into play).

OLED looks overbought again, time for snapback?Based on historical movement, the peak could occur anywhere in the larger red box. The final targets are in the green boxes. The pending bottom should occur within the larger green box as has been the historical case. Half of all movement has ended in the smaller green box. In this instance, the signal indicated SELL on June 3, 2022 with a closing price of 124.42.
If this instance is successful, that means the stock should decline to at least 123.68 which is the top of the larger green box. Three-quarters of all successful signals have the stock decline 2.843% from the signal closing price. This percentage is the top of the smaller green box. Half of all successful signals have the stock decline 6.8475% which is the end point of the black dotted arrow. One-quarter of all successful signals have the stock decline 12.939499999999999% from the signal closing price which is the bottom of the smaller green box. The maximum decline on record would see a move to the bottom of the larger green box. These are the same concepts for the levels in the red boxes as well.
The ends/vertical sides of the boxes are determined in a similar fashion. The trough of the decline can occur as soon as the next trading bar after signal close, while the max decline occurs within the limit of study at 40 trading bars after the signal. A 0.5% decline must occur over the next 40 trading bars in order to be considered a success. Three-quarters of successful movement occur after at least 5.0 trading bars; half occur within 16.0 trading bars, and one-quarter require at least 31.5 trading bars.
The black dotted arrow represents median historical movement. Medians are a good metric, but they are just one of many I use when forecasting future movement.
As always, the stock could decline the very next bar after the signal without looking back (therefore the red boxes would not come into play) or the stock may never decline (and the green boxes may never come into play).

GBPNZD: Classic Moving Average Trade
GBPNZD looks very bearish.
The market is currently approaching the MA.
From the intersecion point, we shorted.
Entry - 1.93
Stop loss - 1.94465
Target - 1.9083
Please, like and comment this post!

STX/BTC currently trading in the golden pocket rangeSTX/BTC is STX/BTC is currently trading in the golden pocket range on the weekly chart.
The divergence script for many indicators indicates two clear bullish divergences.
Chris Moody's script 'CM Williams VIX' which finds market bottoms, flashes obvious green.
LazyBear's Squeeze Momentum Indicator indicates a momentum change due to the first colour change from red to dark red.
The sell volume has been decreasing for months.
RSI is below 40.
MACD is a lagging indicator but when you switch to a 2/3day timeframe there is already crossover. My expectation is that this will soon follow on the weekly chart.

Will Laredo Petroleum correct its rally soon?Based on historical movement, the peak could occur anywhere in the larger red box. The final targets are in the green boxes. The pending bottom should occur within the larger green box as has been the historical case. Half of all movement has ended in the smaller green box. In this instance, the signal indicated SELL on May 27, 2022 with a closing price of 83.65.
If this instance is successful, that means the stock should decline to at least 83.11 which is the top of the larger green box. Three-quarters of all successful signals have the stock decline 5.226% from the signal closing price. This percentage is the top of the smaller green box. Half of all successful signals have the stock decline 8.355% which is the end point of the black dotted arrow. One-quarter of all successful signals have the stock decline 15.97% from the signal closing price which is the bottom of the smaller green box. The maximum decline on record would see a move to the bottom of the larger green box. These are the same concepts for the levels in the red boxes as well.
The ends/vertical sides of the boxes are determined in a similar fashion. The trough of the decline can occur as soon as the next trading bar after signal close, while the max decline occurs within the limit of study at 40 trading bars after the signal. A 0.5% decline must occur over the next 40 trading bars in order to be considered a success. Three-quarters of successful movement occur after at least 7 trading bars; half occur within 18 trading bars, and one-quarter require at least 34 trading bars.
The black dotted arrow represents median historical movement. Medians are a good metric, but they are just one of many I use when forecasting future movement.
As always, the stock could decline the very next bar after the signal without looking back (therefore the red boxes would not come into play) or the stock may never decline (and the green boxes may never come into play).

Cleveland-Cliffs has overbought signal on my RSIBased on historical movement, the peak could occur anywhere in the larger red box. The final targets are in the green boxes. The pending bottom should occur within the larger green box as has been the historical case. Half of all movement has ended in the smaller green box. In this instance, the signal indicated SELL on May 27, 2022 with a closing price of 24.56.
If this instance is successful, that means the stock should decline to at least 24.42 which is the top of the larger green box. Three-quarters of all successful signals have the stock decline 2.961% from the signal closing price. This percentage is the top of the smaller green box. Half of all successful signals have the stock decline 6.296% which is the end point of the black dotted arrow. One-quarter of all successful signals have the stock decline 9.712% from the signal closing price which is the bottom of the smaller green box. The maximum decline on record would see a move to the bottom of the larger green box. These are the same concepts for the levels in the red boxes as well.
The ends/vertical sides of the boxes are determined in a similar fashion. The trough of the decline can occur as soon as the next trading bar after signal close, while the max decline occurs within the limit of study at 50 trading bars after the signal. A 0.4% decline must occur over the next 50 trading bars in order to be considered a success. Three-quarters of successful movement occur after at least 8 trading bars; half occur within 28 trading bars, and one-quarter require at least 46 trading bars.
The black dotted arrow represents median historical movement. Medians are a good metric, but they are just one of many I use when forecasting future movement.
As always, the stock could decline the very next bar after the signal without looking back (therefore the red boxes would not come into play) or the stock may never decline (and the green boxes may never come into play).

XAUUSD - Long by RSI & High/Low Pivot 5/24/2022Long:
- Higher Low & RSI: > 40.
- Higher High & RSI: > 70.
Demo short targets:

using MACD histrogram as a volatility toolMany traders use the MACD for divergence or crossover signals. It is my opinion that market participants trade almost every oscillator this way. This I find rather simplistic and not respecting what the data shows you. In this tutorial I will show a new approach to reading the MACD, obviously I'm probably not the only person who looks at MACD this way however.
MACD colors:
blue = MACD
orange = Signal line
green and red waves = histogram
The MACD is based on the distance between 2 exponential moving averages. The signal line is a smoothed version of the centered oscillator that difference creates. And the histogram is the difference between the MACD and signal line, this is extremely simple.
On the chart I have plotted these 2 EMA's for clarifying my approach to the MACD. Notice that when price rapidly changes these 2 lines move away from eachother, we see the MACD line also move away from the signal line in the process creating a big histogram wave. After the trend becomes less volatile and more one directional the EMA's stay at the same distance from eachother. This creates a flat histogram.
The trading approach I'm showing here is that instead of trading tops and bottoms from the histogram/crossovers you use the MACD as a directional tool and you use the histogram as a volatility tool. We wait for a crear trend to get established after a big histogram wave and then for the trend to stabilise: MACD histogram flattening. Now we have a one directional trend and it is a good place to start opening positions in the trend direction as it is stable.
Notice how we got a nice discount after the trend stabilised and became on directional. I provide below some snapshots of how the market looked when trades would have been opened:
long setup:
short setup:
result:
Use this information with caution as these examples are obviously cherry picked. I hope this gives some perspective on using the MACD in your trading arsenal.

BTCUSD short term bounce from supply zoneThere are many wicks on top of the candles on the 15 minute BTCUSDT chart. Honey Cypher momentum is to the downside. The light blue Vwap is starting to slope down. Looking at the honey wave structure we can see that the previous uptrend was long lasting so the chance of the coming downtrend to have this long lasting slow drop is quite likely to me.

A BREAKOUT CASE STUDYHow to trade breakout structure by using the MACD indicator. the top green/blue and low red MACD indicates the lower and higher price on the chart, use your tools to mark them and wait for the breakout, then follow the steps on the chart. I hope it is not that hard setup.

BTCUSD Uptrend, Target R1,R2
Hi traders, BTCUSD is showing the last correction wave C 1-day frame, which is almost over. The market is bearish , but we will see the market going higher bouncing between pivot point bands going up. Pls remember to check the trend, the price should stay up at the pivot point level and bounce in it, without breaking. If the price goes down the pivot point and then S1, we will be in a downtrend again. Pls , see the pivot point levels in the chart.(R1,R2) The market has the last word.
Indicators, MA 200, 20-8 RSI 8 MA8 Bollinger 20, Volume , Pivot points Levels. Intraday Strategy. MACD

3 indicators that work for day trading newbies these 2 indicators are the best and easiest to use for beginners.
-RSI 25 & 100
-MACD
-Chandalier exit -

BTCUSDT short updatedTriangle breakout on this H1 chart volume decreasing with Chaikin Money Flow falling below zero. 38.2% Fibonacci Retracement key level to watch for retest. Big show of weakness. Big selling pressure. 14.6% Fibo target maintained in confluence on this triangle pattern. 2nd target below on AB=CD pattern in confluence with local support as we can see in my last update today.

BTCUSDT monthly superbearishMonthly superbearish with Chaikin Oscillator diving below zero / center line. Ehler's Fisher Center of Gravity (CC) & Fisher Transfom aiming july in a bearish momentum. Price action to sell.

Bullish Idea on the EUR/CHF making a new higher high since 3/21.EUR/CHF has made a new higher high since 3/21/22 and breaking out the resistance zone above the 200 EMA and MACD confirmation.
Possible bullish idea.

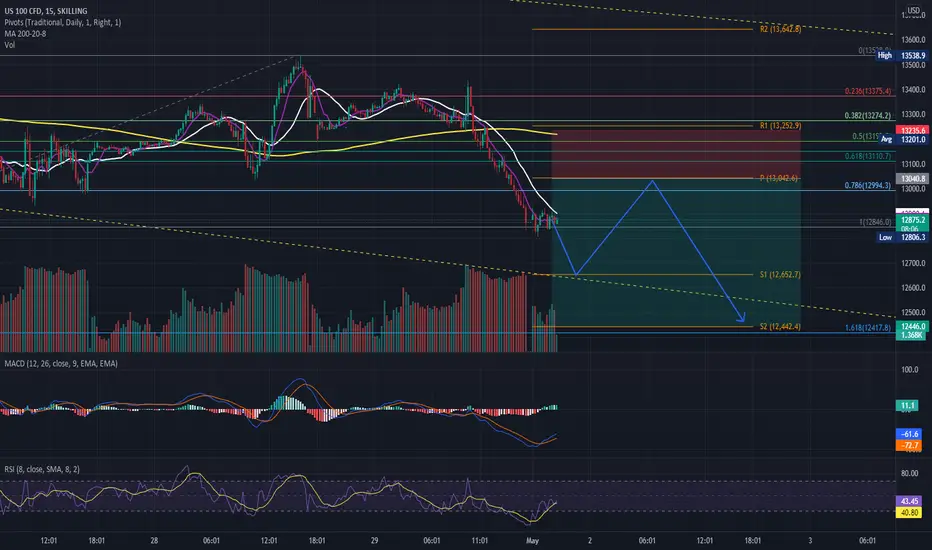
NASDAQ, Downtrend Target S1, S2, Intraday Strategy PPHi Traders. The market is still downtrend, let's check the trend with the pivot point levels, the price should bounce on S1, and then it will try to reach the PP, bouncing on it, and then it might hit on S1 again and break it going down to reach S2. If the price doesn't break at S1 down up, it might go again to PP and break it going up, so the market might show a tinny uptrend, possibly reaching R1. But it doesn't mean the market is in an uptrend. To get the beginning of an uptrend the prices should hit at least the last higher high, 13,554.00
Indicator MA 200, 20-8 RSI 8 MA8 Bolliger 20, Volume, Pivot points Levels. Intraday Strategy. MACD
R3 14,242.97
R2 13,642.77
R1 13,252.93
PP 13,042.57
S1 12,652.73
S2 12,442.37
S3 11,842.17
Bitcoin is likely to experience an uptrendhi guys
If Bitcoin loses its current support, it will enter the range of 37,500 to 3,500, which contains a harmonic bullish pattern, but I think Bitcoin will experience a bullish move and rise to a price of 45,000, but at 45,000 Bitcoin 2 It has static resistance and 2 dynamic resistances And I also found a RD+ divergence that could be a sign of an uptrend for Bitcoin
