BNBUSD sitting on the EMAWe are sitting on the 200 EMA, strong support. I think the entry is now pretty attractiv.
Correction wave seems to be completed and the sideways trend is accumulating for the trend up I guess.
The MACD shows us still a big oversold over the bigger time frame.
Long term target $480
Centered Oscillators

BTC MUST FALLIn the short term I identify a small upward movement towards 36K, however the most prudent thing to do at this time is to trade short because the general trend is downward.

COTIUSDT Scalp tradeHello traders!
This is a Cotiusdt Buy trade. Take profit is at 5% gain and stop loss is -3%.
Collect some profit when trade is in 3% profit.
Never trade above 7x leverage
Don't forget to hit the like button and follow to stay connected.


Bitcoin Bear Market Confirmed on the MonthlyPreamble
There is quite a debate as to what constitutes a bear market generally and what constitutes a bear market in crypto specifically. Having pondered this question at length for myself and experiencing the pain of indecision this is what I have developed. This determination is very important because in bull markets bullish formations overperform and even bearish formations can break upward. In bear markets bullish formations fail to trigger and bearish formations over-perform. In the linked ideas you will see that I rang a warning bell when the three day condition was met at 50k and I called the bear market at 43k and look at us now, struggling to stay above 33.5k. I have been at sundry times mocked for my call, in person and online. Meh. We see the system is now printing a bearish close on the monthly timeframe and that is going to be extraordinarily difficult to overcome.
The System
The key components to this system are the VSTOP and the MTF VSTOP, which are based off the Average True range, a most valuable indicator for its use at finding lows in markets, and its use in measuring volatility for stops and the Keltner Channel. When both are flipped bearish or bullish the uptrend is extraordinarily resilient and despite viscous retracements there can be a lot more continuation potential. As they have both flipped bearish I continue to foresee a lot of bearish continuation. The monthly 20 SMA will very likely (above 90%) fall as support. Price may chop around there on the weekly chart for weeks but ultimately downside targets are going to be reached. The monthly MACD cross is almost upon us and in short order I foresee that happening as well. On lower time frames I can add the Ichimoku cloud or On Balance Volume with EMAs, but due to the high time frame those are unworkable now.
Targets
I continue to think that BTC will see some wicking below the monthly Keltner channel. We may even close a candle body below it before chopping sideways and then up. Please review the linked idea for more details on that.
Final Thoughts
If you are still bullish please let me know, technically, why. MY system lets me change my biases and my behavior as soon as the 3 day or weekly conditions are met. This monthly post is to help people understand the scope of that we are dealing with, and the forces that are at play. It is not possible for me to chart the 20 month wrong, or the VSTOP wrong. There is no squinting and seeing a falling wedge that isn't there or misreading divergences. The bias is bearish.

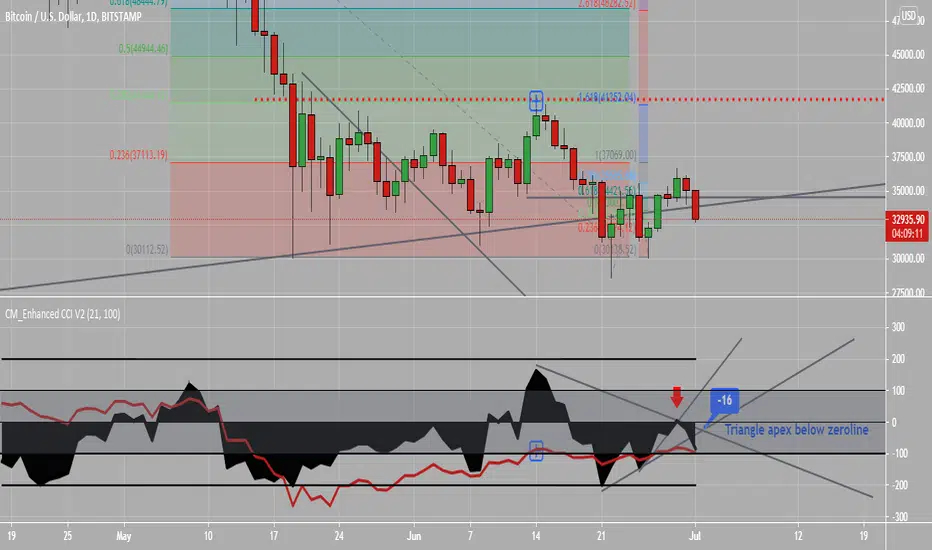
BTCUSD Daily 13CCI tbl and triangle apex still Short until..In a big picture, standing aside until price breaks above $41.5k or below $28.5k can save a lot of whipsaw unless one is nimble, has low fees on trades, has limit and stop orders available, and is a good chart reader.
For those wanting to use 13CCI signals to trade in/out during this extended consolidation, daily CCI is currently on a short signal. It would change to a long signal when 13 CCI crosses up thru the last shown down-trendline. We would also expect to see that the apex of triangle drawn on CCI would have its apex at or above zeroline
$HAI with fib and oscilators buy setupThis prediction lies upon MACD convergence point coming, based on a wave pattern of MACD. EWO also supports this, reaching it's peak in a downward trend, with fib you could expect a solid 30% growth in price in a medium-long time period. This downtrend for HAI is expected to change now. To use it with risks included I've made this buy setup:
buy price: 0.1000-0.1010
tp: 0.1315
sl: 0.900

BTC Eve and Adam suggest one is forming on ETHBTCI got a scratching in my head again when looking at the ETHBTC chart and it was beginning to resemble the bitcoin chart and a bit more tinkering has resulted in this post. I see myself doing a couple of editions of this basic concept over the next couple of days. The fib levels show that BTCUSD had a more powerful move as BTC was able to reach the 0.786 Fib retracement level and ETHBTC did a good showing of breaking 0.618 before getting rejected. It is a bit to early to guess now, but that could mean that ETHBTC may not reach the full 1.618 fib extension on its upleg if the Eve and Edam pattern develops and we may have to settle of a mere 1.414 extension. Likewise, the very bullish Eve and Adam had a higher low on the Adam. No guarantee that the Adam low will be lower or higher than the eve on ETHBTC at this point.
Quick reminder on Divergences
Normal Divergence (Trend Reversal)
Bearish: Higher highs on price action but lower highs on the indicator
Bullish: Lower lows on price action but higher lows on the indicator
Hidden Divergence (Trend Continuation)
Bearish: Lower high on the price action and higher highs on the indicator
Bullish: Higher low on the price action and a lower low on the indicator
The BTCUSD high on the main chart looks a bit deceptive on the log scale, in part because that 90% move doesn't look that impressive. Below it makes things a bit clearer were I focus more on the Eves and not a wider picture. BTCUSD has a technical double top from the weekly candle bodies from the beginning of 2018 to the middle of 2019 and the divergence tore the uptrend to pieces. I also was torn to pieces looking for a short entry too soon and not just being patient and buying the dip. By the time the dip fell to my level I was so pissed off at myself I didn't buy crypto, I had been too burned out on it. ETHBTC is off to the left and the hidden bearish divergence is much clearer. There can be some considerable chop over the next six to nine months as everything comes to order.
I called the top on BTC when everyone else was looking for upside continuation and I still remain steadfast on my downside targets on BTCUSD reaching around 14-16k until such time as the 20 week SMA is no longer acting as resistance. So I am operating under the assumption that ETH will fall faster than BTC and perhaps BTC will recover quicker as well and then ETH will have a huge run, appreciating 10x against BTC from its current position. I also called the local top in 2019, but as I mentioned, shorted to soon, repeatedly, and it burned me. I developed my stop and short strategies a bit since then so I may give it another college try in the future.
My linked idea from August 2019 is one of my most frustrating ones because, despite the chop it reached my long term target and I tore my account to pieces. I suspect with patience ETHBTC will reach the box below around 0.019 to 0.023. My recent idea on BTC has some target setting for BTC any my target setting for eth is along the same lines (Below the monthly Keltner channel).

My strategy and indicator has a win rate of 100%: the proofIm hoping by this video to give a conclusive evidence of the performance of my indicator.
Again: this is not for marketing reasons, im NOT selling my indicator for any price.

Amazon Harmonic - Daily & Hourly Bearish BatThere isn't much more to say other than that if the 0.886 retracement holds on both the hourly and daily timeframes into Tuesday's morning session, this Bearish Bat harmonic could end up confirming an enormous reversal that has been nearly a year in the making.
I remember reading that some dude had a 2M put position going into Amazon's 2020 Q2 earnings report... despite the fact that this was the first blow-out earnings beat (10 times street expectations top and bottom!) the put position wouldn't have bankrupted him in a day. I know this because I speculated with reasonable calls into that ER, thought I had won the lottery, only to watch this thing selloff like hotcakes on the open.
Point is that Amazon runs like hell both randomly and seldomly. Thus, the odds of it making all-time highs is actually much slimmer than one would believe - especially if they were to also look at the volatility that is implied by last week's options. Sometimes black-box financial engineering methods employed by machines lack the human intuition to know when a financial asset is ready to turn. The implied volatility assumed into Amazon's near-term contracrs is one such example that can be exploited for an easy volatility flip on the first break of harmonic support.
That, or you could try for the almighty dime-bagger that this harmonic structure implies in the mid-term, the likes of which would produce some of the most expensive same-week options that have ever been printed.
-AmazonianSwine
NASDAQ:AMZN
AMEX:ARKK
NASDAQ:AAPL
CURRENCYCOM:US100
TVC:IXIC
TVC:NDX
TVC:SPX
CURRENCYCOM:US500

$GTT Target 4.42 for 49.83%$GTT Target 4.42 for 49.83%
Or double position at 1.54
Here's another one you might want to stay away from unless you just love adrenaline 😏🤓
—
On the far right of the chart is my Average (Grey) Current Target (Green), and Next Level to add (Red) Percentage to target is from my average.
I start every position with 1% of my account and build from there as needed and as possible.
I am not your financial advisor. Watch my setups first before you jump in… My trade set ups work very well and they are for my personal reference and if you decide to trade them you do so at your own risk. I will gladly answer questions to the best of my knowledge but ultimately the risk is on you. I will update targets as needed.
GL and happy trading.
I finally added my YouTube Training Video to my profile tagline since I’m not allowed to on here. It’s a quick 15 minute training video on how to set up your chart and how to spot opportunities. So check here first but If you have questions just message me.

Accumulation Schematic #1 : WyckOff Events and PhasesI'm pretty sure that "Spring" played out, aswell the bottom of bitcoin at 28k, that was long waited from big played H&S from Daily Time Frame, hit all take profit targets and ready for next run !

$GBR Target 14.16 for 71.84% $GBR Target 14.16 for 71.84%
After-hour push to the finish line?? Maybe... I guess we shall see. ☀️

Dow Jone short term update. Dead 😿 bounceWas severely oversold on Bollinger Bands. Bounce was expected. Could take a trip back up to downtrend line(Greenline) then tank back down with first target at 33972. Powell speaks tomorrow 6/22 a 2 o'clock. I expect the drop to continue after that.

What's The Outlook For Bitcoin? - June 20th, 2021Bitcoin is holding just above the Yearly Open Price. I would expect some massive selling if we get under these levels, as large positions have been publicly taken by large companies, institutions, and hedge funds around this price area. However, that could also mean that these large position holders may be looking to accumulate more at a lower price point. Either way, I expect this to be a volatile couple of weeks-months. We can expect to see COINBASE:BTCUSD fluctuating in price quite a bit. Ultimately, the Yearly Open is a powerful level for Investors and Traders, and I will be watching this level closely.
Regards,
@DayTradingOil

geometrical metodology used on CTII've decided to experiment with geometrical shapes on CTI token as it's chart has some interesting harmonics. Basic technical analysis shows us a point where trend changes, but it's curiosity that asks us to predict how exactly this will influence price change. It's experimental method, but there is a tendency for corellating with RSI data and Trend Ribbon. This could be used in a number of ways, including pattern harmonics and long-term planning. We will see in a couple of weeks if it's working. Here and now it's pretty obvious that that's a buy price for CTi in a long-term perspective.

AJ Trady 5 min ema and macd strategy.A new strategy that I have developed. Only enter when EMA crosses one of the longer term EMA's + a bullish cross is forming on the MACD. Ideally, you should wait for ema 8 to cross both ema 21 and 34 with a bullish cross formed/forming on MACD. Use alongside normal Support and Resistance for SL and TP levels. If used on crypto I mainly suggest just BTC as alt setups easily ruined by BTC doing what it wants.

NEAR/USDT (15/6/2021)NEAR/USDT:
What makes NEAR stand out and attract?
NEAR is a native utility token used for:
• Transaction processing and data storage fees.
• Run validator nodes on the network by staking NEAR tokens.
• Used for the admin ticket to determine how to allocate network resources.
NEAR's tools include:
• The NEAR SDK includes standard data structures and testing tools for Rust and AssemblyScript.
• Gitpod for NEAR helps create an integrated experience in no time for developers.
• NEAR Wallet allows application developers to create a streamlined user experience.
• NEAR Explorer is intended to assist in debugging contracts and understanding network performance.
• NEAR Command Line Tools are intended to allow developers to deploy applications from the local environment.
Price forecast in the near future:
- Currently Near is still moving sideways in the price range $2.8-$3.6
- In the next 2-3 days, if NEAR continuously closes the daily candle above the MA(10), it will create a new support area line. There is more motivation to go up back to the old price zone. Provided that the cash flow starts to flow more into the market and spreads to the midcaps
- With the potential and potential of the Near ecosystem, it will reach the price range of $ 15-20 between this time and the end of September.
- RSI and MACD are both trending up again at the same price $4

BTC (14/06/2021)BTC trend in short term:
BTC is moving sideways in the area of $35k-$37k, the range is gradually narrowing to the innermost ring of the bolinger Band.
Still moving steadily in the linear regression line
The 14th candle is currently above the MA(10) line, creating a new support line for the price of BTC , however, the buying and selling force is still very weak and tends to decrease. If Volume continues to decline for the 15th day and the price stays above the overhead support at $37k, this could be a new support line.
Considering the trend of the RSI line, the price is very likely BTC will returnin the short term, come to the uptrend and combined with the signal of the MACD indicator, the value of BTC has recovered from June 8th.
However, there is still a high possibility that there will be a correction to the $30-$33k price range and then it will really come back. That's in a positive market situation.
At a time when MarketCap fell deeply and there was no sign of money coming back to the market, the entry of money for Altcoins was extremely limited and very dangerous.
Recommendation: Continue to monitor the market and wait for positive signs and clear signals from BTC
Signal: #MA(10), #MA(20), #RSI, #MACD, #BB

How to use RSI and MACD In trading?Hi every one
*Definition of RSI:
This indicator Is momentum base indicator.
The biggest difference with momentum is that there are two line which indicate that: Is the price in the oversold or overbought area or not?
We can easily compare the tops and bottoms of every instrument that we like!
There is not much difference between RSI and Stochastic oscillator only that there is one line in RSI!
Remember every Indicators shows the future of the market!
**Full explanation of MACD:
Moving average convergence divergence (MACD) is a trend-following momentum indicator that shows the relationship between two moving averages of a security’s price. The MACD is calculated by subtracting the 26-period exponential moving average (EMA) from the 12-period EMA.
The result of that calculation is the MACD line. A nine-day EMA of the MACD called the "signal line," is then plotted on top of the MACD line, which can function as a trigger for buy and sell signals. you may buy the security when the MACD crosses above its signal line and sell—or short—the security when the MACD crosses below the signal line. Moving average convergence divergence (MACD) indicators can be interpreted in several ways, but the more common methods are crossovers, divergences, and rapid rises/falls.
Moving average convergence divergence (MACD) is calculated by subtracting the 26-period exponential moving average (EMA) from the 12-period EMA.
MACD triggers technical signals when it crosses above (to buy) or below (to sell) its signal line.
The speed of crossovers is also taken as a signal of a market is overbought or oversold.
MACD helps investors understand whether the bullish or bearish movement in the price is strengthening or weakening.
The MACD has a positive value (shown as the blue line) whenever the 12-period EMA (indicated by the red line) is above the 26-period EMA (the blue line) and a negative value when the 12-period EMA is below the 26-period EMA. The more distant the MACD is above or below its baseline indicates that the distance between the two EMAs is growing.
The MACD has a positive value (shown as the blue line) whenever the 12-period EMA (indicated by the red line) is above the 26-period EMA (the blue line ) and a negative value when the 12-period EMA is below the 26-period EMA. The more distant the MACD is above or below its baseline indicates that the distance between the two EMAs is growing.
MACD is often displayed with a histogram which graphs the distance between the MACD and its signal line. If the MACD is above the signal line, the histogram will be above the MACD’s baseline. If the MACD is below its signal line, the histogram will be below the MACD’s baseline. Traders use the MACD’s histogram to identify when bullish or bearish momentum is high.
***RSI VS MACD:
The relative strength indicator (RSI) aims to signal whether a market is considered to be overbought or oversold in relation to recent price levels. The RSI is an oscillator that calculates average price gains and losses over a given period of time. The default time period is 14 periods with values bounded from 0 to 100. MACD measures the relationship between two EMAs, while the RSI measures price change in relation to recent price highs and lows. These two indicators are often used together to provide analysts a more complete technical picture of a market. These indicators both measure momentum in a market, but, because they measure different factors, they sometimes give contrary indications. For example, the RSI may show a reading above 70 for a sustained period of time, indicating a market is overextended to the buy side in relation to recent prices, while the MACD indicates the market is still increasing in buying momentum. Either indicator may signal an upcoming trend change by showing divergence from price (price continues higher while the indicator turns lower, or the other way around.
The DEFINITION of Divergences!
We hope that you've learn something with this post .
Have a nice day and Good luck.

My possible next trade for Bitcoin!!!Bitcoin form a simetric triangle in H8 timeframe, but at the moment, we can't to buy Bitcoin, I hope to buy Bitcoin contract above of $37,700 USD.
s3.tradingview.com
Now, if you look the Daily timeframe, there's 2 indicator that show that Bitcoin it's preparing to continue to bullish movement soon. MACD show us good zone to buy, but not confirmed in the price action, for that, I decide to hope until Bitcoin break up the resistance at $37,700 USD. Meanwhile, in the RSI Bitcoin form a bullish diverngece making lower higher in the indicator and the price action maybe a lower low. That could be an indication that bulls are preparing to make a movement volatile soon!!!
At the moment, my idea it's neutral, but the chances could be bullish!!!

Possible sell after 50 pip winWe smashed the TP within hours. Great momentum here. Right now we are seeing this pair catch it’s breath as it retraces back to support to see if it turns into resistance or not. I see this being a bearish move but because of how strong the move was we could see a strong pullback as well.
We need to be careful and wait for a proper retest. For now we wait to see what happens when market opens

How to detect the active cycle length?This is a short tutorial on how to use the Detrended Rhythm Oscillator (DRO) to identify the current dominant cycle. The Detrended Rhythm Oscillator is an advanced Detrended Price Oscillator DPO which helps to spot the key market rhythm or beat for any symbol on any timeframe.
It automatically labels the length of current market high-high and low-low pivots which helps to see cycle harmonics and relations. The output should be used as input setting for almost all technical indicators which require and "length" settings for the calculation. Using this length setting based on the dominant market rhythm will help to ensure better accuracy to your indicators at turning points. The indicators get synced to the beat of the market.
The indicator is available as Public Open Source Script for your own usage:
