ETH uptrend?Seems like ETHUSDT just broke upwards of a bull flag, waiting for confirmation on the MACD crossover for entry.
Centered Oscillators

The possible trend of the BTC/USD in weekly time frame😮🔥🔥"DON'T MISS THIS ANALYSIS"
BTC after a huge bullish trend now it is in a sensitive situation.
We have too many good news about BTC but this currency like other markets can have down trends
" in weekly time frame in MACD we can see RD- divergences , so they show us we will have a down trend in the future
other indicators like RSI are in over sold and in the chart we have a pitchfork that we are in top of it in the resistance level
in my opinion we can have that trend that I shown in the chart.
BE CAREFUL ABOUT THE NEWS
VERY GOOD NEWS COMES AFTER A SHARP TRENDS WHILE WE ARE CLOSE TO RESISTANCE "
Tell me your ideas GOD WILLING , GOOD LUCK ... 😊👍

NEOUSDT - Showing multiple divergence, time to take a trade :)Hi Traders!
On 1h chart of NEOUSDT, I found both MACD and RSI formed divergence, and an uptrend is about to reverse.
So it's time to take a short position to book some profit.
Entry SHORT - 45 USDT
TP - 42.75
SL - 46.62
Risk/Reward Ratio - 1.77 :)

EURNZD - 29 March - 2 April 21 Week Trade PlanEURNZD
Previous Month : Bearish
Previous Week : Bullish
Daily : Bearish
- EURNZD managed finally to break the range 1.6660/1.6520 to the upside with a solid 300 pip bullish candle which was due to NZD housing prices and Risk Off sentiment in market (NZD is a risk driven currency) reaching a solid resistance zone 1.7020/1.6980.
- Currently resistance zone is a historical Sup/Res that did hold for several times. Lately acted as a solid resistance during Jan in a ranging area from 1.7020 1.6820.
- COT report showing that NZD long positions are getting closed while NZD shorts are not increasing which means that this is a take profit for Long positions and still not a change in positions to Short NZD. We need more views on next 2 weeks positioning in order to have clear view on position changes.
- Seasonality showing that EURNZD will reach it’s top this month and will start continuing it’s bearish trend. Which could justify the spike this month along with the COT long positions.
- I’m looking for EURNZD to range between 1.7020/1.6820 after the current run from the lows created at 1.6500 which acts as a HL after the 1.6320 LL created in Feb.
- Will prefer longs with support formation above 1.6700 to retest the highs created at 1.6980 and may be continuation. And shorts with resistance formation below 1.6980 to retest the broken range high at 1.6660/1.6620
- Building Permits on Tuesday and Consumer Confidence on Thursday may give some move during Asian Session but not trend changer.
Weekly Trade Plan 4H Chart:

EUR-JPYshare you're toughts on this one
-- dont take it as financial advice im still learning and i can't predict the future no one can!! --
The MACD indicator is showring that the bulls are losing power.

The Bitcoin Dominance could to explode this rally!!!Looking this Bitcoin Dominance, Bitcoin it's still bullish, now as we see, Bitcoin it's turn bullish and we could to see another bull rally extremely volatile or the next weeks to months for Bitcoin.
Ok, i we see the Daily timeframe, Bitcoin it's appear that form a strong support in the 60% of Bitcoin Dominance, that mean a good news for Bitcoin, becuase as we see this strong support, Bitcoin could to up toward the 72% of market dominance.
Now, this it's the 3 Daily chart, and we see that Bitcoin it's extremely bullish in the dominance, that mean that i you operate with altcoins, notice that:
Altcoins/Bitcoin = could to down, becuase as Bitcoin dominance make strenthten when you see or example: The relatonship ratio with Chainlink/Bitcoin, Ethereum/Bitcoin or Cardano/Bitcoin it's go to down becuase Bitcoin it's get more strenght to up. For that, we could to experiment that Bitcoin go to up against the altcoins. now, you can to sell altcoins but very careuly, not just analyze the Bitcoin dominance, analyze your altcoin/Bitcoin to know the relationship who it's more strong? Altcoin (like Ethereum, Cardano or Chainlink) or Bitcoin). But, don't worry, i you don't understand how to analyze altcoin/Bitcoin. I can to make this analyze for you and invest in this great opporutnity in this next altseason for Cardano, Chainlink, Ethereum or XRP, my top crytpcourrency that it's not BItcoin to get more Bitcoin usign their relationship. And also, i you see the MACD or RSI, both indicator are showing us a good news for Bitcoin.
And finally, the weekly chart it's extremely bullish, becuase we make support as I mark this trend line, and in four occasion we form a lower high, that could to explode the Bitcoin bull rally. For that, it'svery important i you invest in Bitcoin and altcoins, you will need to check out to become a crytpocurrency trader and like an expert to analyze it.
Guys, if you found out that this idea it's sound intersting for you, please comment below about your perspective and idea for the Bitcoin Dominance and share this analyze for other people know this information!!!

Bitcoin: Divergence D1Possible bearish divergence in the daily bitcoin chart that may lead us to retest the 42000 - 42500

The 15 min heikin ashi charts give you unbeliefable backtestsUsing a smoothed RSI indicator for entries and exits the backtest results for BTC on 15 min charts are almost unbeliefable.
I will keep monitoring this strategy...

FLNT in a declining channel?Hi. Since the end of February FLNT has been in a bearish trend after barely breaking its high from May in 2020.
I perceive no reason to believe this trend will reverse.
On the chart is a channel within which I anticipate the price will remain as it continues to drop and that the price will imminently bounce off the top line of the channel to then retreat to continue the trend.
The low MACD and its movement to cross its Signal within a week supports this.
The current low RSI also shows that there is room for buy to move the price to the top line of the channel.
Its high volatility could however undermine both these indications, but its improbable.
Two examples are shown on the chart: A long position to profit off the bounce and a following short position for the return to trend.
Thank you. Please, if you have any thoughts or comments do leave them below and I would gladly discuss or adjust my interpretations and methods with you.
This does not constitute financial advice.
Any projected prices, even if explicitly stated, are made with intent to discuss the symbol and potential interpretations.
Any trades shown or mentioned are examples and neither recommendations or mandates.

Price rise as volatility drops?Hi. The Volatility of the Symbol MAGS has for the first time since the turn of the year lowered from a high level down to a center level.
At the same time the MACD is currently crossing its signal while below the MACD 0 value.
The price has also had steady highest lows since the start of the year.
It could be construed that the lowest highs since the spike at the start of February create a triangle together with its corresponding bottom line, but the top line in this triangle is not as clear or strong as its bottom.
The price is currently dancing over the MA 56 after dipping below since the start of March but as the price approaches the tip of the triangle and if the price breaks out of the triangle top line it will also stay above the MA more consistently.
The RSI is currently high, at a value of around -30, but that value is consistent with past price increases which have held a high RSI even as the price has increased over a longer period.
The example long trade shown has a TP that lies just below the high price of the 5th of February spike and a SL just below the low of the 8th of March and a buy line at the crossing of the triangles lines.
Oh, and MAGS is a company that deals with security installations at borders, airports and other sensitive installations. As passage of travelers is increasingly allowed throughout the coming year demand and interaction with systems like these will increase and be amplified by the needs of increased security screenings in both areas of transportation and governmental institutions. Just a thought.
Thank you. Please, if you have any thoughts or comments do leave them below and I would gladly discuss or adjust my interpretations and methods with you.
This does not constitute financial advice.
Any projected prices, even if explicitly stated, are made with intent to discuss the symbol and potential interpretations.
Any trades shown or mentioned are examples and neither recommendations or mandates.

CHFJPY: Chances are Back !If you have missed this one, then your chances are back. Our uptrend was broken then the price went back to the higher levels where it was trading last week. More confluence means less risk. RSI is reaching critical levels pushing bears more. The price can still trade inside the resistance zone for a couple of days, so trade safe and best of luck !
If you like the idea, support us with a like and follow.
MacroForex

Long on #IESC - bullish patternNASDAQ:IESC
- Good pattern
- When below 50MA tend to recover
- MACD and RSI good
- FIB extension levels

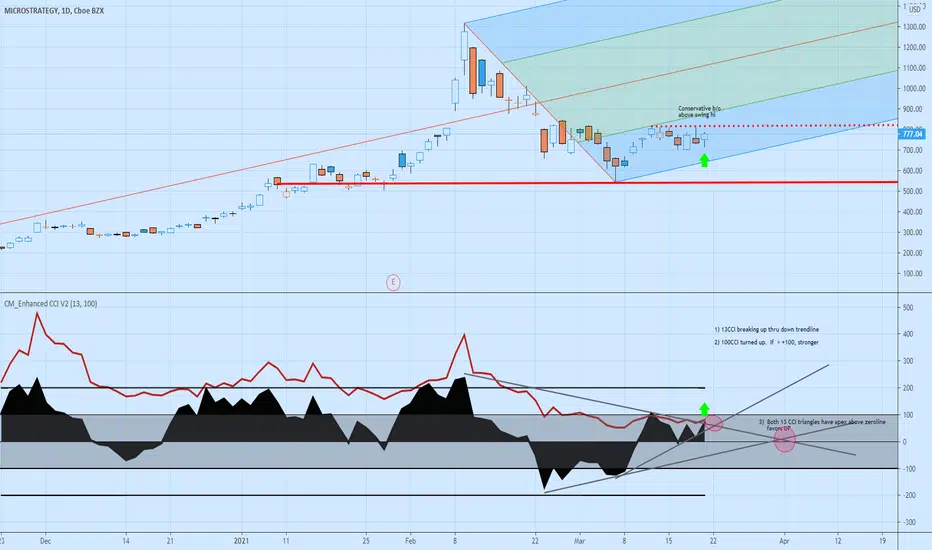
MSTR Daily Long 13CCI tlb triangle apexMSTR Daily -13 CCI has a Long signal just triggered with a cross up thru a down trnedline on CCI for an aggressive Long at 773. The continuation of Up is favored by location of two CCI triangle apices being above zeroline.
More conservative traders may wait for a breakout above the swing high dotted line, to avoid any possible continuation of zigzag retracement down to the swing low solid line or lower.
Check out 16 Apr 750 Call for 107.00, 21 May 780 Call for 145.00. Feb 20021 high was above $1300
Reversal would be a 13 CCI break down through an Up trendline (not shown, to retain clarity)
$AAME Target 8.54 for 51.42% $AAME Target 8.54 for 51.42%
Or next add level is at 2.88
I am not your financial advisor. Watch my setups first before you jump in… My trade set ups work very well and they are for my personal reference and if you decide to trade them you do so at your own risk. I will gladly answer questions to the best of my knowledge but ultimately the risk is on you. I will update targets as needed.
GL and happy trading.

Head & Shoulders, MACD reversing on all time frames upwardsGot that head & shoulders, as well MACD is heading upwards on all time frames. Today would be a make or break, but the Fed isn't going to raise interest rates for a while. I could see it heading up to 800 - 900 resistance area, however will want to consider how Volkswagen can impact sentiment on Tesla. I just swing trade so looking for around a 30% gain in the next month or so, watching tech though because that can cause worse performance.

Bitcoin is getting ready for a big breakoutThe sign is clear, a pendant indicates a big change is about to happen, also the ADX (bottom indicator) shows the price is slightly undervalued. The MACD is indicating the price might prepare for a new trend. And what the trendlines also shows is a strong support ... I expect a bounce, and hopefully we'll see a breakout to 60.000$++ new ATH is coming guys! If bitcoin fails, and breaks the support, we might see a big fall... But I'm positive! We are bullish! So much and this is just consolidation before a big breakout!
I'm goin Long! Still a good time to buy in.

EXY is at a critical turning point.EXY is at a critical turning point which will judge its course in the future. Looking at the data in the charts, it is obvious that the sellers are trying to lead the index to lower price levels.
Starting from the analysis of the trend and its momentum, in the price chart on the left, there is a downtrend lately which has led to the break of the lower limits of the uptrend channel, creating two lower lows as well as two lower highs. Continuing the analysis with the averages, which follow the trend, it seems that a change in the direction followed by the prices is imminent. Specifically, the position of the green average, it is the one that indicates the type of the trend, and its attempt to go below the white average is an indication of an impending change in the direction of the price. Then the data from the MACD show a weak momentum, at the moment, which does not cease to be negative. Looking back at the chart, however, the MACD’s momentum was not as strong as now and the green average did not try to break the white in the previous attempt of the sellers to lead the EXY to lower levels. These data may lead to the conclusion that this may be the beginning of a downward trend in EUR Index prices.
On the other hand, focusing on the data that arise from the analysis of support and resistance levels, there are some points of interest that need special attention to make any decision. At this point I should mention that some levels of Fibonacci Retracement and Expansion have been deliberately removed as well as several levels of support and resistance have been omitted to make the chart as clear as possible. In the findings of the analysis, it is obvious that the downward trend of prices stopped right at the confluence of the levels 100.0FE and 61.8FR as well as at the support level 119.00. Also, the fact that the fall was stopped at 61.8 FR, which is an important limit in the study of Fibonacci levels, testing it twice in recent times, it is concluded that the dynamics of sellers, at present, is not enough to push EXY to lower price levels than currently. Some very critical levels that are formed after the application of the Fibonacci tools as shown in the chart are the resistance levels 119.8 and 123.0 as well as the support levels 119.0 - 116.3 and 113.5.
Considering the above findings, the conclusion is that the index is at a very important price level. A breakout of the 119.0 level could lead to a further drop to the 116.3 price level and then to 113.5. On the other hand, the possibility of prices breaking 119.8 may lead to higher price levels, initially up to 123.0, and in the end, the downward trend of the last period may be considered as a correction.

ADDED to $AREC yesterday Target 7.31 for 27.43% ADDED to $AREC yesterday Target 7.31 for 27.43%
Or next add level is pretty close at 4.18
Huge Range on this one, haha.
I am not your financial advisor. Watch my setups first before you jump in… My trade set ups work very well and they are for my personal reference and if you decide to trade them you do so at your own risk. I will gladly answer questions to the best of my knowledge but ultimately the risk is on you. I will update targets as needed.
GL and happy trading.

Buy opportunity in MVPA$5.9 is good price to buy in LVN zone of Volume Profile graph. There is a MACD cross on oversell zone. TP1 is 6.12 and TP2 is 6.57. Stopless is 5.70

4 hour sell technical analysisPresented is the four hour chart with MACD and RSI playouts.
RSI has been trend trading within oversold zone and continues with a confirmed MACD/SIGNAL divergence below zero line.
Two take profit points the first being .95900 with a take profit 2 at .91400 if first support breaks.
Please comment with thoughts and ideas. Thank you!

PolyNovo - The bullish divergenceASX:PNV The indicator is indicating that share price should be heading higher.
Since market update in january 2021, PolyNovo has lost around 33 per cent of its value due to slowdown in second-quarter sales.
PolyNovo has reported an increase in sales of 31 per cent in the first half of the 2021 financial year, despite slower-than-expected sales through October and November.
The company's first half result was driven largely by a 75 per cent increase during the first quarter of the financial year, compared with the same quarter a year prior.
Sales were particularly strong in the US, where first half sales were up 41 per cent on a year prior. Sales for the month of December exceeded budget.
The company also recorded its first sale to Taiwan in December. Sales in Taiwan and New Zealand exceeded sales for the month of December.
"In the short-term forecasting sales will be challenging particularly in the US, however the medium-term outlook is strong, and we continue to see surgeons using and referring NovoSorb BTM to their peers," said PolyNovo managing director Paul Brennan.
"Once hospitals have more capacity, we will see US and UK sales accelerate just as we have seen in New Zealand and Australia. New geographies offer good opportunities for NovoSorb BTM."


ADBE Further Downside?Looking at a triple top for ADBE in day view, followed by a breakdown below both the 20 and 200 day MA. Looks to have found support at 420, but hit the top of the downward trend line and is sitting at a previously established support level around 445. If ADBE fails to break up and follows the downward trend line, it will be forced to retest 420. If it fails and breaks down, the next support is at 385 and is weak, with the next strong support being around 320 from all the way back in April '20. If 420 fails, there is a probable 5% downside and possible 13%, if not more.
The RSI is showing weakness, while the Stoch, MACD, and Madrid sentiment are all beginning to do the same. I will be watching for a potential short opportunity in the next few days.
Many other charts, including TSLA, AMZN, NFLX, PYPL, NVDA, AAPL, PDD, ASML, are all showing similar weakness (the largest caps on the IXIC), while INTC is failing to break up through its most recent resistance. CMCSA, another large cap IXIC, appears to be strong but showing overbought on the RSI and Stoch.
Buckle up, it could be a rough week.
