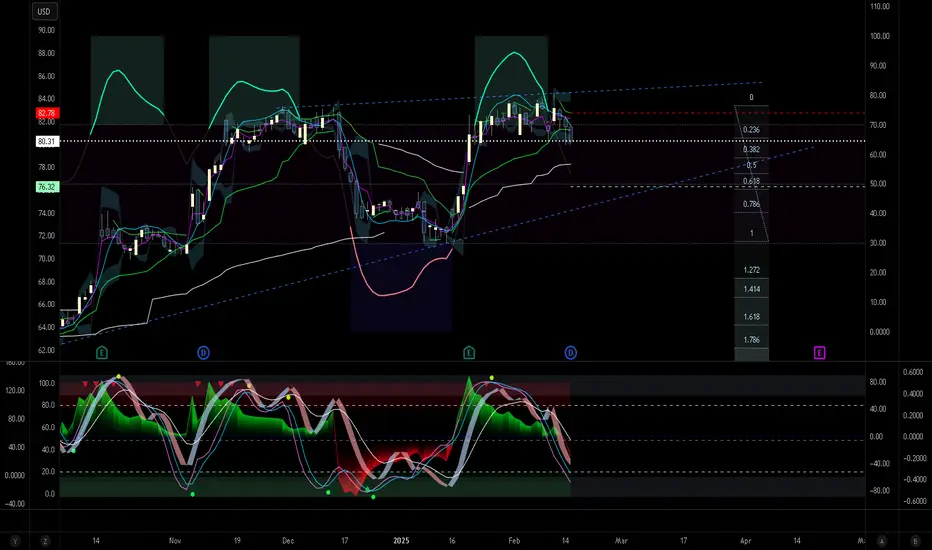
Continuing Correction Arista Net. ANETGoing off the technical picture, there is a general alignment from at least 5 different perspectives. The indicators I use look at the market from may different ways, deriving data from volumes, volatility, stochastics, momentum and simple stats like sigma deviations on the previous. Many cases do not offer a discernible Elliott count or a harmonic, but these are very useful when they are discernible.
Centered Oscillators

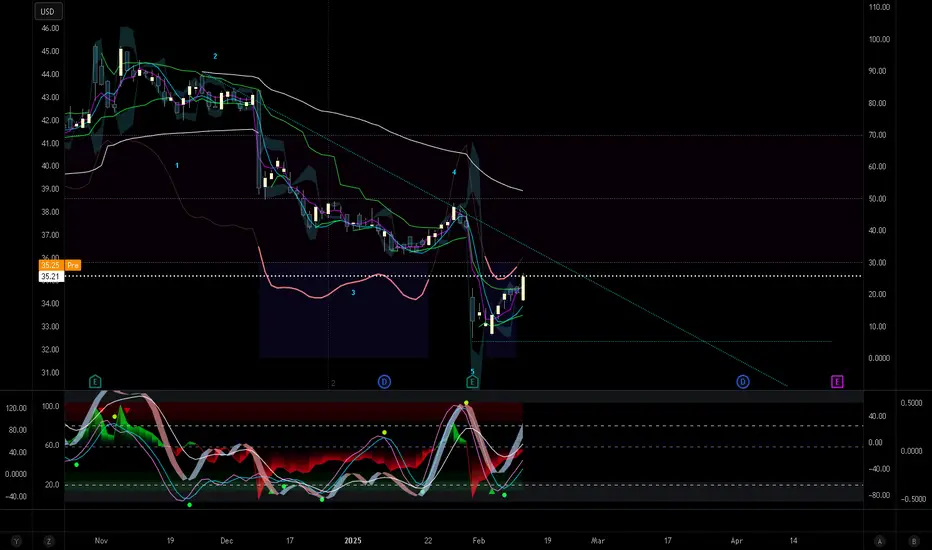
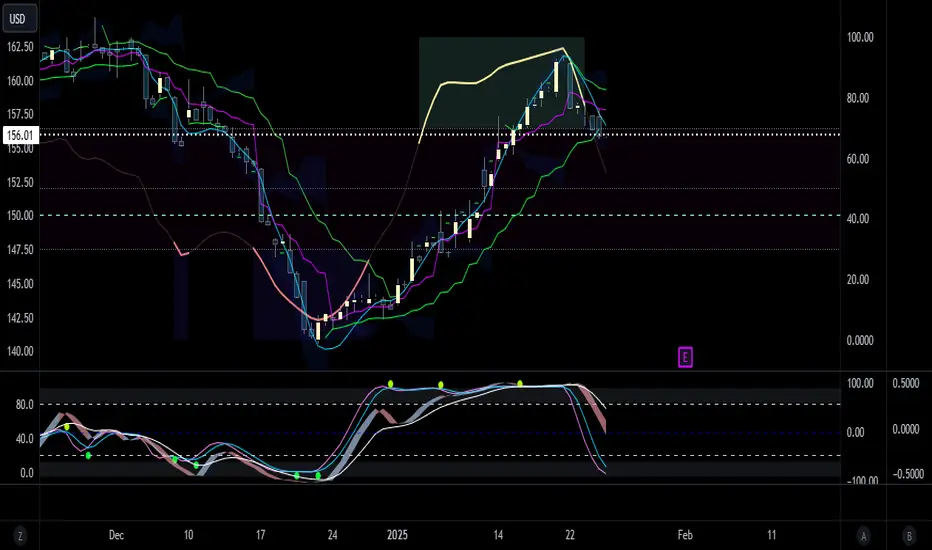
Fail to Breakout on Schwab. SCHWThere is probably a discernable Jurik RSX divergence on a higher time chart, as there is one VZO on this 12 hourly. And it would make sense. A good spot for entry here, as MIDAS line cross on the background of price action superior cross of vWAP and US lines. More technicality below- there is a cross of zero line on BB %PCT, and both Ehlers Stochastic RSI and VZO with offset are truly bearish. We might bounce at diagonal trendline painted in blue below.
Salesforce May Be OversoldSalesforce broke out in November. Now, after a period of consolidation, some traders may see potential for more upside in the software giant.
The first pattern on today’s chart is the March 2024 high of $318.71. CRM probed that level after the election and again in January. Prices have returned to it this week. Will old resistance become new support?
Second, the 100-day simple moving average (SMA) crossed above the 200-day SMA in late November and has approached the stock from below. Those signals may be consistent with a new uptrend that has potential for continuation.
Third, stochastics have dipped to an oversold condition. Investors may now watch for a crossover to signal a potential turn.
Finally, earnings are due after the closing bell on February 26.
TradeStation has, for decades, advanced the trading industry, providing access to stocks, options and futures. If you're born to trade, we could be for you. See our Overview for more.
Past performance, whether actual or indicated by historical tests of strategies, is no guarantee of future performance or success. There is a possibility that you may sustain a loss equal to or greater than your entire investment regardless of which asset class you trade (equities, options or futures); therefore, you should not invest or risk money that you cannot afford to lose. Online trading is not suitable for all investors. View the document titled Characteristics and Risks of Standardized Options at www.TradeStation.com . Before trading any asset class, customers must read the relevant risk disclosure statements on www.TradeStation.com . System access and trade placement and execution may be delayed or fail due to market volatility and volume, quote delays, system and software errors, Internet traffic, outages and other factors.
Securities and futures trading is offered to self-directed customers by TradeStation Securities, Inc., a broker-dealer registered with the Securities and Exchange Commission and a futures commission merchant licensed with the Commodity Futures Trading Commission). TradeStation Securities is a member of the Financial Industry Regulatory Authority, the National Futures Association, and a number of exchanges.
TradeStation Securities, Inc. and TradeStation Technologies, Inc. are each wholly owned subsidiaries of TradeStation Group, Inc., both operating, and providing products and services, under the TradeStation brand and trademark. When applying for, or purchasing, accounts, subscriptions, products and services, it is important that you know which company you will be dealing with. Visit www.TradeStation.com for further important information explaining what this means.

Can Rainbow MG3 Secure in the CME Trading Competition's Top 10?
Can Rainbow MG3 Secure a Spot in the CME Trading Competition's Top 10?
I've joined the CME trading competition 13 days late, but that hasn't stopped me from making an impact. After just two days of trading Bitcoin and Gold, my account is already up 6%, placing me in the top 14% out of nearly 50,000 traders.
The top 10 traders in the competition—many of whom are pro traders—have already racked up over $1 million in profits, making them part of the elite top 5%. The gap between them and the rest of the field is significant.
With 16 days left, my goal is to break into the top 10. I'm relying on the Rainbow MG3 indicator as my primary tool. The question is: Can Rainbow MG3 help me achieve this?
🚀 Follow my journey as I put this strategy to the test!

Bullish for Comcast. CMCSAWe finished a downward 5 wave Elliott impulse, with reversal being proven as far as we are concerned. The indicators are generally bullish, bullish divergent in tandem and pivoted. Good luck and manage your risk!
Buy on Intel Corp. INTCBreak out of channel with price action. Technicals also look favorable for a bullish position as well. It is the synchronicity that is most alluring. Four indicators flipped on the same candle on data exclusive (most likely) of the huge bullish engulfing candle at latest.

Claasic Zigzag on DocuSign. DOCUIt is always fun to see the easy picks unfold. The textbook type. Not only are they easy to spot, if you actually read trader literature, they make further position management much, much easier. Adaptive indicators, momentum are in agreement with the Elliott Wave take on this picture.
Breakout on FUTU Holdings. FUTUNo indicator is really needed to tell that there is a breakout happening. This may be a start of a Wave 3 of impulse. Technically the picture is looking bullish in unison. Another list of factors why is probably not necessary.
One Up on LYFT. LYFTIt appears that we might be leaving a tight trading range on the background of increasing peaks on VZO, RSX and BB %PCT. Tight trading ranges can be parts of B Waves if you follow Elliott. If that is the case, then we have more room to grow to the upside from that perspective as well. VWAP forms support as well.

Leap Ahead with a Bearish Divergence on Gold FuturesThe Leap Trading Competition: A Chance to Trade Gold Futures
TradingView’s "The Leap" Trading Competition is an opportunity for traders to test their futures trading skills. Participants can trade select CME Group futures contracts, including Gold Futures (GC) and Micro Gold Futures (MGC).
Register and participate here: TradingView Competition Registration .
This article presents a structured short trade setup based on a bearish divergence identified using the Commodity Channel Index (CCI) and key pivot point levels for confirmation. The trade plan focuses on waiting for price to break below the pivot point at 2866.8 before executing the trade, with clear targets and risk management.
Identifying the Trade Setup
Bearish divergence occurs when price makes higher highs while an indicator, such as CCI, makes lower highs. This signals weakening momentum and a potential reversal. The Commodity Channel Index (CCI) measures price deviations from its average and helps traders identify overbought or oversold conditions.
Pivot points are calculated from previous price action and serve as key support and resistance levels. The pivot at 2866.8 is the reference level in this setup. A breakdown below this level may suggest further downside momentum, increasing the probability of a successful short trade.
The trade plan combines CCI divergence with pivot point confirmation. While divergence signals a potential shift, entry is only considered if price trades below 2866.8. This approach reduces false signals and improves trade accuracy. The first target is set at 2823.0, aligning with an intermediate support level (S1), while the final target is near S2 at 2776.2, just above a UFO support zone.
Trade Plan and Risk Management
The short trade is triggered only if price trades below 2866.8. The stop loss is placed above the entry at a level ensuring at least a 3:1 reward-to-risk ratio.
Profit targets are structured to lock in gains progressively:
The first exit is at 2823.0, where partial profits can be taken.
The final exit is near 2776.2, positioned just above a UFO support level.
Stop placement may vary based on the trader’s preferred risk-reward ratio. Position sizing should be adjusted according to account size and market volatility.
Contract Specifications and Margin Requirements
Gold Futures (GC) details:
Full contract specs: GC Contract Specifications – CME Group
Contract size: 100 troy ounces
Tick size: 0.10 per ounce ($10 per tick)
Margin requirements depend on broker conditions and market volatility. Currently around $12,500 per contract.
Micro Gold Futures (MGC) details:
Full contract specs: MGC Contract Specifications – CME Group
Contract size: 10 troy ounces (1/10th of GC)
Tick size: 0.10 per ounce ($1 per tick)
Lower margin requirements provide access to smaller traders. Currently around $1,250 per contract.
Leverage impacts both potential gains and losses. Traders should consider market conditions and margin requirements when adjusting position sizes.
Execution and Market Conditions
Before executing the trade, price must break below 2866.8. Additional confirmation can be sought through volume trends and price action signals.
If price does not break the pivot, the short setup is invalid. If price consolidates, traders should reassess momentum before committing to the trade.
Conclusion
Bearish CCI divergence signals potential market weakness, but confirmation from the pivot breakdown is key before executing a short trade. A structured approach with well-defined targets and risk management increases the probability of success.
For traders in The Leap Trading Competition, this setup highlights the importance of discipline, confirmation, and scaling out of trades to manage risk effectively.
When charting futures, the data provided could be delayed. Traders working with the ticker symbols discussed in this idea may prefer to use CME Group real-time data plan on TradingView: www.tradingview.com - This consideration is particularly important for shorter-term traders, whereas it may be less critical for those focused on longer-term trading strategies.
General Disclaimer:
The trade ideas presented herein are solely for illustrative purposes forming a part of a case study intended to demonstrate key principles in risk management within the context of the specific market scenarios discussed. These ideas are not to be interpreted as investment recommendations or financial advice. They do not endorse or promote any specific trading strategies, financial products, or services. The information provided is based on data believed to be reliable; however, its accuracy or completeness cannot be guaranteed. Trading in financial markets involves risks, including the potential loss of principal. Each individual should conduct their own research and consult with professional financial advisors before making any investment decisions. The author or publisher of this content bears no responsibility for any actions taken based on the information provided or for any resultant financial or other losses.

Breakout for MGO Global Inc. MGOLA nice gapping breakout, crossing every indicator line on the price chart on the background of momentum %pct divergences. This one could go far.

Gap and Possible Reversal for Roblox. RBLXIn many ways a similar picture to Google today. End of trend is unconfirmed, but the gap and "change in tone" of candle is suggestive. If this is not the end of the road then we might be looking at the beginning of a Wave 4 or Sub-Wave 4 on some level. There is technical indicator evidence of a reversal, also.

Lowe’s Makes a Lower HighLowe’s has been falling since mid-October, and some traders may see further downside risk.
The first pattern on today’s chart is the series of lower highs and lower lows over the last three months. If the resulting descending channel remains in effect, it could point to potential move below the January 8 low of $242.96.
Next, the 50-day simple moving average (SMA) recently turned negative and crossed below the 100-day SMA. Prices are now stalling at both. That may suggest its longer-term is weakening.
LOW also ended last week below its 8-day exponential moving average. That may suggest its short-term is weakening.
Next, stochastics are dipping from an overbought condition.
Finally, President Trump’s tariffs on Mexico and Canada may impact the home-improvement chain.
TradeStation has, for decades, advanced the trading industry, providing access to stocks, options and futures. If you're born to trade, we could be for you. See our Overview for more.
Past performance, whether actual or indicated by historical tests of strategies, is no guarantee of future performance or success. There is a possibility that you may sustain a loss equal to or greater than your entire investment regardless of which asset class you trade (equities, options or futures); therefore, you should not invest or risk money that you cannot afford to lose. Online trading is not suitable for all investors. View the document titled Characteristics and Risks of Standardized Options at www.TradeStation.com . Before trading any asset class, customers must read the relevant risk disclosure statements on www.TradeStation.com . System access and trade placement and execution may be delayed or fail due to market volatility and volume, quote delays, system and software errors, Internet traffic, outages and other factors.
Securities and futures trading is offered to self-directed customers by TradeStation Securities, Inc., a broker-dealer registered with the Securities and Exchange Commission and a futures commission merchant licensed with the Commodity Futures Trading Commission). TradeStation Securities is a member of the Financial Industry Regulatory Authority, the National Futures Association, and a number of exchanges.
TradeStation Securities, Inc. and TradeStation Technologies, Inc. are each wholly owned subsidiaries of TradeStation Group, Inc., both operating, and providing products and services, under the TradeStation brand and trademark. When applying for, or purchasing, accounts, subscriptions, products and services, it is important that you know which company you will be dealing with. Visit www.TradeStation.com for further important information explaining what this means.

GBPAUD about to drop for more than 170 pipsBased on my algorithms & data, GBPAUD is about to drop for more than 170 pips

Chainlink Could Target $30 Once It Breaks Descending Triangle
Chainlink (LINK), the leading decentralized oracle network, has been consolidating within a descending triangle pattern on its price chart. This technical formation often signals a period of indecision among market participants, but it also carries the potential for a significant breakout. If LINK successfully breaks above the descending trendline, it could ignite a powerful rally, potentially propelling the price towards the $30 mark.
Understanding the Descending Triangle
A descending triangle is a bearish chart pattern characterized by a series of lower highs and relatively flat lows. It suggests that selling pressure is gradually increasing, while buying pressure remains relatively weak. However, the flat lows indicate that there is still significant support for the asset.
In the case of Chainlink, the price has been consolidating within this descending triangle for several weeks. This period of consolidation allows market participants to accumulate positions and prepare for a potential breakout.
Factors Fueling a Potential Rally
Several factors could contribute to a bullish breakout and propel Chainlink's price towards $30:
• Growing Adoption: Chainlink's technology continues to gain traction across various sectors, including DeFi, gaming, and enterprise applications. As more projects integrate Chainlink's oracles, the demand for LINK tokens is likely to increase.
• Technological Advancements: Chainlink is constantly evolving and improving its technology, enhancing its security, scalability, and interoperability. These advancements can attract new users and drive further adoption.
• Favorable Market Conditions: A broader bullish trend in the cryptocurrency market could provide a significant tailwind for Chainlink. If Bitcoin and other major cryptocurrencies experience a sustained rally, Chainlink could benefit from increased investor interest and capital inflows.
• Technical Breakout: A successful breakout above the descending trendline would be a strong technical signal, confirming the bullish sentiment and attracting more buyers to the market.
Technical Analysis
Technical analysis provides several clues about the potential for a bullish breakout.
• Volume: A surge in trading volume accompanying a breakout would significantly increase the likelihood of a sustained rally.
• Moving Averages: A move above key moving averages, such as the 50-day and 200-day moving averages, would further strengthen the bullish case.
• Relative Strength Index (RSI): The RSI is a momentum indicator that can help identify overbought or oversold conditions. A breakout accompanied by a rising RSI would suggest strong bullish momentum.
Potential Challenges and Risks
While the outlook for Chainlink appears promising, it is crucial to acknowledge potential challenges and risks:
• Competition: Chainlink faces competition from other decentralized oracle networks and emerging technologies.
• Regulatory Uncertainty: The regulatory landscape for cryptocurrencies remains uncertain, and any negative regulatory developments could impact Chainlink's price.
• Market Volatility: The cryptocurrency market is highly volatile, and sudden price swings can significantly impact Chainlink's price.
Investment Considerations
Investing in cryptocurrencies carries significant risks, including the risk of losing all or part of your investment.
• Conduct thorough research: Understand the technology behind Chainlink, its potential use cases, and the risks involved.
• Diversify your portfolio: Don't invest all your funds in a single cryptocurrency.
• Invest only what you can afford to lose: Avoid investing more than you can afford to lose financially.
• Stay informed: Keep abreast of the latest developments in the Chainlink ecosystem and the cryptocurrency market as a whole.
Conclusion
Chainlink has the potential to play a crucial role in the future of decentralized finance and blockchain technology.
• If it successfully breaks out of the descending triangle pattern and gains traction in the broader market, it could experience significant price appreciation.
• However, investors should carefully consider the risks involved and conduct thorough research before making any investment decisions.
Disclaimer: This article is for informational purposes only and does not1 constitute financial advice.
• Investing in cryptocurrencies2 involves significant risks, and you should carefully consider your investment objectives, financial situation, and risk tolerance before making any investment decisions.
Note: This article provides a general overview of Chainlink and its potential.
• The cryptocurrency market is dynamic and subject to rapid change.
• It is essential to conduct independent research and consult with a qualified financial advisor before making any investment decisions.
Disclaimer: This article is for informational purposes4 only and does not constitute financial advice.
• Investing in cryptocurrencies5 involves significant risks, and you should carefully consider your investment objectives, financial situation, and risk tolerance before making any investment decisions.6

XRP Bollinger Bands Tighten: Price Explosion Ahead?XRP, the digital asset powering Ripple's payment network, has been a subject of intense speculation and trading activity within the cryptocurrency market.1 Recently, a key technical indicator known as Bollinger Bands has been exhibiting a pattern that often precedes significant price movements.2 This phenomenon, known as a "tightening" or "squeeze," has caught the attention of traders and analysts, raising questions about XRP's next major price swing.3
Understanding Bollinger Bands
Bollinger Bands, developed by John Bollinger, are a popular technical analysis tool used to measure price volatility and identify potential overbought or oversold conditions.4 The indicator consists of three lines plotted on a price chart:5
• Middle Band: A simple moving average (SMA) of the price, typically a 20-day SMA.6
• Upper Band: Calculated by adding a certain number of standard deviations (usually two) to the middle band.7
• Lower Band: Calculated by subtracting the same number of standard deviations from the middle band.
The bands widen when the price is volatile and contract when the price is stable.8 This dynamic nature of the bands provides traders with valuable insights into the degree of price fluctuations.9
The Significance of a Tightening
When the Bollinger Bands tighten, it indicates a period of low volatility.10 The price is confined within a narrow range, and the bands contract towards the middle band.11 This pattern often precedes a significant price movement, as the energy stored during the period of consolidation is released in a subsequent breakout or breakdown.12
The direction of the breakout is not predetermined by the tightening itself. The price can break out above the upper band, signaling a bullish move, or break down below the lower band, indicating a bearish move.13 Traders often look for other confirming indicators or patterns to anticipate the direction of the breakout.14
XRP's Tightening Bollinger Bands
In the case of XRP, the Bollinger Bands on the daily chart have been observed to be tightening.15 This suggests that a major price move could be on the horizon. The cryptocurrency has been trading within a relatively narrow range, and the bands have been contracting, indicating decreasing volatility.16
This tightening pattern has raised speculation about the direction of XRP's next major price swing.17 While the tightening itself does not provide a definitive answer, it does suggest that a significant move is imminent.18 Traders are closely monitoring the price action for signs of a breakout or breakdown.19
XRP Price Falling: Doji Candle Points to a Rally to $5+ After Crash?
Adding another layer of intrigue to XRP's price action is the recent formation of a doji candle. A doji is a candlestick pattern characterized by a small body and long upper and lower wicks.20 It indicates indecision in the market, as neither buyers nor sellers are in clear control.
Doji candles are often observed at turning points in the market, signaling a potential reversal of the prevailing trend.21 In the case of XRP, the doji has formed after a period of price decline, suggesting that the selling pressure may be waning.
Some analysts interpret this doji formation as a potential precursor to a rally, with some even speculating a surge to $5 or beyond. However, it's crucial to exercise caution and consider other factors before drawing definitive conclusions.
Additional Factors to Consider
While the tightening Bollinger Bands and the doji candle provide valuable insights, it's essential to consider other factors that could influence XRP's price action:
• Market Sentiment: The overall sentiment in the cryptocurrency market can significantly impact XRP's price.22 Positive news or developments could fuel a rally, while negative news or regulatory concerns could trigger a decline.
• Fundamental Developments: Ripple's ongoing legal battle with the U.S. Securities and Exchange Commission (SEC) continues to be a major factor influencing XRP's price.23 A favorable outcome could boost investor confidence, while an unfavorable outcome could have the opposite effect.
• Trading Volume: Increased trading volume during a breakout or breakdown can provide further confirmation of the move's validity. Low volume breakouts can be unreliable and prone to reversals.
Conclusion
The tightening Bollinger Bands on XRP's daily chart suggest that a major price move is imminent.24 The formation of a doji candle adds further intrigue, hinting at a potential reversal of the recent downtrend.
However, it's crucial to consider other factors, such as market sentiment, fundamental developments, and trading volume, before making any trading decisions. The cryptocurrency market is highly volatile, and prices can fluctuate significantly in short periods.25
Traders should exercise caution, conduct thorough research, and use appropriate risk management strategies. While the technical indicators provide valuable insights, they should not be the sole basis for investment decisions.

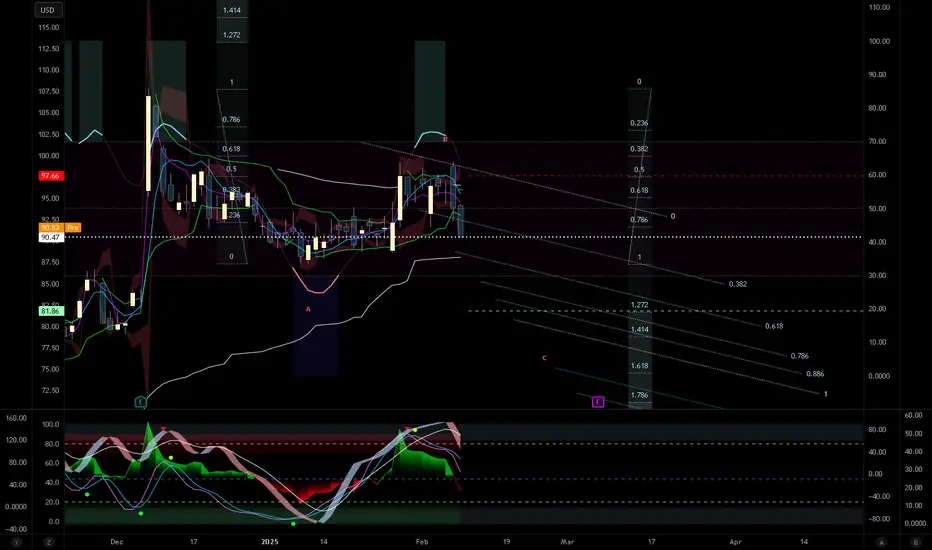
Chevron Heading Underground. CVXA bearish outlook on this situation from a purely technical standpoint. The amalgamation of factors make for a convincing picture. There is a break of MIDAS line, price action cross of US and vWAP line, cross of US/vWAP lines, negative volatility zone oscillations, negative stochastics, trigger cross of downgoing vzo ribbon. And to top it off, exit out of the OBOS territory by the momentum indicator. Good luck out there!
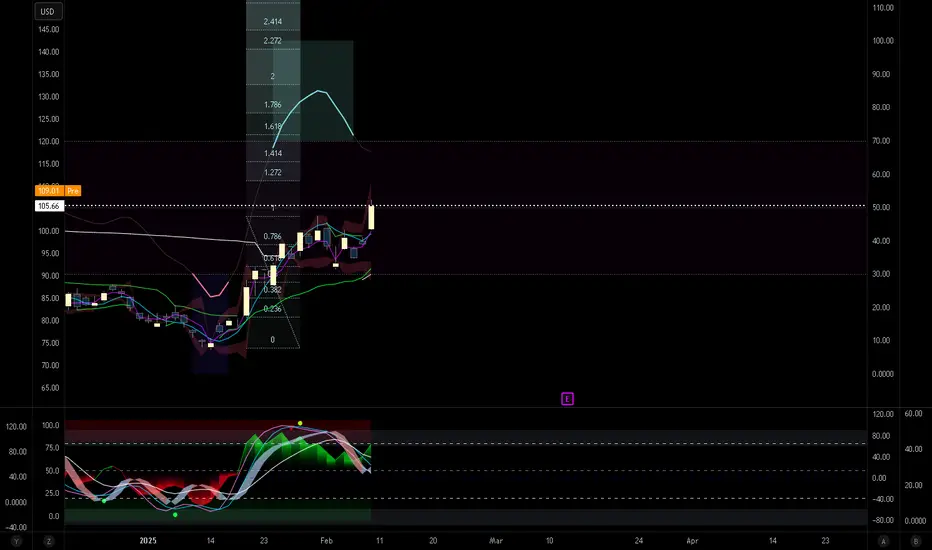
Linde PLC Overstretched. LINConsidering a short on the six hourly chart for Linde. Even though MIDAS line had not been crossed, the market cannot continue in this current fashion. The picture is overbought, flipped on stochastics and volatility with both US and vWAP crossed by price action, which is also suggestive in itself. Different strategies are required in taking advantage of ongoing trends, reversals and breakouts. One strategy or just one algorithm to take advantage of just one aspect of market action is never enough to draw consistent profits.

ConocoPhillips May Be Trending LowerConocoPhillips has made lower highs since last spring, and some traders may think the oil driller is poised for another move to the downside.
The first pattern on today’s chart is the October 31 low of $106. COP tried to hold that level in late November before sliding into the double digits. Prices rebounded to stall around the same location last week. Has old support become new resistance?
Second, the 50-day simple moving average (SMA) had a “death cross” below the 200-day SMA in July. The 100-day SMA is in between. That kind of sequence, with faster SMAs below slower SMAs, may reflect a downtrend.
Third, stochastics have reached an overbought condition.
TradeStation has, for decades, advanced the trading industry, providing access to stocks, options and futures. If you're born to trade, we could be for you. See our Overview for more.
Past performance, whether actual or indicated by historical tests of strategies, is no guarantee of future performance or success. There is a possibility that you may sustain a loss equal to or greater than your entire investment regardless of which asset class you trade (equities, options or futures); therefore, you should not invest or risk money that you cannot afford to lose. Online trading is not suitable for all investors. View the document titled Characteristics and Risks of Standardized Options at www.TradeStation.com . Before trading any asset class, customers must read the relevant risk disclosure statements on www.TradeStation.com . System access and trade placement and execution may be delayed or fail due to market volatility and volume, quote delays, system and software errors, Internet traffic, outages and other factors.
Securities and futures trading is offered to self-directed customers by TradeStation Securities, Inc., a broker-dealer registered with the Securities and Exchange Commission and a futures commission merchant licensed with the Commodity Futures Trading Commission). TradeStation Securities is a member of the Financial Industry Regulatory Authority, the National Futures Association, and a number of exchanges.
TradeStation Securities, Inc. and TradeStation Technologies, Inc. are each wholly owned subsidiaries of TradeStation Group, Inc., both operating, and providing products and services, under the TradeStation brand and trademark. When applying for, or purchasing, accounts, subscriptions, products and services, it is important that you know which company you will be dealing with. Visit www.TradeStation.com for further important information explaining what this means.

A look at Bitcoin's current chart in the very high timeframe
So, I mentioned Bitcoin would get a pullback to around 100k one more time before it breaks much higher and heads to 120k. Let's see how that plays out.
There's no indication to me whatsoever that Bitcoin price is trying to push lower from these levels which is
a nice change. Giving buyers another opportunity because I don't think bitcoin will see 100k again after today.
Price is on a monthly timeframe here but Macd & my 2 preferred underneath price and cruising upwards on 5 minute timeframe as well.

Downtrend in Devon Energy?Devon Energy has been sliding for more than two years, and now some traders may expect another downward thrust.
The first pattern on today’s chart is the price area between $38.29 and $40.54. It was the range after the last earnings report on November 5. DVN mostly held the zone through early December before sliding to a four-year low. It’s now rebounded and could be pausing at the same spot. Has old support become new resistance? (It also roughly matches monthly lows from September and October.)
Second, the 50-day simple moving average (SMA) has been under the 100-day SMA. Both are under the 200-day SMA. That’s potentially consistent with a longer-term downtrend in the oil-and-gas producer.
Third, stochastics have reached an overbought condition.
Finally, energy stocks have outperformed lately. Much of the strength resulted from moves by former President Biden. However incoming President Trump seems more focused on lower prices, which could pressure the sector again.
TradeStation has, for decades, advanced the trading industry, providing access to stocks, options and futures. If you're born to trade, we could be for you. See our Overview for more.
Past performance, whether actual or indicated by historical tests of strategies, is no guarantee of future performance or success. There is a possibility that you may sustain a loss equal to or greater than your entire investment regardless of which asset class you trade (equities, options or futures); therefore, you should not invest or risk money that you cannot afford to lose. Online trading is not suitable for all investors. View the document titled Characteristics and Risks of Standardized Options at www.TradeStation.com . Before trading any asset class, customers must read the relevant risk disclosure statements on www.TradeStation.com . System access and trade placement and execution may be delayed or fail due to market volatility and volume, quote delays, system and software errors, Internet traffic, outages and other factors.
Securities and futures trading is offered to self-directed customers by TradeStation Securities, Inc., a broker-dealer registered with the Securities and Exchange Commission and a futures commission merchant licensed with the Commodity Futures Trading Commission). TradeStation Securities is a member of the Financial Industry Regulatory Authority, the National Futures Association, and a number of exchanges.
TradeStation Securities, Inc. and TradeStation Technologies, Inc. are each wholly owned subsidiaries of TradeStation Group, Inc., both operating, and providing products and services, under the TradeStation brand and trademark. When applying for, or purchasing, accounts, subscriptions, products and services, it is important that you know which company you will be dealing with. Visit www.TradeStation.com for further important information explaining what this means.

Got my new script updated to Pine Script V6I'm all algorithmic trading, well, investing. I use the wealth of data we all have access to. My pine script connects to 3Commas with a rare dynamic volume scaling feature. This means the signals that are sent by this script from TV to 3C are updated with algorithmically-calculated volume scaling. This is not normally possible.
Another positive side effect of a dynamic VS TV 3C connection is you'll gain access to nearly unlimited numbers of safety orders. Also normally not possible.
I will launch bots on BTCUSD, ETHUSD, SOLUSD, and likely a basket of highly volatile assets. I can do stocks, forex, anything on TradingView. I'll be launching bots on all timeframes and diversifying as much as possible!

Nvidia Holds a Key LevelNvidia has done little since the summer, but some traders may see potential for the chip giant to extend its multiyear run.
The first pattern on today’s chart is the price area around $131.26. It was the high in August and has more or less represented the bottom of NVDA’s range since mid-October. Has new support been established above old resistance?
Next, stochastics are near an oversold condition. Similar readings have preceded bounces, as the white arrows in the lower study indicate.
Third, our Price Streak custom script in the lowest study shows the stock declined for five straight sessions. It’s the longest NVDA has been able to keep falling in the last two years. (Streaks of similar length have occurred a few other times in that period.) That may suggest selling pressure has peaked.
Finally, NVDA has tested and held its rising 100-day simple moving average.
TradeStation has, for decades, advanced the trading industry, providing access to stocks, options and futures. If you're born to trade, we could be for you. See our Overview for more.
Past performance, whether actual or indicated by historical tests of strategies, is no guarantee of future performance or success. There is a possibility that you may sustain a loss equal to or greater than your entire investment regardless of which asset class you trade (equities, options or futures); therefore, you should not invest or risk money that you cannot afford to lose. Online trading is not suitable for all investors. View the document titled Characteristics and Risks of Standardized Options at www.TradeStation.com . Before trading any asset class, customers must read the relevant risk disclosure statements on www.TradeStation.com . System access and trade placement and execution may be delayed or fail due to market volatility and volume, quote delays, system and software errors, Internet traffic, outages and other factors.
Securities and futures trading is offered to self-directed customers by TradeStation Securities, Inc., a broker-dealer registered with the Securities and Exchange Commission and a futures commission merchant licensed with the Commodity Futures Trading Commission). TradeStation Securities is a member of the Financial Industry Regulatory Authority, the National Futures Association, and a number of exchanges.
TradeStation Securities, Inc. and TradeStation Technologies, Inc. are each wholly owned subsidiaries of TradeStation Group, Inc., both operating, and providing products and services, under the TradeStation brand and trademark. When applying for, or purchasing, accounts, subscriptions, products and services, it is important that you know which company you will be dealing with. Visit www.TradeStation.com for further important information explaining what this means.
