EUR/USD Daily Chart Analysis For September 9, 2022Eurodollar has completed Interim Rebound and continues to hove near the 1.000 threshold by closing slightly below critical Mean Res 1.005. The Key Sup 0.9880 and our open Inner Currency Dip 0.9852 continue to be the main target, with further expansion to the Next Inner Currency Dip 0.9570 and the lower mark is in the making.
Macroeconomic Analysis And Trading Ideas

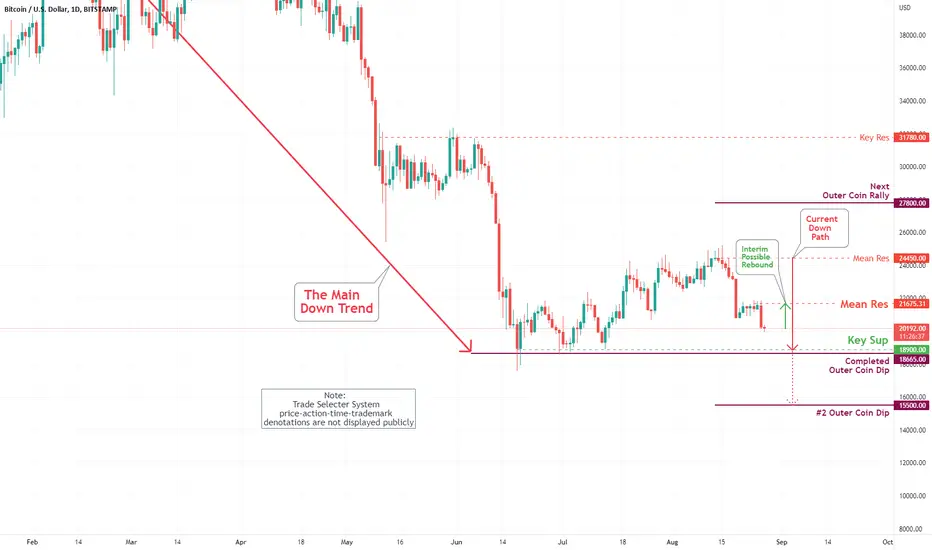
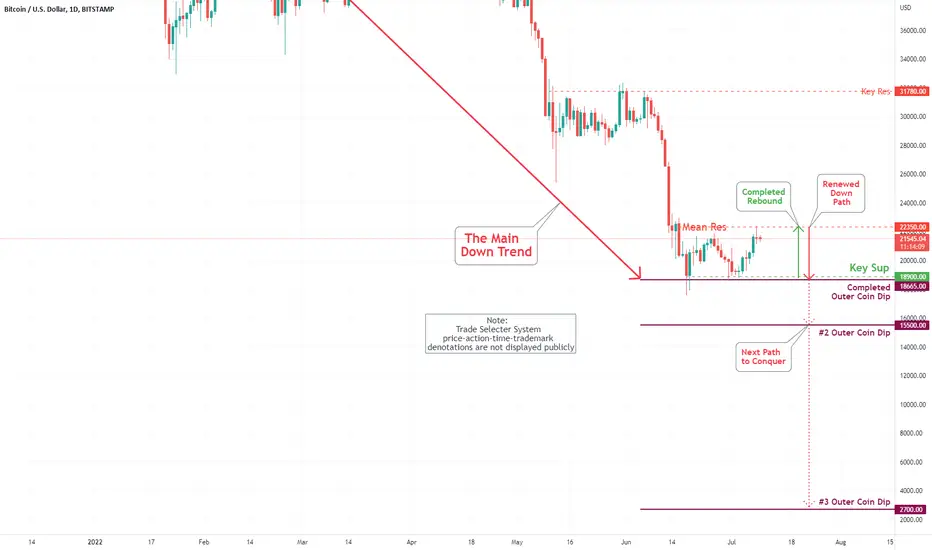
Bitcoin (BTC/USD) Daily Chart Analysis For September 9, 2022Technical Analysis and Outlook:
Bitcoin prices had rebounded from our Key Sup $18,900 and completed Outer Coin Dip $18,665 as specified on ''Daily Chart Analysis For September 2'' and moved aggressively to our Mean Res $21,600. As of this publishing, the coin's main retreat target is $20,200 before resuming up move.

As policies continue to diverge…For readers who have been following us right from our first ever TradingView idea, you’ll recall our first ever trade idea on long USDCNH. It’s been a fun 5 months writing and sharing our thoughts with the community.
Much has happened since April, but two critical things stayed the same. The US Federal Reserve remains hawkish, raising rates, while the PBoC remains dovish, continuing with its easing stance. The result? USDCNH trading beyond the 6.9 level, surpassing both our target levels.
With the next Federal Reserve meeting coming up, we think it’s time to review this idea again. The CME FedWatch Tool allows us to gauge what market participants are expecting the Fed to do. The prevalent consensus seems to be that the Fed is likely to raise rates till the end of the year before holding rates at the 3.75 – 4.00 % level for the next year.
On the other hand, the PBoC has continued to ease, cutting reserve requirement ratios & lowering its medium-term lending facility. With China still battling Covid via lockdowns, persistently low inflation numbers, and weak economic numbers, we see further easing on the cards from PBoC.
Looking at the charts, the USDCNH pair has just completed a symmetrical triangle chart pattern. After breaking out to the upside and a brief pull-back, prices continued upwards with strong momentum. Using classical charting techniques, the target levels for the breakout can be set to the distance of the high and low of the symmetrical triangle and applied to the top of the triangle. With the target price of 7.1180, there is still upside for this trade.
It seems that policy divergence will remain for these two major economies, which is likely to strengthen the USD and weaken the CNH further, driving up the USDCNH pair. Using technical to identify target levels where we will be comfortable, we think that there is room for more upside.
Entry at 6.9500, stop at 6.8545. Target at 7.1180.
The charts above were generated using CME’s Real-Time data available on TradingView. Inspirante Trading Solutions is subscribed to both TradingView Premium and CME Real-time Market Data which allows us to identify trading set-ups in real-time and express our market opinions. If you have futures in your trading portfolio, you can check out on CME Group data plans available that suit your trading needs www.tradingview.com
Disclaimer:
The contents in this Idea are intended for information purpose only and do not constitute investment recommendation or advice. Nor are they used to promote any specific products or services. They serve as an integral part of a case study to demonstrate fundamental concepts in risk management under given market scenarios.
Reference:
www.cmegroup.com

Can USD/JPY finally make a break for 140?The question on most trader's minds is whether USD/JPY will finally test 140. And another question is whether the BOJ (Bank of Japan) could intervene to weaken the yen and send USD/JPY lower. But it should be remembered that it is not an exact level in which the yen trades as to whether the BOJ intervenes, but how quickly it gets there. The BOJ have made it clear that they view a weaker currency as beneficial for the economy overall, so as long as volatility remains in check the potential for 140 USD/JPY (or higher) remains a distinct possibility. But given that Friday's NFP report is the main focus for the week, perhaps prices will remain below 139.39 heading into it and retrace against the trend.
As for the charts, its rally has stalled just below the YTD high (139.39) and a Doji formed on the daily chart, which shows a slight hesitancy to break immediately higher. The 20-bar eMA has provided support on the 4-hour chart and a bullish engulfing candle has formed, leaving the potential for another crack at the YTD high. But such key levels rarely break upon their first re-test, hence the potential for a pullback. But we'd look for bullish setups at or around the 138 support level or lower trendline, in anticipation of its next leg higher towards 140 - near the weekly R3 pivot point.

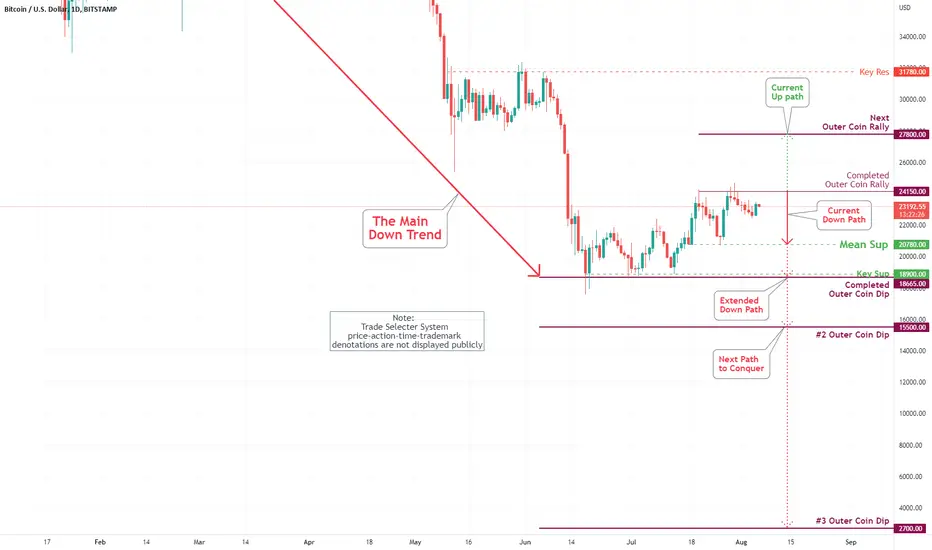
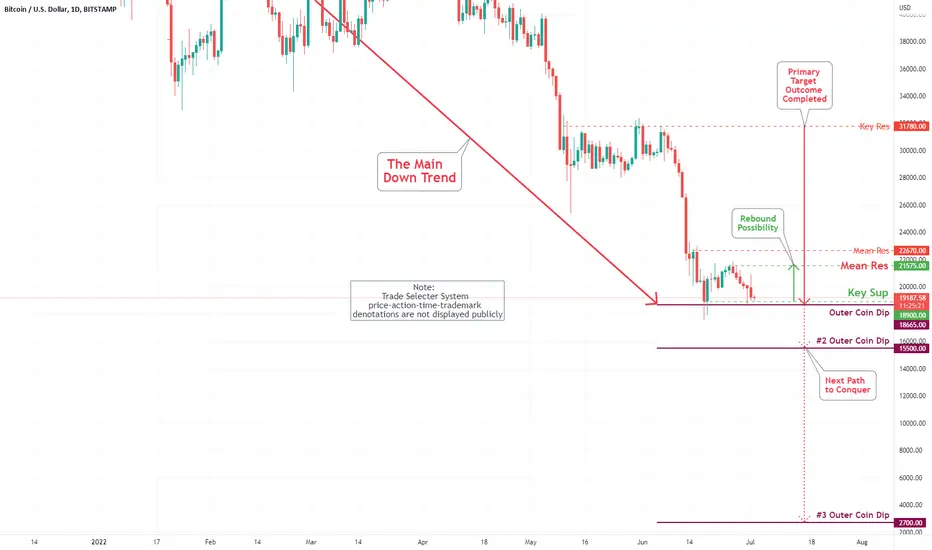
Bitcoin (BTC/USD) Daily Chart Analysis For September 2, 2022Technical Analysis and Outlook:
On the Bitcoin chart, the prices are sliding lower - first lever support is weak Sup at $19,540, next is major Key Sup at $18,900, and completed Outer Coin Dip at $18,665. An ultimate trip to #2 Outer Coin Dip of $15,500 is in the making.

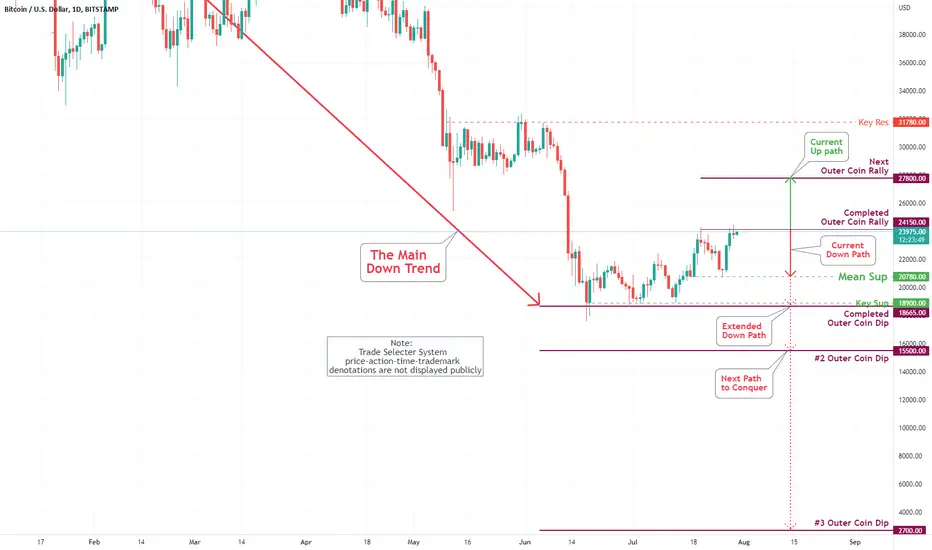
Bitcoin (BTC/USD) Daily Chart Analysis For August 26, 2022Technical Analysis and Outlook:
On the Bitcoin chart, the harsh price bar refers to the current down path, which is designated at Key Sup at $18,900 and completed Outer Coin Dip at $18,665, a descriptor of Bitcoin's volatile market price action. However, outside of these predictable analysis indicators designated by TradeSelecter, other economic and political determinants BTC's broader bearish sentiment.
Bitcoin (BTC/USD) Daily Chart Analysis For August 19, 2022Technical Analysis and Outlook:
The Bitcoin penetrated our Mean Sup of $22,575 and settled at a Mean Sup of $20,780. The rebound to Mean Res $24,450 is possible. The primary destination level to Key Sup 18,900 and Completed Outer Coin Dip $18,665 is in the process.

Bitcoin (BTC/USD) Daily Chart Analysis For August 12, 2022Technical Analysis and Outlook:
The coin is heading to Outer Coin Rally at $27,800. The primary support level is resting at $22,750.

Bitcoin (BTC/USD) Daily Chart Analysis For August 5, 2022Technical Analysis and Outlook:
The repeated retest of completed our Outer Coin Rally of $24,150 took place on July 29,30, and 31. The Mean Sup of $20,780 is the main target. There is a slight chance for a breakout to Outer Coin Rally $27,800.
Bitcoin (BTC/USD) Daily Chart Analysis For July 29, 2022Technical Analysis and Outlook:
After completing on July 20 our Outer Coin Rally of $24,150 and retreating to Mean Sup $20,780 (See Bitcoin (BTC/USD) Daily Chart Analysis For July 22), Bitcoin bounced back to competed Coin Rally and showing signs of extending its rally to Outer Coin Rally #27,800. However, if all fails, the coin will take us back down to Mean Sup $20,780, with a strong possibility to Key Sup $18,900 and beyond.
AUDCAD at a crossroad - LongThe pair is sitting below the 50 day SMA after clearing a trendline. I would like to see more action within this zone supporting a long trade considering that the zone also has a resistance level which the price broke to the downside in June.
Failure to break above this level will invalidate this idea. Therefore, the 0.86xxx and 0.83xx will come into focus
Fundamentally speaking, the AUD seems shielded from geopolitical impacts affecting Europe. Australia is expected to do better than other G10 countries as central banks rush to hike interest rates. In addition to this, weakness in the oil markets could lead to a weaker CAD. Oil markets are starting to price in a possibility of a global recession despite the tightness of the supply side the world is currently experiencing. Saudi Arabia has promised to increase supply into 2023 prompting oil prices to move lower
Risks to this play are as follows:
AUD tends to follow risk sentiment in equities. Therefore, if the equity markets reprice lower in the event of a recession, this AUD strength is going to subside. My assumption is that equity markets have already priced in a global mild recession given that as the market is considered efficient (Efficient market hypothesis states that markets are efficient i.e. have already priced in all the available information in the public domain leaving no room for investors to make excess profits)
Should oil prices remain elevated for longer, i.e. the futures curve reprices higher as time moves on, the CAD will remain relatively strong. This is the biggest risk to LONG play.
Should the two above risks play out at the same time - a mild recession and higher energy prices, that would possibly push the AUDCAD pair lower towards the March 2020 Low pivot level.
It's important to understand the macro background in order to inform your decision on how to position for this play. However, I'm currently bullish on this pair unless risks come to fruition.

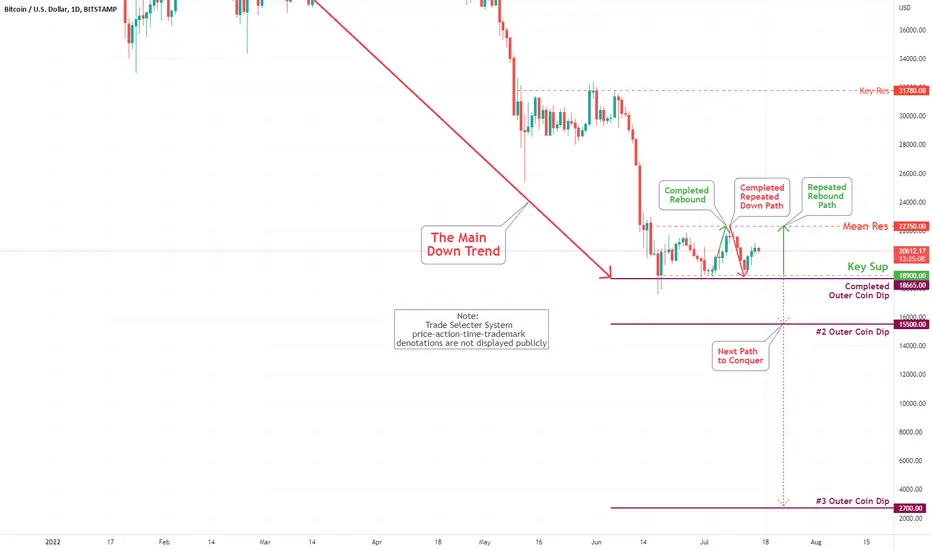
Bitcoin (BTC/USD) Daily Chart Analysis For July 22, 2022Technical Analysis and Outlook:
Bitcoin hit and completed our outer Coin Rally of $24,150 and currently retreating to Mean Sup $20,780. Extended down the path to Key Sup $18,900 and completed Outer Coin Dip is very probable - #2 Outer Coin Dip $15,500 mark is in the making.

USD/CADWhat is your opinion for this trade?
I Waiting for a long trade on USD/CAD because bias price is bullish and he made all confirmation what I need.
I want share this idea with you and I want to give me an feedback. Sorry for my English.
I WISH YOU A GOOD DAY.

Bitcoin (BTC/USD) Daily Chart Analysis For July 15, 2022Technical Analysis and Outlook:
Bitcoin is trading above $20,000, bouncing off our Key Sup $18,900. The coin is facing up-take to the Mean Res $22,350 mark. If all fails, the coin will take us to the retest of Key Sup $18,900 and #2 Outer Coin Dip $15,500 mark once again, and down we go to #2 Outer Coin Dip $15,500.
Bitcoin (BTC/USD) Daily Chart Analysis For July 8, 2022Technical Analysis and Outlook:
Bitcoin is trading under Mean Res $20,350 - the current path is to the downside revisiting our Key Sup $18,900 and completed Outer Coin Dip $18,665. The coin is facing take-down to the #2 Outer Coin Dip $15,500 mark.
Factors currently influencing the CHF and opportunitiesThe Swiss Franc has seen some crazy moves since April.
In the last quarter, we saw the CHF weaken on the onset of the Russian invasion. Then the SNB raised rates by whooping 50 bps for the first time in years. This led the Swiss government bond yields to spike with USDCHF weakened in days.
Since then, speculators have pulled back rate hike bets in the face of an economic growth slowdown in Europe. with the Swiss 2 year bond yields back below 0%.
So what does this mean for Swiss Franc crosses?
USDCHF
I expect the currency to weaken against the USD as traders bet that the Fed will maintain their tightening policy until inflation is below their 2% target.
AUDCHF
The RBA is also on a tightening cycle with the RBA expected to hike rates further to the end of 2022. In addition to this, the Australian economy seems to be resilient with data coming out of the country being strong. China's PBOC and CCP support for the economy is expected to provide support for the Aussie.
CADCHF
The oil linked Loonie is having support from higher energy prices and a BoC that is also on a rate hiking cycle.
Technically speaking, the pair has gone back above the 100Day moving average and I expect it to test the cluster resistance level 0.769xx from 2014-2019
Other pairs that are interesting are:
CHFJPY
Major risk to short-selling the pair is that bond yield differentials are expected to remain high hence JPY strength looks like a long shot for Q3
NZDJPY
Recovery of the Chinese economy is going to support the commodity-linked Kiwi. However, strength of the pair is not expected to be higher than that of the AUDCHF
Summary
CHF weakness brings a lot of opportunities. However, it's important to note that tailrisk to these trades exist. In the current environment, FX volatility is high and could wipe you out. Be safe out there

EURCHF breaks below parity. A further drop expectedThe last time this pair dropped below parity, investors chose the CHF over the Euro. However, the SNB was worried about the deflationary aspects of such a move and acted to reverse the move.
This time, the fundamentals are more or less the same or different depending on how you interpret it.
The Euro zone investors are worried about the block tipping into a recession due to high energy costs. In Germany, for example, regulators have warned that entire industries could come to a halt should Russia fail to reopen the Nordstream 1 pipeline gas flows. The Yamal pipeline has also seen huge drops in gas supplies.
With this in mind for Euro fundamentals, the question remains whether the SNB is going to do anything. A stronger CHF is definitely going to the reduce inflationary pressures for Switzerland.
In my opinion, I expect the pair to head lower toward the Jan '15 bottom.
Risks to trade
Historically, strong moves in one direction tend to reverse with similar momentum.
The EURO - SWISS bond yield spreads show that the downward move may not be sustainable since FX tends to move in lockstep to spreads
The SNB raised rates by a whooping 50bps for the first time in a long time. In typical fashion, Swiss bond yields jumped, some out of negative territory. However, the yields have retraced most of their earlier moves. This may imply that the markets are pricing that the SNB will not raise rates as much in the face of a recession in Europe.
This might reduce the strength of the CHF with weakness showing up in the USDCHF.
PS: I already have an open position ( This is not trading advice)
With that in consideration, I'll be short the Euro for Q3.

AUDJPY breaks 50 Day Moving averageThe pair has been pivoting to reverse May - June gains. The pair has been printing lower highs forming a descending triangle. A confirmation of the break on the daily timeframe will warrant a short-sale.
Fundamentally, the AUD is struggling in the face of a global economic slowdown. The currency, a bellwether for global risk sentiment, weakened after the RBA raised rates further to 1.35%. The commodity linked currency is falling as commodities prices dip in the face of a possible global recession.
The JPY safe-haven properties are starting to show up following risk-off sentiments as traders weigh in on recessionary fears making this the ideal pair to trade for the rest of the year.
Risks to this trade remain in the back of my mind. Australia, as opposed to other major economies, is doing a lot better. China's recovery could support the currency. Further inflationary economic releases could push global bond yield higher lifting the interest rate differentials the therefore the the pair.
Trade with caution

Bitcoin (BTC/USD) Daily Chart Analysis For July 1, 2022Technical Analysis and Outlook:
Bitcoin is trading at under $20,000 as it is waiting for oxygen therapy - with the possibility of making advancements to Mean Res $21,575 and a low probability additional rally to Mean Res of $22,670; currently sitting at our of Key Sup $18,900. The coin is facing take down to the #2 Outer Coin Dip $15,500 mark.
Bitcoin or BUTT-Coin :) SELLIf the red trendline is any good (with 30 years of being in the financial markets doing economieetrics / fundamentals and asset allocation), then we are in for major shockS / disappointments in teh financial markets in the coming quarters.
BUTT Coin is the posterboy of what is wrong with teh current financial system / CENTRAL bANBKETS / GEN X / GEN Z / MILLENIALS / Value of Money / etc.

Bitcoin (BTC/USD) Daily Chart Analysis For June 24, 2022Technical Analysis and Outlook:
Since the June 18th completion of our Outer Coin Dip of $18,665, the Bitcoin is advancing slowly to our Mean Res of $22,670; however, if all fails, the coin will take us to the retest of Key Sup $18,900 and #2 Outer Coin Dip $15,500 mark.

Bitcoin (BTC/USD) Daily Chart Analysis For June 17, 2022Technical Analysis and Outlook:
This week was marked by sharp declines and panic in the Bitcoin market. Bitcoin's trending price action hit our Outer Coin Dip at $18,665. With this primary path completed, upon verification (In progress), expect the rebound to Mean Res $22,670; however, if all fails, the coin will take us to the #2 Outer Coin Dip $15,500 mark.

Bitcoin (BTC/USD) Daily Chart Analysis For June 10, 2022Technical Analysis and Outlook:
Bitcoin's trending range continues to be intact: Key Res is $31,780, to Key Sup is $28,600. The primary path to completed the Outer Coin Dip $26,700 mark is ongoing.
