EUR/USD Daily Chart Analysis For June 3, 2022Technical Analysis and Outlook:
The Euro has created a new Mean Res 1.077 and Mean Sup 1.065.
The next strong resistance is in the 1.085mark. On the downside, the Mean Sup 1.056, Mean Sup 1.046, and Key Sup 1.038 are the primary targets - The ultimate Inner Currency Dip is marked at 1.031.
Macroeconomic Analysis And Trading Ideas

Bitcoin (BTC/USD) Daily Chart Analysis For June 3, 2022Technical Analysis and Outlook:
Bitcoin's narrow trending range extended. The new expended Mean Res is $31,780, and the current Key Sup is $28,600. The primary path is to completed the Outer Coin Dip $26,700 mark.

EUR/USD Daily Chart Analysis For May 27, 2022Technical Analysis and Outlook:
The Euro gained quite a bit over the trading week, breaking over our Key Res 1.062 price level. The next strong resistance is in the 1.08 area. On the downside, the Mean Sup 1.056, Mean Sup 1.045, and Key Sup 1.038 are the primary targets - The ultimate Inner Currency Dip is marked at 1.031.

Bitcoin (BTC/USD) Daily Chart Analysis For May 27, 2022Technical Analysis and Outlook:
Bitcoin's narrow trending range continues. Between our slightly expended Mean Res $31,300 Key Sup $28,600. The primary path is to completed the Outer Coin Dip $26,700 mark.

Bitcoin (BTC/USD) Daily Chart Analysis For May 20, 2022Technical Analysis and Outlook:
Bitcoin is trading within our Mean Res $31,100 key Sup $28,870. The primary path is designated to completed Outer Coin Dip $26,700.

SPX Forecast 22'-23' (Fibonacci Analysis)Notes:
Expecting financial markets to rally amid FOMC summer hikes.
Entering "Complacency" (June 06, 2022 - Feb 2023) in market cycle.
Entering "Anxiety" (Nov. 2022 - Oct. 2023) in market cycle.
Hedge Idea
(Long):
Entry Price: $3,923.00
Entry Date: June 06, 2022
Price Target: $4,500.00
Date Target: Nov. 2022
(Short):
Entry Price: $4,500.00
Entry Date: Feb. 06, 2023
Price Target: $3,600.00
Date Target: Oct. 2023

EU Forecast (Spectral & Fibonacci Analysis)Current Price: 1.04
Target Price: 0.99000
Target Date: Q4 2022 (6 month)

Henry Hub Natural Gas futures showing slowing momentumHenry Hub Natural Gas futures showing slowing momentum across the futures curve up to Jan 2024 ($NGF2024).
Recent geopolitical risks i.e. The Russian invasion of Ukraine, have pushed the prices of both spot and futures of commodities higher.
Natural Gas futures across the curve are tracking each other with a tighter spread till Jun 2023 implying that the market participants expect the prices to remain elevated for a longer time. However in the short-term, the price action shows an exhaustion by bulls forming a ranging pattern with a possibility of a reversal.
Central banks around the developed world highlighted in their Monetary Policy Statements this May that they expect energy prices to remain elevated for the next 18 months. I'll definitely be watching out for the impact of the policy tightening regime - which we are in now - to the demand side of the economy, and it's second-order effects on gas prices.

Bitcoin (BTC/USD) Daily Chart Analysis For May 13, 2022Technical Analysis and Outlook:
Bitcoin has completed Outer Coin Dip $26,700. The current path is designated between $26,700 and Mean Res $31,100.

Bitcoin (BTC/USD) Daily Chart Analysis For May 6, 2022Technical Analysis and Outlook:
Bitcoin is looking very bearish at this point. The current path is flagged to Inner Coin Dip $31,660 and Outer Coin Dip $30,800. A possible significant rebound is anticipated upon completion of Inner Coin Dip $31,660, while Key Sup $35,150 might offer transient upside movement.

Bitcoin (BTC/USD) Daily Chart Analysis For April 29, 2022Technical Analysis and Outlook:
Bitcoin is getting into a very narrow playing range and is inclined to a significant impulse move to Mean Res $41,500 after completing our Inner Coin Dip of $37,000.
EUR/USD Daily Chart Analysis For April 22, 2022After retesting Mean Res 1.089 first time followed through to Mean Res 1.093 was again retested. The stoppage occurred at a solid bottom marked Inner Currency Dip 1.077. A drop to Major Key Sup 1.069 and Next Inner Currency Dip 1.056 is inevitable - to some extent, bullish moves are possible within the current downtrend.

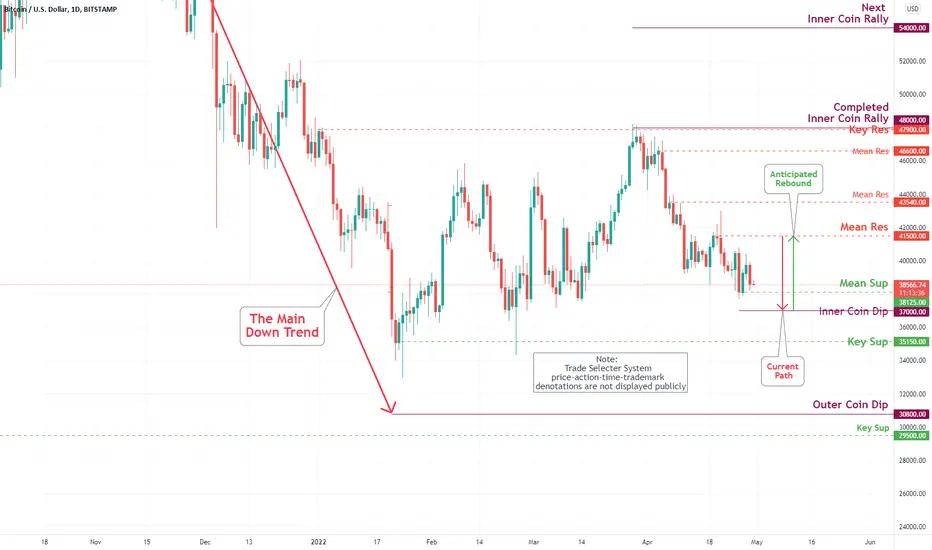
Bitcoin (BTC/USD) Daily Chart Analysis For April 22, 2022The bitcoin has completed Inner Coin Dip $39,000 as flagged on Daily Chart Analysis For April 15. The rebound is anticipated to Mean Res $41,550. Bearish activities are possible within this movement.

Bitcoin (BTC/USD) Daily Chart Analysis For April 15, 2022Technical Analysis and Outlook:
The bitcoin price experienced its most significant daily drop since February earlier this week and dipped below $40,000 on Monday, posting a low of $39,218; however, failing to fulfill our Inner Coin Dip 39,000 - the completion is anticipated. Bullish activities are possible within this movement.
Bitcoin Bear Market ScenarioFollowing macroeconomic environment, with inflation reporting this week followed by upcoming central bank FOMC meeting in early may (rate hikes & balance sheet reductions)... the following high-level SR zones are key levels to watch.
Assuming broader markets are going to experience a significant correction as the Fed loses ability to leverage QE & stimulus in propping up markets without hyperinflation risk, BTC as a risk-on asset will face significant headwinds.
Without a changing economic environment, the markets will continue to realize bearish sentiment with more speculative assets (tech stonks & "digital asset technologies") realizing the most severe of pullbacks.
FOMC in early May will attempt to reign inflation in, while June's FOMC meeting will include a more nuanced summary of economic projections given assessment of Q1 results as well as Q2 winding down.

Bitcoin Evening StarsBitcoin weekly has had two evening star candles in short period of time as the markets grapple with sharply rising prices, declining sales, and a massive labor shortage.
Markets are beginning to price in rate hikes, but have yet to entertain the implications of rampant, widespread inflation or the reality of an aging population with low and continuing lower birthrates.
As central banks look to regime change via rate hikes and divesting bloated balance sheets, the economy is in for a significant slow down and the markets will realize major retracement.
Bond yields, durable goods sales, home sales, inflationary measures... all point to a full market reversal.
BTC price action will continue lower as bearish sentiment settles in and speculative risk-on behaviors curtail.

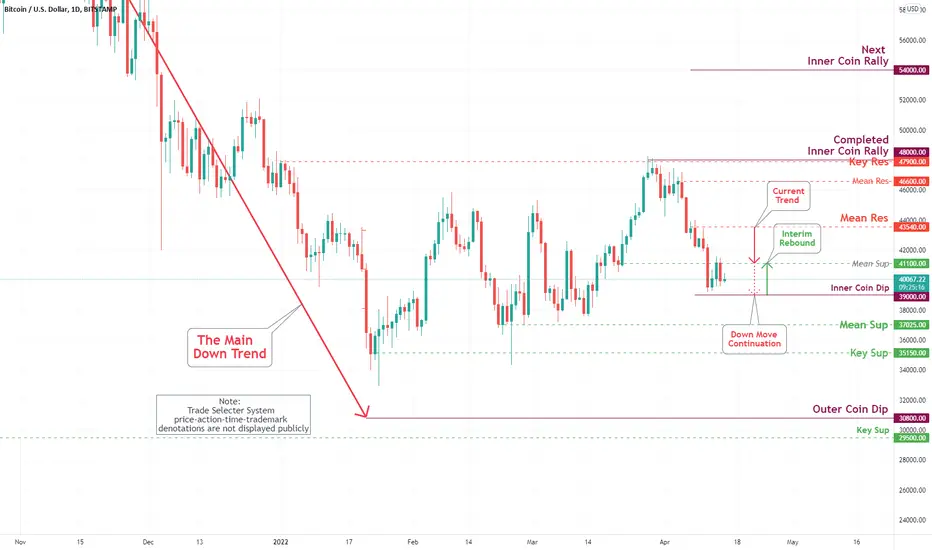
Bitcoin (BTC/USD) Daily Chart Analysis For April 8, 2022Technical Analysis and Outlook:
After embarking on a Key Res at $47,900 retest this month, Bitcoin has punctured coin sentiment by sliding into a direction to Mean Sup $41,100. After follow-thru to Inner Coin Dip, $39,000 is a high probability. Interim rebound to Mean Res $43,540 is also in play.

Risk: On or Off? Gold & BitcoinBitcoin has been touted as "digital gold" and even as an "inflation hedge."
When you compare BTC to Gold with long-term channels, the Bitcoin chart does look to mirror Gold at approx 15.6:1 timeframes... at least until recently.
Bitcoin's creation coincides with the biggest regime change since the USD was disassociated w/ Gold in the early 1970's, its entire existence has been under a dovish monetary environment that encourages risk-on behavior w/ unfettered government intervention into the markets w/ Quantitative Easing.
This loose policy has kept markets propped up since the housing market bubble burst. Unfortunately, the March 2020 pandemic response with global economies being halted resulted in unfettered stimulus and bloated Central Bank balance sheets resulting in the appearance of rampant, widespread, persistent inflation.
Central Banks are now at a crossroads, continue QE and a dovish policy regime that will exacerbate inflationary price pressures or reverse course.
Course reversal as bond yields increase is achieved by raising rate while central banks reduce $9 Trillion in assets.
This regime results in risk-off behaviors, apparently causing Gold:Bitcoin chart correlation to disassociate.
Given current market response, expect Gold to realize positive PA while Bitcoin is challenged by sell pressure while monetary policies tighten.

Apple Overvaluation RiskAsset/equity valuations at extreme highs, clearly aligned with sharp price increases reflected in core inflation.
Apple Valuations:
PE 28.3x to Industry 15.6x & Market 16.8x
PB 39.5x to Industry 1.4x & Market 1.9x
PEG 7x
All supported by dramatically high central bank balance sheets.
Trendline with unsustainable rising prices reflecting an unhealthy dovish monetary policy where quantitative easing has propped up institutions and corporations at the expense of individuals, wages have not kept up and debt propagation has reached a culmination point.
Major risk of total market correction on the horizon and the Federal Reserve regime will be forced to shift to a significantly more hawkish stance.
Without a "Volker-esque" approach, a wage-price spiral will begin as runaway inflation strains consumers and the central banks are forced to re-evaluate their actions.

JGB 10y vs US 10yJGB 10y vs US 10y
the ten year Japanese bond moves in lock step wiht the US ten year since Bank of Japan has implemented yield curve control

Euro Zone inflation at record highs!This is a big issue for the ECB, and they're very much between a rock and a hard place.
For years the bank has kept policy extremely easy, and the economy has largely become used to this.
However, they are now facing an inflation backdrop that ironically, they probably could only dream of 10 years ago (OK maybe not as high as it currently is, but you get the point).
So what do they do from here?
Just now, ECB's Philip Lane said, 'today's inflation number is very high.'
Clearly then, there is a hawkish pivot occurring in the ECB.
And we can see that the market has been pricing *some* hawkishness since the start of the year, if we look at EURIBOR futures...
EUREX:FEU31!
And the current market implied data suggests that the ECB are set to embark on a hiking cycle.
In picture 1, we can see the Euro Area 1wk refi rate, which suggests that by September, at least a 25bp hike is priced in...
Well, that is simply way too late, so think the odds will have been frontloaded way more now.
In chart 2, we can see the overall policy path, which suggests that the ECB will reach a rate of 1.00% by 2024.
And in chart 3, we can see how likely behind the curve the ECB is, especially with today's inflation prints...
There's likely a trade in here then.
If the market is expecting rate hikes further out, but they actually happen sooner, it's likely that European risk assets will be hit, specifically credit and their corresponding spreads.
This would have a knock on effect to equities.
Higher refinancing rates mean tighter margins.
So pay attention to the ECB going forward, since they have the greatest relative policy pivot from historical out of all
central banks!

EUR/USD Daily Chart Analysis For March 25, 2022Technical Analysis and Outlook:
After the retest of our Mean Res 1.1090, the Eurodollar continues its journey down as projected in March 18 chart to Mean Sup 1.0900. The completed Inner Currency Dip 1.0820 is the latest extension - some bullish moves are possible within the current downtrend.

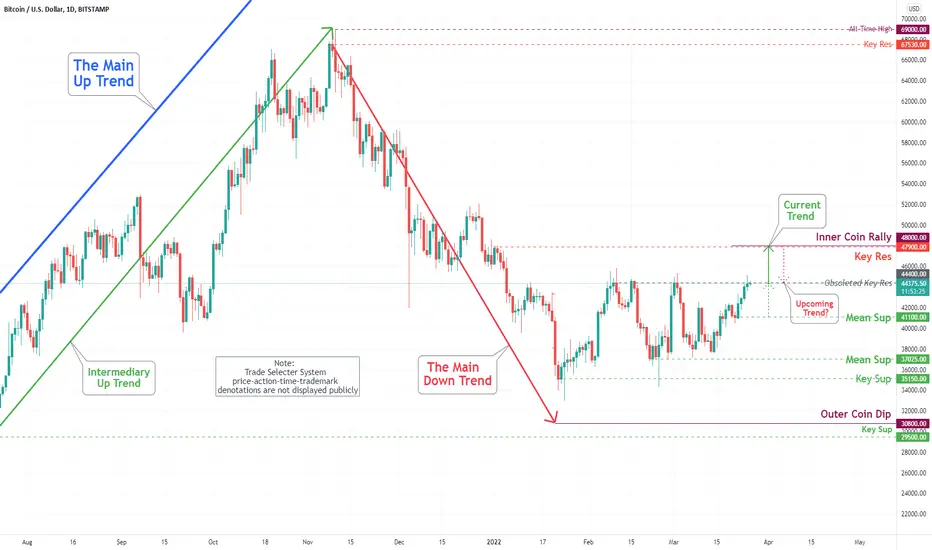
Bitcoin (BTC/USD) Daily Chart Analysis For March 25, 2022Technical Analysis and Outlook:
On Friday's session, the coin briefly traded above our Key Res $44,400 and obsoleted: a significant psychological price level, and continuously pushing to Key Res $47,900 and Inner Coin Rally $49,000.