The RBA just made a small (but big) change to their statementThe RBA held rates at 4.35% as expected, but there were several changes to their December statement which warrant a closer look. I highlight the key differences to the November statement and provide my interpretation of what it means for the RBA's policy as we head into next year, then look at AUD/USD.
MS
Macroeconomic Analysis And Trading Ideas

Bitcoin(BTC/USD) Daily Chart Analysis For Week of Dec 6, 2024Technical Analysis and Outlook:
Bitcoin displayed substantial volatility during this week’s trading sessions, reaching our Mean Support level of 91800 and completing our Inner Coin Rally of 103600. Currently, the threshold for Bitcoin is established at Mean Support 96000, with the completion of the Inner Coin Rally 103600 now noted. Recent analyses indicate that the cryptocurrency will likely surpass the completed Inner Coin Rally 103600, which may rekindle its upward trajectory towards the anticipated Outer #1 Coin Rally 110000 and beyond. The possible pullback to Mean Support 96000 will effectively position the market for the next phase of a bullish trend.

Bitcoin(BTC/USD) Daily Chart Analysis For Week of Nov 29, 2024Technical Analysis and Outlook:
Bitcoin has significantly declined below our Mean Support level of 94400. Nevertheless, the momentum of the bull market has been a pivotal factor, allowing Bitcoin to rebound robustly and heading to retest the established Outer Coin Rally target 99500. Current analysis indicates that the cryptocurrency is poised to surpass the 99500 threshold, consequently reigniting its upward trajectory towards the forthcoming Outer Coin Rally target at 110000. The pullback to Mean Support 95600 and possibly to 91800 is strategically positioning the market for the next phase of the bullish trend.

Bitcoin(BTC/USD) Daily Chart Analysis For Week of Nov 22, 2024Technical Analysis and Outlook:
The price of Bitcoin, which remained at or below the completed Outer Coin Rally of 92000 during the preceding week, has successfully broken through this level this week, thus completing our Outer Coin Rally of 99500. The current analysis indicates that the cryptocurrency coin will likely experience a retracement to the Mean Support level of 94400 before embarking on its subsequent bullish trajectory, targeting our forthcoming Outer Coin Rally at 110000. This development signifies the conceivable continuation of a sustained bull market.

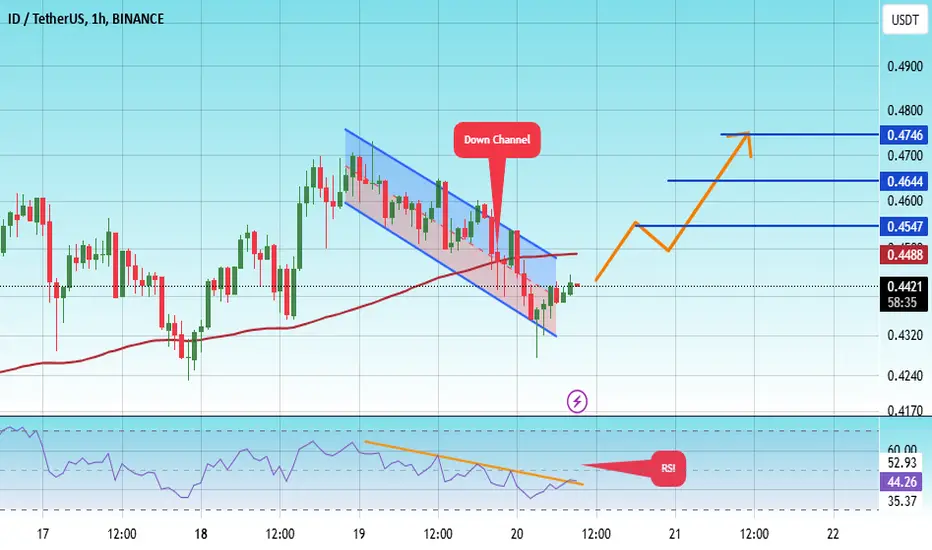
#ID/USDT Ready to go up#ID
The price is moving in a descending channel on the 1-hour frame and sticking to it well
We have a bounce from the lower limit of the descending channel, this support is at 0.4320
We have a downtrend, the RSI indicator is about to break, which supports the rise
We have a trend to stabilize above the moving average 100
Entry price 0.4428
First target 0.4547
Second target 0.4644
Third target 0.4746
Bitcoin(BTC/USD) Daily Chart Analysis For Week of Nov 15, 2024Technical Analysis and Outlook:
According to my analysis of Bitcoin, as I have previously forecasted for Aeon, Bitcoin achieved the target of $92,000 in the past week. Although it has since retraced to the Mean Support level of $86,500, Bitcoin is currently at the top, regaining momentum, and is projected to hit the Outer Coin Rally of $99,500 and a subsequent target of $110,000. Currently, wwe are hovering near the $100,000 threshold, which indicates the commencement of a significant bull market. It is essential to acknowledge that this journey has been lengthy and demanding, and further volatility is anticipated. Nevertheless, patience will likely yield substantial rewards for those who have remained committed thus far. Recognizing that reaching these targets in all probability will trigger selling pressure is crucial.

Bitcoin(BTC/USD) Daily Chart Analysis For Week of Nov 8, 2024Technical Analysis and Outlook:
According to the analysis of the Bitcoin daily chart for November 1, the "Interim Rebound" in Bitcoin has effectively concluded its second stage. This stage occupies the mid-zone of the rally's rebound extension, with the primary target being the Inner Coin Rally mark at 78,500. This movement corresponds with the Outer Coin Rally 81000 and the Main Outer Coin Rally 92000, as projected by TSS in their long-term bullish forecast. However, a potential pullback is anticipated to fulfil the Reignited and Primary rebound criteria.

Bitcoin(BTC/USD) Daily Chart Analysis For Week of Nov 1, 2024Technical Analysis and Outlook:
According to the analysis of the Bitcoin Daily Chart for October 25, the "Interim Rebound" in Bitcoin has successfully concluded the Main Inner Coin Rally at 73300. It has subsequently retraced to the support level of 69400. This level represents the inverse of the previously completed Inner Coin Rally at 69400. We anticipate initiating a primary rebound, which is expected to support a recovery that will retest the Key Resistance at 73200. This movement will align with the completion of the Main Inner Coin Rally at 73300 and may lead to further progression into the next phase of the bullish trend, designated as the Next Inner Coin Rally at 78500 and beyond. Conversely, we project a potential additional pullback to satisfy the criteria of the newly established Inner Coin Dip at 66200.

Bitcoin(BTC/USD) Daily Chart Analysis For Week of Oct 25, 2024Technical Analysis and Outlook:
As stated in the Bitcoin Daily Chart Analysis For the Week of Oct 18, the Bitcoin ''Interim Rebound'' completed our Inner Coin Rally of 69300 and retreated to the Mean Support level of 66800 and interim squeeze extension of the Mean Support of 65300 in this week's trading session. Currently, we anticipate the onset of a primary rebound, which is expected to facilitate recovery and further advancement into the subsequent phase of the bullish trend.

Eyes on BOE Gov speech It seems that a head and shoulders pattern is forming. If the speech by the Governor of the Bank of England regarding GBP suggests any acceleration in rate cuts, then we should definitely expect the completion of the head and shoulders pattern for this currency pair. In just a few minutes, we will be ready to trade this pair.

The History of Global Net Liquidity RhymesThe History of Global Net Liquidity Rhymes
Descending wedge pattern leading up to 2020 vs the one forming now.

Bitcoin(BTC/USD) Daily Chart Analysis For Week of Oct 18, 2024Technical Analysis and Outlook:
The Bitcoin ''Interim Rebound'' rammed through our Mean Res 66300 and Inner Coin Rally 67000 and rested at our Mean Res 68500 in this week's trading session, and it is currently poised to hit Inner Coin Rally 69300. A breach of this critical price level will catalyze a movement towards the all-time prices marked as Key Res 73200 and the completed Main Inner Coin Rally 73300. However, on the downside, the interim bearish sentiment may lead to a decline in the coin's price value to the Mean Support level of 66800 and possibly the Mean Support of 65300. Only then will the primary recovery and advancement into the subsequent phase of the bullish movement be realized.

Bitcoin(BTC/USD) Daily Chart Analysis For Week of Oct 11, 2024Technical Analysis and Outlook:
The Bitcoin "Interim Squeeze" channel underwent retesting during this week's trading session. It exhibited upward movement to Mean Res 64000 and subsequent downward movement to Mean Sup 60200, and it is currently poised to return to Mean Res 64000. A breach of this critical resistance level will catalyze a movement towards the Inner Coin Rally 67000 target, accompanied by further upward momentum, with the primary objective being the subsequent Inner Coin Rally identified at 69300. However, failure to achieve this rally will result in a downside interim bearish sentiment, leading to a decline in the coin's price to the Mean Support level of 58000 and possibly an Inner Coin Dip of 55500. Only then will the primary recovery and advancement into the subsequent phase of the bullish movement be realized.

Bitcoin(BTC/USD) Daily Chart Analysis For Week of Oct 4, 2024Technical Analysis and Outlook:
The "Interim Squeeze" of Bitcoin has witnessed a significant decline to our Mean Support levels at 64400 and 63100, as well as the newly established 60200. On the upside, the cryptocurrency is approaching the critical Mean Resistance level of 64000. A breach of this pivotal level will trigger the movement to the Inner Coin Rally 67000 target, accompanied by further upward momentum, with the primary objective being the subsequent Inner Coin Rally identified at 69300. Nevertheless, the prevailing market interim bearish sentiment anticipates a drop to the Mean Support level at 58000, with the potential for an extension to the Inner Coin Dip 55500 before initiating the primary recovery and progressing into the subsequent phase of the bullish movement.

$EUIRYY -CPI (September/2024)ECONOMICS:EUIRYY (Eurozone Inflation Data; September/2024)
source: EUROSTAT
- Annual inflation rate in the Eurozone fell to 1.8% in September 2024, the lowest since April 2021, compared to 2.2% in August and forecasts of 1.9%, preliminary estimates showed.
Inflation is now below the ECB target of 2%.
Prices fell much more for energy (-6% vs -3%) and inflation slowed for services (4% vs 4.1%) while prices for food, alcohol and tobacco increased slightly more (2.4% vs 2.3%).
Meanwhile, core inflation rate also eased to 2.7% from 2.8%.
Among the bloc's largest economies, inflation slowed in Germany (1.8% vs 2%), France (1.5% vs 2.2%), Italy (0.8% vs 1.2%), Spain (1.7% vs 2.4%).
The ECB expects inflation to rise again in the latter part of 2024, partly because previous sharp falls in energy prices will drop out of the annual rates.
Inflation should then decline towards 2% over the second half of 2025.

Bitcoin(BTC/USD) Daily Chart Analysis For Week of Sep 27, 2024Technical Analysis and Outlook:
During the recent weekly market activity, Bitcoin surpassed the completed Interim Coin Rally at 64900 but encountered resistance before reaching the subsequent significant target, which was noted at 67000. However, the prevailing market sentiment suggests a potential retracement to the Mean Support level at 64400, with the possibility of an extension before commencing the primary recovery and advancing into the subsequent phase of the bullish movement.

Bitcoin(BTC/USD) Daily Chart Analysis For Week of Sep 20, 2024Technical Analysis and Outlook:
The current market activity exhibits a robust recovery from our Mean Support level at 57300, surpassing the Mean Resistance of 60500. It is poised to achieve our secondary rebound target: the Completed Interim Coin Rally denoted at 64500. Nonetheless, prevailing market sentiment suggests a potential retracement to the Mean Support level at 61900 before initiating the primary recovery and progressing into the subsequent phase to retest our completed Interim Coin Rally at 64900 and beyond.

Bitcoin(BTC/USD) Daily Chart Analysis For Week of Sep 13, 2024Technical Analysis and Outlook:
The recent market activity demonstrated a resilient rebound from our Key Support level at 53000, surpassing the Mean Resistance levels at 56700 and 59700 and peaking at the newly established Mean Resistance level at 60500. Current market sentiment indicates a potential retracement to the Mean Support level at 57300 before initiating the primary rekindled rebound and progressing into the second phase to retest our completed Interim Coin Rally at 64900.

Bitcoin(BTC/USD) Daily Chart Analysis For Week of Sep 6, 2024Technical Analysis and Outlook:
The recent market activity witnessed a continued decline in the value of Bitcoin, leading to a significant drop and triggering a shift to our designated Key Support level of 54000. Current market sentiment indicates a potential recovery towards Mean Resistance 56700, possibly extending to Mean Resistance 59200. It is pertinent to acknowledge that persistent selling pressure at this stage could precipitate a further down towards the previously completed Interim Coin Dip 50000 before a resurgence occurs.

Bitcoin(BTC/USD) Daily Chart Analysis For Week of Aug 30, 2024Technical Analysis and Outlook:
The "Primary Squeeze" of Bitcoin has experienced a significant drop to our Mean Support levels at 62700 and 60300, and it currently hovers just above the critical Mean Support level at 57600. Currently, the cryptocurrency is positioned for further upward movement, with the primary target being a retest of the completed Interim Coin Rally marked at 64900. It is noteworthy that the selling pressure at this level may lead to a decline in the coin's price towards the Key Support level at 54000.

Bitcoin(BTC/USD) Daily Chart Analysis For Week of Aug 23, 2024Technical Analysis and Outlook:
Bitcoin has surpassed our Mean Resistance of 61700 and completed Interim Coin Rally 62200, finishing extended Interim Coin Rally 64900. Presently, the coin is positioned for further upward movement with a primary target of 68500 and a retest of our completed Main Inner Coin Rally 73200. The selling pressure at this level may cause the coin's price to decline toward the Mean Support level of 56600, possibly extending to the Mean Support level of 60300.

Will Gold Hit $3,000 with Fed Rate Cuts and Geopolitical Risks?Gold has outperformed the broader U.S. stock market this year, with analysts predicting further gains as the Federal Reserve nears rate cuts. Gold surged to a new record high of over $2,500 per ounce, and some experts forecast it could reach $3,000 next year. Key drivers include potential Fed easing, geopolitical uncertainties, and increased demand from central banks diversifying away from the U.S. dollar. As interest rates decline, gold’s appeal as a safe-haven asset continues to grow.

Bitcoin(BTC/USD) Daily Chart Analysis For Week of Aug 16, 2024Technical Analysis and Outlook:
During this week's trading, Bitcoin underwent a retest of our Mean Resistance level of 61700 and, subsequently, the Mean Support level of 57400, marking the completion of the Interim Coin Rally at 62600. The presence of intermediary selling pressure may lead to a decline in the coin's price action toward the Mean Support level of 56600, 54000 and potentially result in a retesting of the completed Interim Coin Dip at 50000. On the positive side, the overall trend remains optimistic, with a focus on retesting the completed Interim Coin Rally at 62600 and potential extensions to the Mean Resistance levels of 65500 and 68500, respectively.
