Bitcoin(BTC/USD) Daily Chart Analysis For Week of March 22, 2024Technical Analysis and Outlook:
Bitcoin has dropped significantly from a Mean Sup of 65900 to a Mean Sup of 61300, where it is currently gyrating. The upcoming retest of the Mean Sup of 68400 will be crucial for continuing the bull run. However, before the bull run takes place, the coin might retest Mean Sup 61300 and, in the process, complete Outer Coin Dip 57200.
Macroeconomic Analysis And Trading Ideas

Bitcoin(BTC/USD) Daily Chart Analysis For Week of March 15, 2024Technical Analysis and Outlook:
Bitcoin has reached our target, the Inner Coin Rally 72500. It has since dropped significantly and is now hovering around the newly established Mean Sup of 65900. The upcoming retest of the Mean Sup of 65900 will serve as a crucial point for continuing the ongoing bull run, which aims to achieve two more targets: the Inner Coin Rally 78200 and the Outer Coin Rally 81400.

Bitcoin(BTC/USD) Daily Chart Analysis For Week of March 8, 2024Technical Analysis and Outlook:
Bitcoin's price has risen this week, surpassing Major Key Resistance 67530 and the all-time high of 69000. Its ongoing targets are the Inner Coin Rally 72500, the Next Inner Coin Rally 78200, and the Outer Coin Rally 81400. A slight dip to the Mean Sup at the 63800 price is expected before the next rally. Despite the increasing acceptance and rise in investor interest, the cryptocurrency Bitcoin remains subject to volatility and market fluctuations. As such, it is imperative to maintain rigorous vigilance over its price movements and market trends to make informed investment decisions.

Bitcoin(BTC/USD) Daily Chart Analysis For Week of March 1, 2024Technical Analysis and Outlook:
Bitcoin's price action saw a remarkable surge in the current week, which should not come as a surprise to this audience. After breaking through the completed Outer Coin Rally at 53000, Bitcoin's legit targets were 55000 and 59829, as this would. Bitcoin is setting itself up for the next launch, the Inner Coin Rally at 69000 and the Outer Coin Rally at 81400, which is expected to break records and disappoint those who have dismissed cryptocurrencies.
However, a pullback to the Mean Sup at the 60400 price is a transient dip before the next rally. Nevertheless, the overall outlook for Bitcoin remains promising as it continues to attract more investors and gain wider acceptance. Therefore, it is crucial to keep a close eye on Bitcoin's price movements and market trends.

Bitcoin(BTC/USD) Daily Chart Analysis For Week of Feb 16, 2024Technical Analysis and Outlook:
The chart analysis on February 9th shows how powerful the Trade Selector System is to this Trading View platform. Bitcoin has completed the second phase of the reignited rebound extension phase, also known as the "Outer Coin Rally 53000". Currently, this analysis shows the downside price action is in pivotal squeeze mode; it is expected to rebound and retest Mean Res 52500. Moreover, completing the Outer Coin Rally 53000 from this spot is imminent.

Central bank of india Buy this gem for long term and short term profit
Log term target will be double

European Central Bank is holding rates untill Q3 Market Insight:
ECB policymaker Francois Villeroy de Galhau has emphasized that the decision on rate cuts in 2024 will be data-driven, rejecting a fixed timeline. ECB President Christine Lagarde, while suggesting a potential rate cut in the summer, emphasizes the importance of data in timing the decision. Central bank officials are cautious about immediate easing but acknowledge a long-term trajectory of lowering borrowing costs.
Rationale:
Anticipating the likelihood of a delayed rate cut by the European Central Bank (ECB), potentially impacting businesses' cost of borrowing and consumer spending, which could lead to lower revenues for companies in the European stock index.
Trade Strategy:
Short Position on European Stock Index: Consider initiating a short position in the European stock index (e.g., Euro Stoxx 50).
Entry Point: Look for technical signals indicating a reversal or weakness in the index.
Stop-Loss: Place above a recent significant peak to manage potential upward movements.
Take-Profit: Target the next support level, considering potential downward pressure on index components.

Euro to propel on relapsing EU inflation & US jobs dataFighting inflation is hard. Hence, central banks are data dependent while calibrating rates. Continuing geopolitical conflicts puts Europe at risk of inflation relapse.
Headline numbers can be misleading. Central bankers will dig deep. Deeper analysis will compel investors and policy makers to rethink and recalibrate interest rate calculus.
This paper unpacks US jobs & Euro area inflation report, and market expectations of rates ahead.
UNPACKING US NON-FARM PAYROLL DATA
The US labour market added 216k jobs in December 2023 surpassing expectations. It was up 25% month-on-month.
Headline numbers look healthy. Details spell trouble. Payroll data was revised lower by 71k for October and November. Average work week contracted, and participation rate declined.
Jobs growth is concentrated in three sectors, namely, Government, Education/healthcare, and Leisure/Hospitality. Eighty percent of the jobs added are from sectors that are not considered growth engines.
Three key takeaways from jobs report:
1. Employment growth remains robust: Month-on-Month employment trends point to jobs growth in government, leisure and hospitality, health care, social assistance, and construction, while transportation and warehousing lost jobs.
On a 12-month seasonally adjusted basis, apart from (a) Transportation & Warehousing and (b) Information, rest of the sectors added jobs.
Source: BLS
2. Hourly Wage Earnings growth is strong: In December, average hourly earnings on private payrolls jumped by fifteen cents, or 0.4%, to USD 34.27/hour. Average hourly earnings have increased by 4.1% over the last year.
Source: BLS
3. Unemployment Remains Unchanged: Unemployment rate was unchanged at 3.7% (3.5% last year this time) with number of unemployed persons unchanged at 6.3 million (5.7 million last year this time).
COMPREHENDING EUROZONE INFLATION NUMBERS
Euro area inflation rose 2.9% YoY in December 2023, reversing a two-year low (2.4%) observed in November. Eurostat inflation estimates was marginally below the market consensus of 3%. Inflation uptick since April 2023 was primarily due to energy-related base effects.
Energy prices declined 6.7% while services inflation was flat. Core inflation, excluding food and energy prices, softened to 3.4%. Core inflation is at its lowest point since March 2022.
MARKET EXPECTATIONS OF RATE CUTS
Investors are betting that the US Fed and the ECB will cut rates six times this year. First rate cut is expected in March or April.
Market expectations are in sharp contrast to policymakers. The US Fed expects to make three quarter-point cuts this year. The ECB has stood its ground arguing that the inflation fight is not over yet.
Amid strong economic data, probability of Fed rate cuts in March has fallen from 100% to 70%.
Source: CME Fedwatch Tool
EUR-USD WITNESSED WILD MOVES ON INFLATION, JOBS, AND SERVICES DATA BUT SETTLED WHERE IT OPENED
Last Friday news flow impacting FX rates were strong. Front month EUR-USD futures traded wildly opening at 1.0977 reaching a high of 1.1030 and then plunging to a low of 1.0908 before closing at 1.0977.
December US ISM Services PMI unexpectedly fell to 50.6, the lowest reading in seven months, compared to 52.7 in November. Services industry is critical accounting for more than two-thirds of the US economy.
Euro fell 0.5% last week, marking its largest weekly drop since early December breaking three consecutive weeks of strengthening.
The EUR-USD is hovering at its support levels with the 50d DMA likely to print a golden cross with the 200d DMA.
Near term technical signals point to strengthening of the Euro versus the US dollar. Momentum favours Euro while price reversion risk remains neutral.
Diverging macroeconomic conditions leaves Eurozone exposed to higher risk of inflation relapse. The ECB is expected to be slower with rate cuts relative to the Fed. In anticipation, leveraged funds are starting to sharply reduce their net short positions in the CME EUR/USD futures.
Source: CME QuikStrike
HYPOTHETICAL TRADE SETUP
Europe is at greater risk of inflation relapse on continuing geopolitical risks in Russia-Ukraine and the middle east. Energy and goods inflation relapse will force the ECB to defer its rate cuts.
Size of the rate cuts, if any, is also likely to be smaller at the ECB relative to the Fed. This will strengthen the Euro against the USD in the near term.
To harvest gains from a strengthening Euro, this paper posits a hypothetical long position in CME Micro EUR/USD Futures expiring in March 2024 (M6EH2024) with an entry at 1.0979 combined with a target at 1.1123 and hedged by a stop at 1.0871, delivering an expected reward-to-risk ratio of 1.33x.
Each lot of CME Micro Euro Futures contract provides exposure to 12,500 Euros. It is quoted in USD per Euro increment. Each pip i.e., 0.0001 per Euro delivers a P&L of USD 1.25.
• Entry: 1.0979
• Target: 1.1123
• Stop: 1.0871
• Profit at Target (hypothetical): USD 180 (= 0.0144; 144 pips; 144 x 1.25 = 180)
• Loss at Stop (hypothetical): USD 135 (= -0.0108; -108 pips; -108 x 1.25 = -135)
• Reward-to-Risk (hypothetical): 1.33x
MARKET DATA
CME Real-time Market Data helps identify trading set-ups and express market views better. If you have futures in your trading portfolio, you can check out on CME Group data plans available that suit your trading needs www.tradingview.com
DISCLAIMER
This case study is for educational purposes only and does not constitute investment recommendations or advice. Nor are they used to promote any specific products, or services.
Trading or investment ideas cited here are for illustration only, as an integral part of a case study to demonstrate the fundamental concepts in risk management or trading under the market scenarios being discussed. Please read the FULL DISCLAIMER the link to which is provided in our profile description.

Better labour market is not equal better indices this time S&PFollowing last week's release of stronger-than-expected economic data, investors are recalibrating their expectations concerning aggressive Federal Reserve (Fed) rate cuts. The market sentiment is shifting, with investors scaling back their anticipation of imminent rate cuts. This change in perception is amplified by the surge in bond yields, indicating a rising consensus among institutional traders to build short positions.
The rationale behind these actions lies in the growing belief that the Fed might maintain its current restrictive policy stance for a longer duration than initially anticipated. This shift is underpinned by the robust health of the labor market, as evidenced by declining unemployment rates, diminishing jobless claims, and notably higher Non-Farm Payrolls reported last week.
The entry level aligns favorably for execution, especially just before the commencement of the London session. Two Take Profit (TP) levels have been identified for this trade. The initial TP is strategically positioned at the upcoming 4-hour (4H) support zone, reflecting a prudent approach to secure early gains.
For a more assertive yet realistic approach, the second TP is set at the 200-day Moving Average (200MA) on the Daily time frame (TF). Historical backtesting indicates a tendency for the market to approach or touch the 200MA during anticipated drops similar to the current market scenario. This second TP level, although more aggressive, presents a viable opportunity based on historical trends.
Comment your opinion below
.
.
.

Central Bank Of India Breakout Level 51.2Central Bank Of India make a breakout and also retest is also done
Above 51.2 central bank of india will go for a test of new levels i.e approx 100-110
Increase in volume seen

Dollar Index PivotBetting against the dollar is growing in popularity after the Federal Reserve upended markets by signaling the end of its monetary tightening campaign.
Non-commercial traders — a group that includes hedge funds, asset managers and other speculative market players — boosted their bearish bets on the greenback in the week ended Tuesday. More than 39,000 contracts are now tied to expectations the US currency will fall, up more than 10,000 from a week ago when the Fed was preparing to meet, the data show. The currency has suffered a pronounced slump in the wake of that confab, when the Fed released updated economic projections forecasting additional monetary easing next year. Indeed, while there are now more contracts betting on dollar weakness, the dollar value of those contracts has actually slipped to $5.5 billion, slightly lower than last week.
The dollar extended its drop on Friday after the Fed’s preferred gauge of underlying inflation showed muted price gains, affirming the central bank’s pivot toward interest-rate cuts next year.
What is your opinion on Dollar in 2024?
Trade with care
Like | Share | Comment

FX Price Action Ahead on Growing Rate DivergenceLast week was busy for major central banks. During a 60-hour window, rates were set for 60% of the global economy, from the US Fed, the ECB, to the BoE.
Central banks’ announcements caused a frenzy in markets. The pivot to a dovish stance by the US Fed contrasted sharply with hawkishness from the ECB.
This paper summarizes rate announcements and their market impact. It also dives into Yen dynamics as the Bank of Japan (BoJ) meets tomorrow.
CAUTION FX TRADERS: GROWING RATE DIVERGENCE AHEAD
Renewed divergence in monetary policies was evident from rate announcements by the major central banks. After more than a year of moving in tandem, central banks’ stances are shifting. The Fed is signaling rate cuts sooner. Meanwhile, ECB and BoE insist that rates need to stay higher for longer to fight sticky inflation.
As interest rates in the US remain elevated relative to other major economies, the Fed has ample room to slash sooner.
Inflation in the EU has contracted at a rapid clip relative to the US. However, economists expect EU inflation to rebound in the near term with fading base-level effects.
Inflation in the US is expected to average 2.4% in 2024 compared to 2.7% in the EU and 3.75% in the UK, as per respective central banks.
The US economy is strong with robust economic growth, resilient consumer spending, and solid PMI numbers.
FED HAS PIVOTED TO DOVISHNESS
The FOMC opted to keep rates steady with their statement pointing to the end of the rate hiking cycle. Most notable was the Fed’s updated economic projections & dot plot. It showed faster-declining inflation, slower GDP growth, and faster rate cuts.
The Fed’s dot plot of rate expectations guided towards three 25 basis point (bps) cuts next year. Markets were expecting five rate cuts before the Fed announcement. Following the Fed meeting, markets now anticipate six rate cuts.
BOE REMAINS HAWKISH
The Bank of England opted to keep rates steady with a hawkish pause. The BoE statement indicates further rate hikes if inflationary pressures remain persistent.
“The full effect of higher interest rates has yet to come through, posing ongoing challenges to households, businesses and governments," ~ BoE Market Policy Committee
ECB JOINED THE BOE WITH A HAWKISH PAUSE
ECB decided to keep rates steady with a hawkish pause. ECB President Christine Lagarde asserted that rate cuts were not being discussed yet and rates may even need to go higher to bring inflation under control.
ECB noted that tighter financing conditions were leading to demand contraction, which weighed on pushing down inflation. Economic growth is expected to remain subdued. ECB estimates gradual ramp up in growth from 0.6% for 2023 to 0.8% for 2024, and to 1.5% for both 2025 and 2026.
BOJ DECISION IS MOST UNCERTAIN WITH A THORNY JOB ON HAND
The Bank of Japan (BoJ) is set to announce their rate decision on December 19th. It has maintained ultra-low interest rates all year while others hiked aggressively.
Recent statements by BoJ Governor Ueda signal a pivot away from the ultra-low policy.
"Managing monetary policy will become even more challenging from the end of the year and heading into next year." ~ Kazuo Ueda, Governor, Bank of Japan on 6/Dec
Governor Ueda’s statements have led to market expectation of upcoming monetary tightening in Japan. JPY has strengthened 6% relative to the USD over the last month.
Despite Ueda’s statements, BoJ pivot remains uncertain. Inflation in Japan is running hot and above US inflation. Moreover, wage growth and economic growth in Japan have been moderate despite high inflation creating stagflation risks.
Consumer spending and wage growth remain muted despite record profits. Feeble Yen is boosting Japanese exporter profits.
Nevertheless, the BoJ has been setting up a change in monetary policy. Earlier this year, it raised the cap on JGB yields and eventually changed the cap from a rigid limit to a loose reference. Some economists consider this a prelude to eventual scrapping of the YCC altogether.
CENTRAL BANK DECISIONS HAVE CREATED DEEP RIPPLES ACROSS MARKETS
Commodity markets reacted positively to the rate announcements. The Fed’s signal of upcoming easing opened the door for commodity demand to rise.
Precious metals are likely to benefit from asset rotation out of US treasuries while Crude will benefit from higher economic activity from lower interest rates.
Equities surged on Fed pivot. Small-caps and Mid-caps outperformed the Nasdaq-100 and S&P 500. Both SPX and NDX also extended gains.
Bond yields fell sharply following the FOMC decision. Yields fell to their lowest level in four months. One-year bond yields performed the best while thirty-year performed the worst.
LEVERAGED FUNDS ARE BULLISH EURO, STERLING, AND BEARISH YEN
Asset managers and leveraged funds are net long on Euro FX futures. Asset managers and leveraged funds are net short on Yen and Pound futures but have reduced net short positioning over the past few weeks.
HYPOTHETICAL TRADE SETUP
The Fed’s dovish stance plus the hawkishness of European central banks will result in dollar weakness relative to Euro and Sterling. Upside risks to the dollar persist with stronger economic data and inflation resurgence forcing the Fed to reassess its stance.
To gain from the weakening of the dollar against the euro and sterling, investors can buy into CME Micro FX Euro and GBP futures. A long sterling provides higher upside than long euro given higher inflation in the UK.
Policy uncertainty in Japan is unlikely to usher in a pivot in the short-term. The JPY is likely to weaken against the dollar despite DXY weakness. To harness gains from weakening Yen, investors can establish a long position in CME Micro JPY Futures.
Hypothetical Trade 1 & 2: Long EUR and GBP
Entry: 1.0960
Target: 1.1150
Stop Loss: 1.0860
Profit at Target: USD 238 (= 1.1500 - 1.0960 = 190 pips = 190 x 1.25)
Loss at Stop: USD 125 (= 1.0860 – 1.0960 = -100 pips = -100 x 1.25)
Reward-Risk: 1.9x
Entry: 1.2720
Target: 1.3120
Stop Loss: 1.2490
Profit at Target: USD 250 (= 1.3120 - 1.2720 = 400 pips = 400 x 0.625)
Loss at Stop: USD 144 (= 1.2490 – 1.2720 = -230 pips = 230 x 0.625)
Reward-Risk: 1.75x
Hypothetical Trade 2: Short JPY
Entry: 139.57
Target: 146.28
Stop Loss: 137.97
Profit at Target: JPY 67,100 (= 146.28 - 139.57 = 671 pips = 671 x 100)
Loss at Stop: JPY 16,000 (=137.97 – 139.57 = 160 pips = 160 x 100)
Reward-Risk: 4.2x
MARKET DATA
CME Real-time Market Data helps identify trading set-ups and express market views better. If you have futures in your trading portfolio, you can check out on CME Group data plans available that suit your trading needs www.tradingview.com
DISCLAIMER
This case study is for educational purposes only and does not constitute investment recommendations or advice. Nor are they used to promote any specific products, or services.
Trading or investment ideas cited here are for illustration only, as an integral part of a case study to demonstrate the fundamental concepts in risk management or trading under the market scenarios being discussed. Please read the FULL DISCLAIMER the link to which is provided in our profile description.

Trading this week's fundamental events The market's attention will be fixed on the Federal Reserve's final policy meeting of 2023 scheduled for this Wednesday, with the expectation that the US will maintain interest rates at a 22-year high.
Investors will have an opportunity to scrutinize the Fed's statement and Chair Jerome Powell's press conference for any indications of potential rate cuts in 2024 (or lack thereof).
One day prior to the Feds decision, the US is also poised to unveil essential inflation data. Forecasts suggest a marginal uptick of 0.1% in November consumer prices.
Turning attention to Europe, traders will focus on rate decisions from the European Central Bank (ECB) and the Bank of England (BoE), both occurring on Thursday.
The BoE is predicted to maintain borrowing costs at a 15-year high while reiterating the necessity for elevated rates. Any commentary from the bank deviating from this outlook could potentially cause ripples in the market.
Eurozone inflation dropped to 2.4% last month, down from over 10% a year earlier, following ten consecutive rate hikes. This decline brings the ECB's 2% inflation target into view and makes a further rate increase unlikely. Goldman Sachs has forecasted that the European Central Bank's meeting in April will mark the initiation of its first rate cut, followed by a 25 basis points cut at each subsequent meeting throughout the year.

The Influence of Central Banks on Forex TradingThe global foreign exchange (Forex) market constitutes a vast and intricate financial ecosystem in which currencies from across the globe are traded. This marketplace witnesses the exchange of trillions of dollars on a daily basis, rendering it among the most liquid and dynamic markets on earth. Amidst this bustling activity, central banks play a pivotal role, especially through their institutional obligation to determine and conduct the country’s monetary policy. In this article, we will delve into the crucial influence that these major players exert on currency pairs and explore the role of central banks in the forex market.
Central Banks and Their Roles
Central banks are the main financial institutions in a country and serve as custodians of the domestic currency. They steer economic activity mainly through the money supply, which is influenced by setting a reference rate for domestic banks to borrow and lend money. Thus, by targeting specified central bank interest rates, a central bank sets exchange rates through the market forces of demand and supply.
Anticipated hikes or cuts in interest rates are conveyed throughout all financial markets well in advance of official announcements, influencing the decision-making of traders and investors.
Impact of Central Bank Foreign Exchange Measures on Forex Trading
Central banks have numerous instruments to manage the foreign exchange rates of their domestic currencies, including different rate regimes, central bank foreign exchange interventions, and interest rates.
Exchange Rate Regimes and Their Effects
Two major regimes determine the framework within which central banks operate and influence the broader financial landscape.
Fixed exchange rate regimes involve pegging the local currency to a specific measure of value, often a major international currency like the US dollar. The stability of this kind of central bank exchange rate can be attractive; however, it limits the ability to independently manage the interest rate in the central bank policy. Here, interventions are typically geared towards maintaining the established peg.
Conversely, floating exchange rate regimes provide the flexibility to determine the interest rates, as well as use all other vital tools for achieving monetary policy objectives.
Central Bank Foreign Exchange Interventions
Currency interventions are a common strategic tool in central bank foreign exchange policies, and they can cause notable fluctuations in forex.
A direct intervention occurs through the direct buying or selling of the local currency. This action is often used to stabilise or manipulate the exchange rate in the desired direction. Buying increases demand, and the forex rate of the currency appreciates. Selling does the opposite.
An indirect intervention involves adjusting target interest rates to influence investors' perceptions and behaviour. This involves actual raising or lowering; however, it can also include giving out subtle signals and implications through public statements made by officials.
Central Bank Interest Rates and Their Influence
Decisions regarding targeted central bank interest rates are at the heart of monetary policy. Depending on the general economic stance, the monetary authority has the option to raise rates (or keep them high) or lower them (or keep them low).
Hawkish Monetary Policy
Hawkish monetary policy refers to a stance that favours higher interest rates. This approach is also known as contractionary monetary policy, and it is adopted when the central bank seeks to combat high inflation or cool down an overheated economy. Hawkish policies are conducted by raising central bank interest rates, leading to an increase in capital inflows due to the expectation of better returns. The demand for the local currency rises, leading to its appreciation relative to foreign currencies, which is also reflected in the central bank forex rates.
Dovish Monetary Policy
Conversely, a dovish monetary policy involves favouring lower interest rates to stimulate economic growth by encouraging investments into the real economy. Lower rates can make borrowing cheaper and encourage spending and investment in the real economy. That may potentially weaken the demand for the domestic currency as it becomes less attractive to investors seeking higher returns, causing depreciation in the exchange rate.
Central Bank Interest Rate Instruments
The primary objectives of central banks are to maintain low and stable inflation, promote economic growth, and improve the purchasing power of the domestic currency, which in turn should provide for a healthy labour market and encourage strong consumption. Several instruments are available for that purpose.
Open market operations (OMO) are the main tools for achieving the targeted interest rates. The impact on forex rates follows these decisions and actions. OMO refers to the buying or selling of securities (typically government bonds) in the open market. Buying injects money into the system, indirectly lowering banks’ interest rates, while selling acts in the opposite action.
Another instrument that explains the role of a central bank in the forex market is the discount rate at which commercial financial institutions can borrow money from the central financial authority. Adjusting it adds/removes liquidity from money markets.
The reserve requirements are another available instrument. Modifying the percentage of total liquid assets to be held by financial institutions as reserves can either enhance or diminish domestic currency liquidity and affect interest rates.
In their pursuit of specific objectives, central banks wield a direct influence over forex trading. Fluctuations in central bank interest rates significantly impact currency values, can cause severe volatility, and create lucrative arbitrage opportunities for forex traders.
Interest Rate Differentials: Opportunities for Traders
Interest rate differentials are observed when there are gaps between the central banks’ interest rates. A higher interest rate in one country can lead to an influx of foreign capital, strengthening its currency. Respectively, when one country raises its rates while another keeps them lower, it creates a differential that attracts capital towards the higher-yielding currency, causing its appreciation and also a higher forex rate.
If you are interested in exploring trading opportunities, you can head over to FXOpen and try out the TickTrader trading platform.
Central Bank and Foreign Exchange Related Events
Traders use economic calendars to plan their strategies and stay ahead of potential opportunities or risks. Important announcements include employment reports, GDP releases, inflation figures, and consumption numbers. Yet, among the most closely followed events by traders are central bank interest rate decisions, as they have a profound impact on currency exchange rates and financial markets.
The timing and frequency of these announcements are known well in advance. For instance, in the US, the Federal Reserve holds eight scheduled meetings throughout the year, the European Central Bank conducts meetings every six weeks, while the Bank of Japan and the Bank of England typically hold meetings on a monthly basis.
Several weeks after they announce the target rates themselves, many central banks release the so-called “Minutes” – a detailed record of their latest monetary policy meeting. The “Minutes” can be of crucial importance as they offer a deeper insight into the discussions and deliberations among the officials and may provide insights into their future intentions and assessment of the economic outlook.
Trading Behaviour Around Major Interest Rate Releases
Trading before and after major interest rate announcements is challenging. Before a major announcement, traders consider the forecasts based on previously released economic data. If the expected rate estimate is in favour of a rate hike, appreciation of the respective currency is likely, and traders will buy it; otherwise, if data speaks for a rate cut, currency depreciation can be expected, and traders will sell.
Traders typically avoid holding open positions during an announcement. This way, the risk is mitigated, as, during an announcement, rapid, unpredictable movements of currency pairs can occur, especially if the actual announced rate differs from market expectations. After the announcement, new positions can be opened.
Conclusion
Central banks are formidable players in the forex market, wielding significant influence through their monetary policy decisions and interventions. Traders and investors must
closely monitor the authority’s actions and signals, as these can create substantial profit opportunities and risks in the dynamic world of forex trading.
Curious about exploring the vivid world of forex trading? You can consider opening an FXOpen account that will grant you advanced trading opportunities.
This article represents the opinion of the Companies operating under the FXOpen brand only. It is not to be construed as an offer, solicitation, or recommendation with respect to products and services provided by the Companies operating under the FXOpen brand, nor is it to be considered financial advice.

GREED, GREED, GREED but what follows?About a month back, I made a solid move in the market that sparked a strong rally. Now, as we near the end of a strong earnings season, I'm in a neutral position, but I'm taking steps to secure gains by trimming my positions. I reckon a decent pullback would be beneficial before considering further upward movement. There's quite a few gaps to fill due to some impulsive buying, and I believe reallocating capital is crucial for a healthier market, especially considering how much weight big tech holds in the SPY.
NVIDIA's earnings showed remarkable strength. They surpassed already optimistic expectations by a significant 10%. The $600 target set by premium sellers seemed overly ambitious, yet those sellers managed to benefit from the earnings report released last week.
Many institutional investors are operating under the assumption of a smooth landing in 2024, envisioning reduced rates, a depreciating US Dollar, a weakened Chinese macroeconomy, and sustained dominance in Large Cap Tech. The consensus among fund managers leans towards the belief that the Fed's rate hike cycle is nearing its end, with expectations of forthcoming decreases in short-term rates. Additionally, there's a noticeable shift of interest towards Real Estate Investment Trusts (REITs) and Japanese stocks.
(Source: BofA Global Fund Manager Survey, BLOOMBERG)

2023The chart you see is the EURUSD but this post isn't just about euro but it will be a key player coming into next yr.
It's been a year of CB's but where do we head next?
BOE raising rates 3.5%, with the split vote as we head into 2023 expect a large recession going forward as all CB's have raised rates they are hiking a little bit too much and yes they will have to cut as we head into the recession but hiking could actually be a mistake but we obviously don't control what CB's will do and CPI is declining 11.1% it dropped to 10.7% cost of petrol, tobacco etc Food prices are rising. It is a great amount 10% core inflation isn't excelling it's still at those areas. Raising rates, it takes time to come into transition. Now don't forget we've got strikes such as rail strikes, it isn't busy with retail sales aren't excelling people can't get into these stores and less people are spending.
FOMC: Raising rates 0.25% keep rates higher 2023 5.1% expectation of rate. Very hawkish, headline inflation 7.1% lowering CPI. These rate hikes are working. The market rallied S&P, it declined. Rate hikes are pacing themselves, we could even get cuts mid next year stop hiking rates, recession. It will take more evidence for inflation is on downward path, in reality it is declining. Perhaps its due to core inflation. The dot plot was the main move. It's 4.5%, they want 5.1%. No cuts in 2023, that's the questionable bit as well. Now market did rally before thinking there would be cut sooner 2023 well the dot plot differs in that view. 17 out 19 for 5.1% members. Last 3 months it has raised. That's interesting. Labour market jobs available and working 3.5 million it is very tight. When going into recession there's cost cutting, further reduction of employees = Recession. Job cuts are here tech sector, finance sector etc. Wages stay high, no demand disruption. May sustain high inflation. The need keeping rates higher for longer, extending the demand disruptions. Hiring was very difficult in first place, are workers going to extend the cut of workers? Time will tell.
ECB hiked as all CB's are. Anybody who thinks this is a pivot, is wrong. 50 basis point hikes pace for period of time EU indices fell. Very hawkish. They are lagging compared to other CB's, current rate 2.5%. Now bare in mind they do have to think of other countries but they are behind compared to others, the large bear move came. Quantitative tightening in May extends.
We had CPI's, we've had of this year CB's. Year ends all CB's hawkish. The markets SPX and other EUR indices rallying but it hasn't happened the Grinch came out, you can see in my previous posts I wasn't confident at all we could head higher especially SPX this can be seen through previous posts. I expect this to continue. Don't forget you got China think about as well reopening, it's interesting time there. Overall regarding the market, we already see housing having issues, there's another country that has my key interest it's Mexico, will manufacturing move further away from China and head a little to Mexico? USDMXN interesting FX pair I am going to keep an eye on for next year. Regarding market overall, I am bearish DXY for the next 6 months in my humble opinion . I feel shorter term, for sure a pull back but I think longer term: GBP we could hit back to 1.30/1.35 areas, EUR 1.15/1.20, XAG 30-35, keep an eye on other euro minor pairs could extend further a lot more in gains than others and yes I will even mention crypto 8-10k Bitcoin seems a good support area! If we technically stay above those areas, could be a good time to buy but that market overall has a lot of reinforcement to make regarding the regulations. The market doesn't go in straight line that's where technicals come in. Last year I expected we get higher DXY - we achieved that but this time I'm on the flip side...embrace yourself for recession.
Happy Holidays & Get ready to smash 2023.
Trade Journal
Financial Trader | Empowering Your Trading Journey
Disclaimer: Not Investment Advice Or Signal Provider

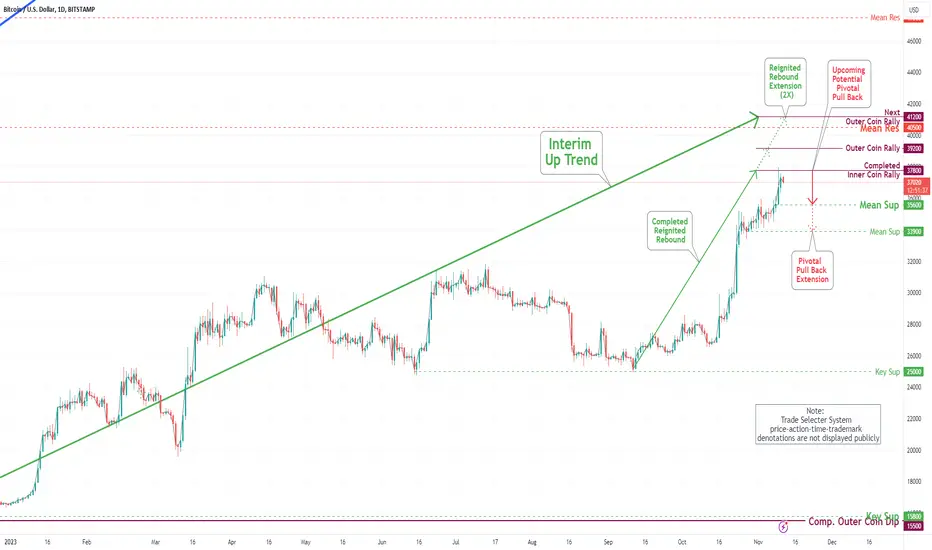
Bitcoin(BTC/USD) Daily Chart Analysis For Week of Nov 17, 2023Technical Analysis and Outlook:
Currently, the price of Bitcoin has been contained within our completed Inner Coin Rally of 37800 and vital Mean Sup of 35600. This has resulted in a trading tunnel that is particularly beneficial for those experienced in active trading. However, it is worth noting that the price is currently dropping towards the Mean Sup of 35600, and there could be a possibility of a further correction to the Mean Sup of 33900. On the upside side, Bitcoin's price has the potential to reach the Next #1 Outer Coin Rally of 39200, #2 41200, and #3 43700. This indicates a prospect for upward momentum in the near future.
Observing these price-action developments closely is crucial, as they could allow investors/traders to profit from the market. Understanding these price fluctuations and knowing when to act can be extremely beneficial in maximizing returns.

Bitcoin(BTC/USD) Daily Chart Analysis For Week of Nov 10, 2023Technical Analysis and Outlook:
The latest update on Cryptocurrency indicates that it has completed the Inner Coin Rally 37800 and is currently in the correction phase. The correction is expected to take it down to the intermediate target of Mean Sup 35600, but there is also a possibility of the correction extending further to Mean Sup 33900. On the upside, there are two crucial levels that investors/traders should keep a close eye on. These are the Outer Coin Rally 39200 and the Outer Coin Rally 41200. These levels are significant as they can influence the future trend of Cryptocurrency.
AUDNZD: Awaiting the RBA's decisionThe Australian dollar might give back most of its recent gains against the U.S. if the Reserve Bank of Australia opts not to raise rates next week, given the groundswell of opinion backing a hike. Thirty-five out of 39 economists polled by Reuters expect the RBA to increase rates on Nov. 7, with only four predicting a hold. All of the “Big Four” Australian banks are in the majority forecasting a hike, including Westpac where newly-installed chief economist Luci Ellis was until recently assistant governor at the RBA. AUD/USD scaled a five-week peak of 0.6456 on Thursday, as the risk-sensitive AUD benefitted from global equity gains, hours after AUD/NZD notched a 19-week high of 1.0948.
If the RBA springs a dovish surprise and keeps rates unchanged on Tuesday, AUD/NZD pair could sag towards 1.0820 area. Australia’s central bank most recently raised rates in May (when 75% of economists polled by Reuters expected a hold).
With these in mind, we will follow a simple bearish setup and try to take a short position on a potential technical bounce with a stop loss above the previous top.
Trade with care
Like | Share | Comment

Continuation of last post of XRP Here you can see XRP's price action from 2013-2017 I talked about in the last post.
Cheers!

XRP Price PredictionLooking at XRP's overall Price Action since its listing at Bitstamp in 2013 we can see a similar pattern evolving in the current Cycle compared to the Cycle from 2013-2017.
2013-2017 Price Action:
1. Cycle: Quick run up, then it went down like a curve relatively quickly (see blue line)
2. Cycle: Lower High than last Cycle and bottoming out over a longer period of time
3. Cycle: Parabolic Run Up
Between Cycle 1 & 2 it took out Sellside Liquidity.
Between Cycle 2 & 3 it took out Buyside Liquidity resting at 0.00907 - the swing high of that move comes in at 0.00947
______
2017-current Price Action:
1. Cycle: Quick run up, then it went down like a curve relatively quickly (see blue line)
2. Cycle: Lower High than last Cycle and bottoming out over a longer period of time
3. Cycle: Parabolic Run Up?
Between Cycle 1 & 2 it took out Sellside Liquidity.
Between Cycle 2 & 3 it took out Buyside Liquidity resting at 0.917 -
the swing high of that move comes in at 0.947
Look at the "coincidental" price points of both Cycle's Buyside Liquidity grabs...you can't make that up. Remove two zeros and you almost get the exact same price points as in July 2023.
______
My guess is that it will take out the Sellside Liquidity resting at $0.28704. Maybe even trading down to grab the Sellside Liq. at $0.16918. Once it grabbed it, it will then go for another parabolic run up like we saw in 2017.
Why would that make sense with the overall understanding of the market? Like I explained in my last BNB analysis Tether will go down at one point. Inevitable. XRP won't stay up there during that moment in time.
Also think about it like this: The SEC case pump in July was a trap for retail traders to buy it up. Who sold it to them? Smart Money (the big guys). If Smart Money sold their fair share of XRP in July, then they definitely want to buy back in again, but at much lower prices, right?
Who is going to sell once we break down the $0.30 floor? Retail...Smart Money is buying it all up, then we wait & XRP will be one of the big players in the future and get another parabolic run - working with Central Banks etc. (if you want to learn more about that follow me here or on Twitter - I will post more in the near future)
______
Looking at the chart from a different perspective:
Since 2017 the chart has been getting compressed. When something gets compressed over a long period of time, this pressure needs to be released at one point like we saw in 2017. The same will happen in the future. Or think about it like as if it was breathing in and out. Universal laws.
______
Welcome to kingoftrades 88's way of charting.
______
Nothing posted here is financial advice.

Bitcoin(BTC/USD) Daily Chart Analysis For Week of Oct 20, 2023Technical Analysis and Outlook:
This week, Bitcoin saw a surge in price, reaching Inner Coin Rally 29300 and Mean Res 29700. The next target is the Inner Coin Rally 30900 and a retest of the completed Outer Coin Rally 31700. However, it is essential to note that there may be some intermediate pullbacks along the way with the main target Mean Sup 29000.

Bitcoin(BTC/USD) Daily Chart Analysis For Week of Oct 13, 2023Technical Analysis and Outlook:
This week, the coin remained within the Mean Resistance of 28000 and drifted down to a Mean Support of 26900. It is heading toward testing the next level of Mean Support, 26200, and could extend to the additional Mean Support level of 25100. However, in the meantime, the upside rebound to Mean Res 27400 is highly probable.
