Inflation & Geopolitical Context should support Gold in MidtermNonetheless, Q1 2023 gold fundamentals were still interesting and most likely, the Central Banks' interest in gold could continue for much longer. In our view, the current inflationary and geopolitical environment will still support the yellow metal in mid-term, at least for the next 12-24 months.
Gold Demand Trends Q1 2023
(Mixed picture for gold demand in Q1)
Continued momentum in central bank buying and resurgent Chinese consumer demand contrasted with a negative contribution from ETFs and weakness in India. Q1 gold demand (excluding OTC) was 13% lower y/y at 1,081 tonnes (t). Inclusive of OTC, total gold demand strengthened 1% y/y to 1,174t as a recovery in OTC investment – consistent with investor positioning in the futures market – offset weakness in some areas.
Demand from central banks experienced significant growth during the quarter. Official sector institutions remained keen and committed buyers of gold, adding 228t to global reserves.
Bar and coin investment gained 5% y/y to 302t, concealing some large regional variations. In contrast, net negative demand for ETFs, although modest at -29t, generated a hefty y/y decline compared with the sizable inflows seen in Q1’22.
Global jewellery consumption was virtually flat at 478t. Jewellery fabrication exceeded consumption as stock building added just over 30t to global inventories.
Gold use in the technology sector continued to suffer from the challenging economic climate. Demand slumped to 70t – the second lowest quarter in our data series back to 2000.
Modest growth in both mine production (+2%) and recycling (+5%) led to a marginal increase in Q1 total gold supply to 1,174t. The uptick in recycling was largely a function of higher gold prices.
The LBMA Gold Price (PM) averaged US$1,890/oz during the quarter, marginally higher y/y. The price was over 10% higher than the previous quarter’s average, almost matching the Q3’20 record high.
China saw a strong relief rally in the first post-COVID quarter of unfettered consumer spending. The recovering domestic economy and healthy income growth reignited domestic consumption, while the eye-catching gold price performance spurred investment interest.
Indian demand fell sharply as local gold prices applied the brakes . Record high – and volatile – domestic gold prices discouraged both investment and jewellery consumption during the quarter.
Investment dominates the outlook for 2023. We continue to see healthy upside for investment this year, while the picture for fabrication (jewellery and technology) is more muted. Further robust central bank buying is expected, albeit below 2022’s record. Modest growth is likely in both mine production and recycling.
In conclusion , in addition to waiting with confidence for Q2 data, in short term the gold price could be slightly high to increase institutional appetite, but we think that any downward peak will be seen by Central Banks as an interesting opportunity to add value to their reserves. Conversely, but only in the short term, speculators could lighten some positions by taking part in the profits.
Technically speaking , in near term, gold could trigger some bearish consolidation as we have shown in our previous analysis.
(Click & Play on chart below to follow it)
Trade with care!
Like 🚀 if my analysis is useful.
Cheers!
Macroeconomic Analysis And Trading Ideas

Natural Gas - Set to Fly High with the Dollar?Weekly Long Position on AMEX:BOIL
A new major low was observed in this market on May 30th
The security of interest is $NYMEX:NG1!. Using a leveraged product AMEX:BOIL to gain exposure to a potential short-term movement, as a continuation of a long-term trend. See below the chart of $NYMEX:NG1!.
Commodities, equities, and other assets priced in US Dollars are subject to relative foreign-exchange changes, as realisation of risk is highly complex in globalised markets. The price of NYMEX:NG1! represents some relationship to an almost infinite supply of financial products, as capital moves around the interconnected world.
For example, Iran is not apart of SWIFT and must exchange assets to engage in trade with other nations. Their crude oil is paid for in gold. However the 'zero-risk' benchmark for both these commodity products, NYMEX:CL1! and COMEX:GC1! , are priced in US Dollars. As the relative strength of the US Dollar fluctuates, asset prices too will fluctuate even without alteration to any of the fundamental dynamics of the market in question. Martin Armstrong has established himself the foremost expert on 'Capital Flow Analysis'.
See below the chart of COMEX:GC1! , FX:USDCHF , ECONOMICS:USCPI
Important to note is the lack of direct correlation between Gold priced in US Dollars, and US Dollar domestic inflation (CPI). Contrary to the assertion of many analysts, gold responds directly to sovereign-related risk. The 'relative-value' of gold at the time of each major high reflects price discovery across all asset classes, though we can only view one time-price continuum on a chart.
With that in mind, see below the chart of TVC:DXY and a few commodities.
All these markets demonstrate various correlations to one another, there is a general trend that can be observed. As the capital flows persisting from Feb 2022 onwards reflect a shifting global investment outlook, towards high-quality assets.
Over the course of the last few financial crises, the safe place for capital was US sovereign debt, in the form of Treasuries. As the plumbing of the two-tier global banking system is operated by the US Federal Reserve, highly liquid money markets keep the USD afloat in times of financial stress. However, this has not always been the case. During the Great Depression, the contraction of capital (deflation) was so severe that physical, paper US Dollars were the global asset of choice for security. Capital formation could continue once the price of gold was un-pegged from the dollar, to properly reflect price discovery in the newly minted global economy.
Energy markets have become particularly chaotic over the last 16 months, as Russia plays an important role, particularly in Europe where a network of pipelines has become a security issue. Heavy sanctions have been placed on Russia, as well as an outright ban of a large quantity of its exports. Russia, having control over Ukraine's direct access to the ocean, has returned the favour. Resulting in a disruption in markets from wheat, and lumber, to gold and neon. With the Nordstream projects in critical condition, Europe's energy fragility should be of great concern, both domestically and to its allies.
Among the sanctions, is a 'price cap' on the price of crude oil for export at $60/barrel. See chart of NYMEX light crude, and European brent crude.
For those not aware, these represent relatively "raw" product exchanged on global markets. Crude must be refined to produce products like gasoline, diesel, lubricants, etc. As with any attempt to artificially manipulate the price of an asset, this presents arbitrage opportunity. Since December when this was imposed, China and India have reportedly been buying Russian crude, refining and exporting it.
Russia has spent years purging US Dollar exposure from its energy markets, as war in the Middle East has steadily grown tension between the two powers. Foreign exchange markets are very sensitive to volatility, and can respond unpredictably to major shifts in trend. The consequences of capital moving around the globe quickly can be devastating, see FX_IDC:USDRUB , TVC:US10Y , and TVC:MOVE the US bond market volatility index, compared. All markets must respond to price action, as real risk remains deeply concealed.
All while this is going on, global shipping has become significantly more expensive. Meaning the logistical element of global energy markets has become very convoluted. From cheap oil sitting on tankers, to arbitrage of diesel products, to ships transferring oil between one another to conceal Russian oil, to leveraged oil ETFs, the dynamics of NYMEX:CL1! have become almost unfathomably complicated.
So to return to NYMEX:NG1! , the value of this product lies in simplicity. The current price can only be assumed to properly reflect global monetary conditions, as a dramatic correction can be observed. The art of business, is buying what nobody wants and selling it when everyone wants it. So much focus in finance at the moment is pointed towards the Federal Reserve and its attempted manipulations of the interest rate on US Dollars. Why this is taking place however, is a subject that has avoided capturing attention.
The Federal Reserve is attempting to combat WAR INFLATION by creating deflation domestically, supported by capital flows from abroad. Flight to quality will take place independent of any institutional power, by offering a higher rate of return on Treasuries the Fed is more likely to be able to reduce its balance sheet, and support NATO's war efforts. In order to pay troops, send equipment offshore and make loans to Ukraine, capital must leave the borders of the United States, to the sum of trillions, creating massive inflation globally.
So to clarify, global capital is fleeing towards the United States. However, the only sources of capital formation in the United States are financialization, and war. Stagflation, thought to be impossible, has returned to the world. As such, equity and asset prices can continue to rise, without actually rising in relative value globally, since the same will occur in the sum of tanks, aircraft, etc, moved around the world. A zero-sum game.
The fact of the matter is that the world is going to need natural gas - and a lot of it at that. The current domestic investment climate can't adequately adjust for this, the dominant psychological trends in markets push capital down paths which are facilitated by political means, for example 'Environmentally Safe Governance'. Exploration of gas reserves and extraction of energy products has become very unpopular in the last decade, to the unfortunate dismay of anyone who hopes to drive car or live in a heated home in the next decade.
Of note, that besides the US and Canada the largest producers and exporters of natural gas are apart of, or close to the influence of BRICS. Any global conflict which takes place, will first manifest itself in global financial markets, and there is lengthy historical precedent for this. Europe, which has its gas supplied from abroad is completely exposed to market energy prices, as well as the logistical risk of actually supplying said gas. A precarious position to be in, as war knocks on their door.
Immediately after Russia's invasion of Ukraine, the world saw a vision of the future flicker as gasoline prices skyrocketed. Reality as we know it in the industrialised depends on simple global logistics, and cheap energy prices. Both of these constructs are crumbling very quickly, and cannot be resolved until a settlement is made between Ukraine and Russia. Money printing and sanctions cannot make more natural gas appear, nor get it across the ocean cheaply.
I propose a trade on AMEX:BOIL , to gain exposure to volatility in Natural Gas markets. Lines of support/resistance represent the arbitrary price points I suggest may be relevant, and can be used for entry/exit and position management.

Bitcoin(BTC/USD) Daily Chart Analysis For Week of June 9, 2023Technical Analysis and Outlook:
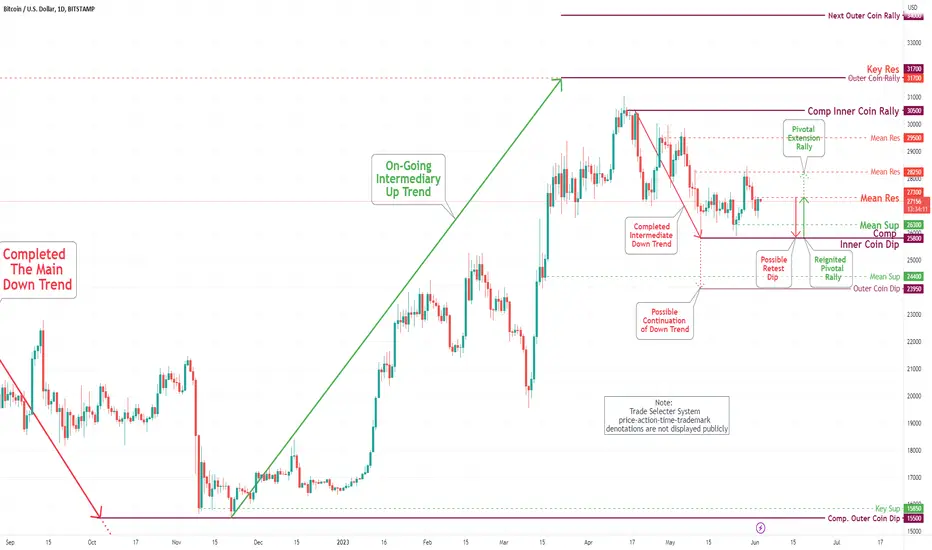
The coin has reached the Retest Dip price furiously banging on our completed Inner Coin Dip of $25,800 and Mean Sup $25,700 with follow-up today (Sat., June 10). However, we anticipate a significant shift in the market with the Restart of the Pivotal Rally, which could lead to a return to the mean Res $27,300 or even Mean Res $28,250. In the event of failure, the Continuation of the Down Trend will target our Outer Coin Dip of $23,950.Viewing the Pivotal rally prediction is based on the current price action, notwithstanding confirmation from the Trade Selector that will be given before implementing any strategies.

Bitcoin(BTC/USD) Daily Chart Analysis For Week of June 2, 2023Technical Analysis and Outlook:
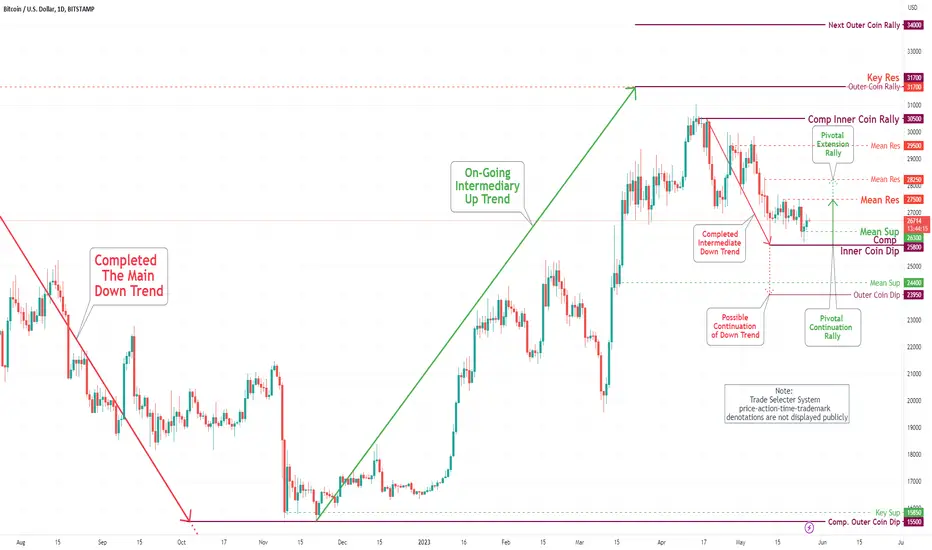
In this week's session, the coin has achieved the projected prices of Mean Res $27,500 and Mean Res $28,750 as outlined in the Daily Chart Analysis for the Week of May 26. Based on the current price action, the coin will likely test the Inner Coin Dip of $25,800 and potentially make a significant drop to the Outer Coin Dip of $23,950. The upside potential will address the Mean Res $28,250 as a ''Do That To Me One More Time''.
Bitcoin(BTC/USD) Daily Chart Analysis For Week of May 26, 2023Technical Analysis and Outlook:
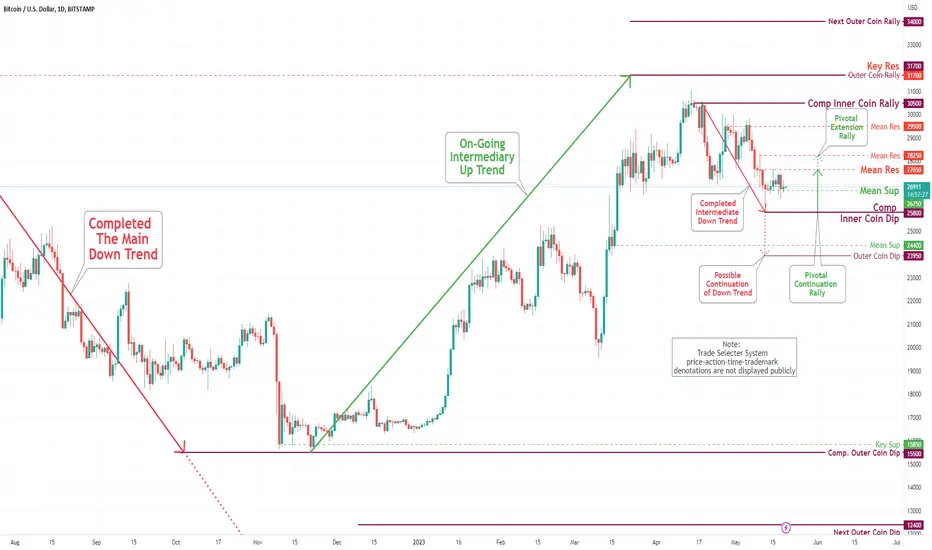
During this week's trading, the coin has successfully retested the Inner Coin Dip zone and is now expected to bounce back towards the newly established Mean Res $27,500 target. Furthermore, it is anticipated to continue its upward movement towards Mean Res $28,250 in the upcoming week, thereby reigniting the price action upward direction.
Bitcoin(BTC/USD) Daily Chart Analysis For Week of May 19, 2023Technical Analysis and Outlook:
Throughout the week, the coin's prices remained relatively stable, fluctuating between the Completed Inner Coin Dip of $25,800 and the Mean Res of $27,650. However, the emergence of a new, less significant Mean Sup of $26,750 indicates the possibility of a drop in price to the Inner Coin Dip of $25,800 or even lower to the Outer Coin Dip of $23,950. Conversely, there is currently no indication of an increase in price action to and beyond the Mean Res of $27,650 and $28,250.
Bitcoin(BTC/USD) Daily Chart Analysis For Week of May 12, 2023Technical Analysis and Outlook:
During the week, the coin experienced a price decrease and completed an Inner Coin Dip of $25,800. However, the current price action indicates a likely increase to Mean Res $27,650 and even Mean Res $28,250. If the price continues to fall, it may reach an Outer Coin Dip of $23,950.

Bitcoin(BTC/USD) Daily Chart Analysis For Week of May 5, 2023Technical Analysis and Outlook:
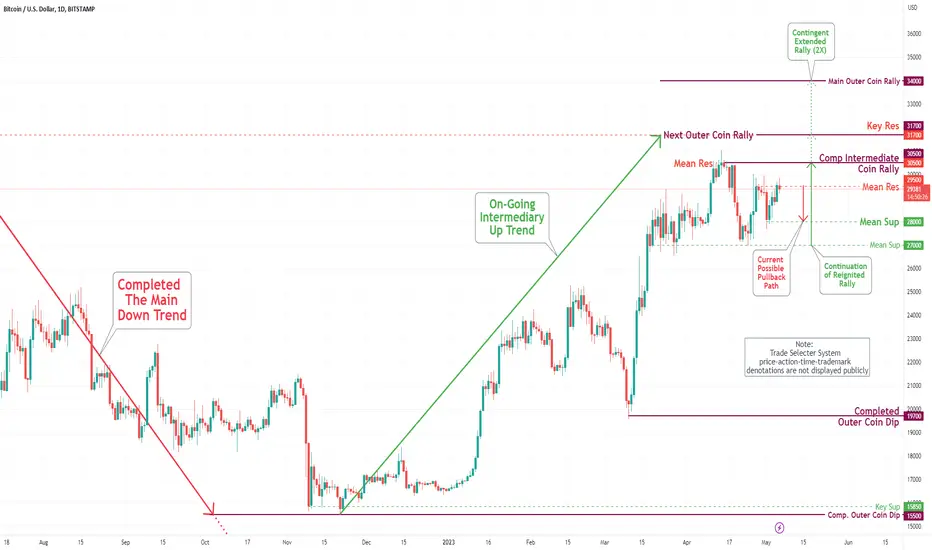
Throughout the week, the coin remained steady between our Mean Res $30,500, Intermediate Coin Rally of the same, and Mean Sup $27,000. It established a new soft Mean Res at $29,500 and a strong Mean Sup at $28,000, which most likely will be retested. This price action indicates that there will be robust progress in reaching the Next Outer Coin Rally point of $31,700 and, ultimately the Main Outer Coin Rally at $34,000.
Short GBPAUD on UK Weakness & Hawkish RBAThe GBPAUD is clearly showing weakness in its daily chart and a turn in its weekly chart. The fundamental reason for this weakness is clear: the UK continues to be weak generally despite slightly better PMI readings this week. More importantly, the RBA is of the view that inflation continues to be too high in Australia and isn't afraid to continue to raise further from the current 3.85%.

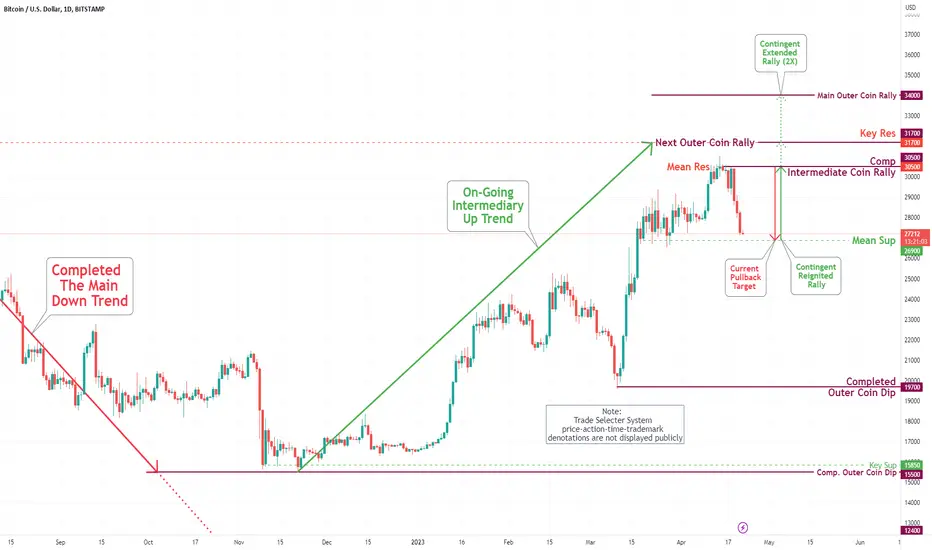
Bitcoin(BTC/USD) Daily Chart Analysis For Week of April 28, 2023Technical Analysis and Outlook:
The coin made a significant pullback to our Mean Sup of HKEX:26 ,900, which was achieved with a substantial price increase following the Mean Res and Intermediate Coin Rally levels of HKEX:30 ,500, which is in process. This will be followed by a further boost to reach the Next Outer Coin Rally point of 31,700 and, eventually, the Main Outer Coin Rally point of HKEX:34 ,000.

Algorithm vs Liquidity In Determining PriceBased on my research into IPDA and algorithms, central banks, trading firms/hedge funds, and smaller banks use execution algos (EAs) for trading with different objectives. Small banks use EAs to split large parent orders into smaller child orders generally in one direction, buy or sell. These orders are executed separately over a period of time to either open or close positions.
Trading firms and hedge funds use opportunistic EAs to buy and sell to turn a profit.
Central banks use market making EAs to buy and sell in order to bring liquidity providers net positions back to or close as possible to neutral. (This sounds like equilibrium). Central banks use EAs cautiously and only during their main trading hours and always under the supervision of people.
A key reason for using EAs is to access multiple liquidity pools in order to reduce market impact or footprint.
This is similar to a parent child relationship between Central Bank algos and other smart money players, where smart money (including central banks) accumulate orders in consolidation before expanding price, then the central bank algo pulls them back to equilibrium like a parent calling their child that has strayed too far away. Then they rinse and repeat.
I am of the opinion that with the function of central bank algos to facilitate the provision of liquidity with minimal market impact, that liquidity itself is the determining factor in price delivery.
Algos used by smart money break up large orders in to smaller chunks and funnel them to multiple liquidity providers (market makers) for fulfillment since forex is decentralized. If there is enough liquidity (buyers and sellers) to open/close positions at a certain price then it is done at that price. When liquidity is low or there aren't enough buyers and sellers at the current price, the market maker's algo has to fill these received orders where there is enough liquidity based on available buyers and sellers. The algos move very quickly which can deplete available buy or sell orders rapidly leaving unfilled counter party orders in its wake which defines liquidity voids (imbalance).
Algo adjustments to meet buyers and sellers at their price is perceived as a stop hunt but it's just economics.
Example: If I must sell something and I want to sell it for $100 but no one is willing to pay $100, I would have to look for buyers willing to pay $95.
If I must buy something and I only want to pay $100 but the seller is charging HKEX:105 , then I have to pay $105.
Either the buyer crosses the spread to meet the seller or the seller crosses the spread to meet the buyer. When there are limit and stop orders the buyer or seller isn't moving so the liquidity provider has to move to meet these buyers/sellers at their limit or stop order prices (including orders left behind in liquidity voids).
When the orders trigger and price reverses it takes out both buyers and sellers so people call it a hunt, but I'm sure it is intended for actual institutional trading entities because retail traders such as ourselves can not provide the liquidity to be on the other side of every order placed by institutions.
We are simply collateral damage in the battle between financial titans seeking to provide and tap into liquidity.

Bitcoin(BTC/USD) Daily Chart Analysis For Week of April 21, 2023Technical Analysis and Outlook:
The rally of the coin price has reached HKEX:30 ,500, which completes the Intermediate Coin Rally with a strong Mean Res at the same price. A significant pullback is underway, with the price declining toward the Mean Sup of HKEX:26 ,900.There is expected to be a substantial increase in the price, leading to a retest of the Mean Res and Intermediate Coin Rally levels of HKEX:30 ,500. This will be followed by a further boost to reach the Next Outer Coin Rally point of 31,700 and, eventually, the Main Outer Coin Rally point of HKEX:34 ,000. Stay tuned for further price action.
Gold: Long term Buy Short term NeutralLong Term Bull run is intct, thougfh short term the wave cycle can still take it to sub 1900 levels.
Wait for the big signal to go Long. Resistances Galore at teh current levels.

Bitcoin(BTC/USD) Daily Chart Analysis For Week of April 14, 2023Technical Analysis and Outlook:
The coin price action exploded through our completed Intermediate Outer Coin Rally of HKEX:29 ,200, Key Res HKEX:29 ,900, and Outer Coin Rally of HKEX:30 ,000 earlier this week's session, as flagged since Daily Chart Analysis for March 17. Current price action suggests a solid rally to Outer Coin Rally and Key Res HKEX:31 ,700. On the downside, Mean Sup is HKEX:29 ,800, the primary target.

Bitcoin(BTC/USD) Daily Chart Analysis For Week of April 7, 2023Technical Analysis and Outlook:
The coin price action blitzed under its completed Intermediate Outer Coin Rally of HKEX:29 ,200 and strategic pullback to Mean Sup HKEX:29 ,900 this week. Current price action suggests a vital decline to Mean Sup HKEX:26 ,900. The upside target scenario is the Outer Coin Rally of HKEX:30 ,000, and the extension to the Outer Coin Rally of HKEX:31 ,700 and Key Res of the same price is not viable now.

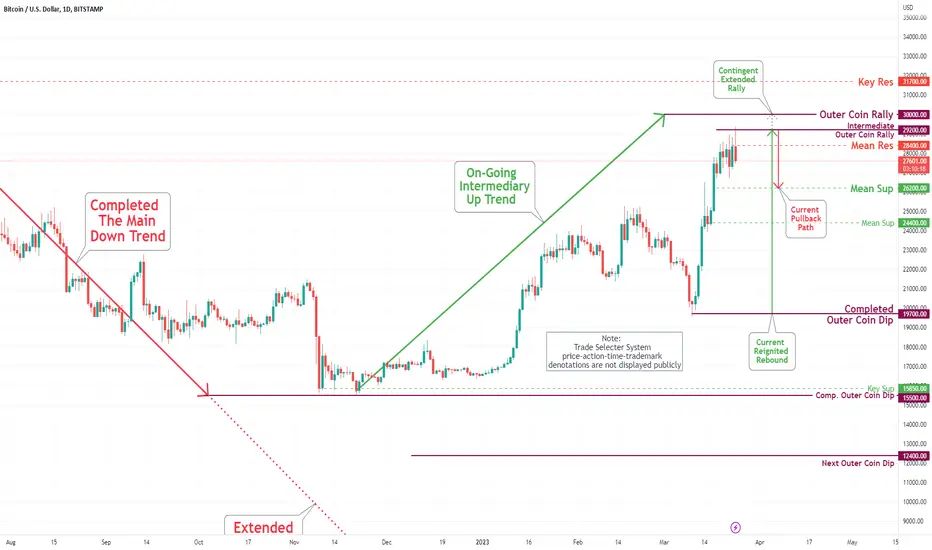
Bitcoin(BTC/USD) Daily Chart Analysis For Week of March 31, 2023Technical Analysis and Outlook:
The coin repeated its completed Intermediate Outer Coin Rally of $29,200 and strategic pullback to Mean Sup $29,900 this week. Also, current price action indicates a possible rinse and repeat of the trading envelope. The upside target scenario is the Outer Coin Rally of $30,000 and an eye on the following extension to the Outer Coin Rally of $31,700 and Key Res of the same price.

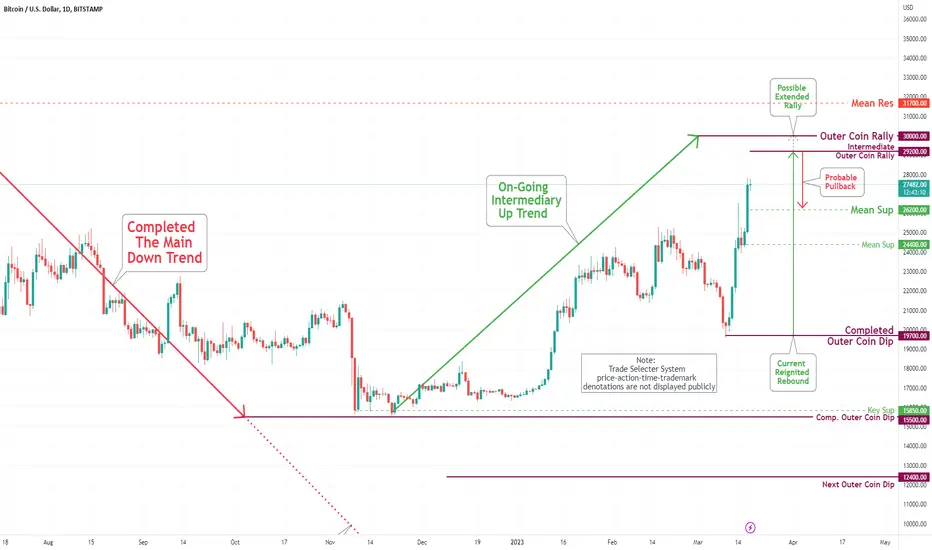
Bitcoin(BTC/USD) Daily Chart Analysis For Week of March 24, 2023Technical Analysis and Outlook:
With the completed Intermediate Outer Coin Rally of $29,200, the coin is retreating to Mean Sup $26,200. The current upside target is the Mean Res $28,400, a retest of the Intermediate Outer Coin Rally of $29,200, and fulfillment of the next destination, an Outer Coin Rally of $30,000.
Inflation dominates financial stability risks for central banksDespite the banking industry turmoil, central banks continued to raise rates last week. This marked moves from the European Central Bank (ECB) by 50Bps, Federal Reserve (Fed) by 25Bps, Bank of England by 25Bps, Swiss National Bank by 50Bps, Norway by 25Bps, the Philippines by 25Bps, and Taiwan by 12.5Bps. Central banks appear determined to show they have the tools in place to nip financial stability issues in the bud and so monetary policy is free to deal with inflation.
The Fed is likely nearly done
The March Federal Open Market Committee (FOMC) turned out to be on the dovish side. This was evident in the written statement in which the FOMC anticipates – “some additional policy firming may be appropriate” from “ongoing increases in the target range will be appropriate”. There was a risk that if the Fed chose not to hike rates, it would raise concerns about further financial system weakness. The reason given was that financial instability was "likely to result in tighter credit conditions for households and businesses and to weigh on economic activity, hiring, and inflation”.
The Fed has clearly signalled to the markets that it can control financial contagion from spreading by providing large amounts of liquidity. Over the past weeks we have seen a combination of measures to stabilise the market turmoil, including 1) The Fed’s proposal to provide immediate deposit protection and emergency lending 2) the intervention by Swiss Authorities to merge Switzerland’s two biggest banks and 3) the resumption of a dollar swap facility among central banks.
If the banking crisis calms down and the economic data looks anything similar to the January/February reports, another rate hike at the May FOMC meeting should not be ruled out. Conversely, ongoing market dislocations could outweigh the data and push the Fed into pause mode. Currently the implied probability for Fed Funds Futures looks for a rate cut during the summer. That scenario can only materialise if the risks emanating from the banking system continue to deteriorate from a market and/or economic perspective.
Gold offers a potential investment solution
There is no doubt that the investment landscape is fraught with elevated uncertainty and, of course, the volatility that comes with it. Gold is benefitting twofold from its safe haven status alongside the earlier than expected pivot in monetary policy by the Fed. While the Fed does not currently see rate cuts this year, in contrast to market expectations, its projections raise the prospect of rate cuts for 2024 which remains price supportive for gold.
The Commodity Futures Trading Commission (CFTC) has now largely caught up with publishing futures positioning data for gold following the disruption in February due to a ransomware attack on ION Trading. We now know there was a slump in positioning during February, but net longs in gold futures rose back above 154k contracts on 14 March 2023 as the banking crisis was unfolding.
Laying an emphasis on quality stocks
Rising concerns about financial stability tends to cause negative feedback on the real economy. Quality has stood the test of time, displaying the steadiest outperformance over 10-year periods. Dating back to the 1970s, quality has displayed the highest percentage 89% of outperforming periods in comparison to other well-known factors.
The WisdomTree Global Developed Quality Dividend Index (Ticker: WTDDGTR Index) offers investors an exposure to dividend paying stocks in developed markets with a quality tilt. The WisdomTree Global Developed Quality Dividend Index has outperformed the MSCI World Index (Ticker: MXWO Index) by 1.54% over the past five years. The emphasis on quality, by tilting the portfolio exposure to stocks with a high return on equity has played an important role in its outperformance versus the benchmark.
Over the past five years, we also observed the allocation and selection of stocks within the information technology, financial and healthcare sectors contributed meaningfully to the 1.54% outperformance versus the MSCI World Index as highlighted below.

Bitcoin(BTC/USD) Daily Chart Analysis For Week of March 17, 2023Technical Analysis and Outlook:
With the completed downfall to our Completed Outer Coin Dip of $19,700 on March 10, the coin rebounded strongly to an Outer Coin Rally of $26,000 and $27,000, respectively, as shown on the Daily Chart Analysis Update For the Week of February 17. The current upside target is the Intermediate Outer Coin Rally of $29,200 and Outer Coin Rally of $30,000 - The Mean Res $31,700 might be possible this week. Once these completed rallies are verified and validated by Trade Selecter System, we will see the pullback to Mean Sup $26,200.
XAUEUR breaking the up trend channel for more upside push!At the beginning of the year OANDA:XAUEUR broke the down side channel. While banks are bankrupting, we see once again gold is the safe heaven for many people. Most importantly for the central banks which have been accumulating physical gold. FED and ECB will struggle to further increase the interest rates. We may see new ATH within a couple of months! Crazy times again.
Disclaimer – WhaleGambit. Please be reminded – you alone are responsible for your trading – both gains and losses. There is a very high degree of risk involved in trading. The technical analysis , like all indicators, strategies, columns, articles and other features accessible on/though this site is for informational purposes only and should not be construed as investment advice by you. Your use of the technical analysis , as would also your use of all mentioned indicators, strategies, columns, articles and all other features, is entirely at your own risk and it is your sole responsibility to evaluate the accuracy, completeness and usefulness (including suitability) of the information. You should assess the risk of any trade with your financial adviser and make your own independent decision(s) regarding any tradable products which may be the subject matter of the technical analysis or any of the said indicators, strategies, columns, articles and all other features.

Bitcoin(BTC/USD) Daily Chart Analysis For Week of March 10, 2023Technical Analysis and Outlook:
The coin continued to downfall passed our Mean Supports of $21,500 and $20,476 this week to complete the Outer Coin Dip of $19,700. Once this completed knockdown is verified and validated by Trade Selecter System, we will see the rebound - the initial target of Mean Res of $20,900 with a possible extension to Mean Res of $22,500. The rally to Key Res of $25,000 and the Outer Coin Rally of $26,000 is postponed until further notice.

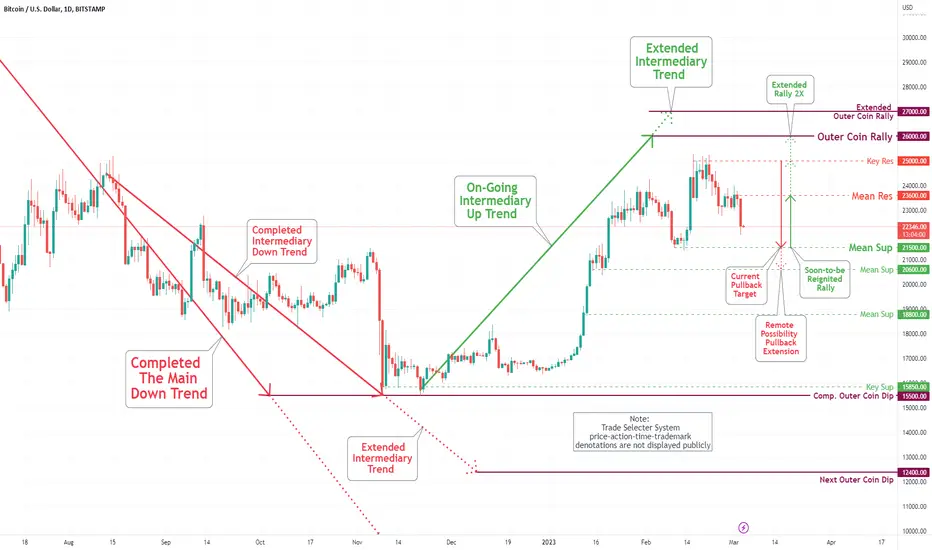
Bitcoin (BTC/USD) Daily Chart Analysis For Week of March 3, 2023Technical Analysis and Outlook:
The coin continues our technical analysis scenario from the previous week showing an earmark move to Mean Sup $21,500 as a primary destination. Once this knockdown market cools off, we will see a resurgence to the upside - the initial target of Mean Res of $23,600 with a solid rally to Key Res of $25,000 and the strong possibility to Outer Coin Rally of $26,000.
Looking for a bullish breakout from USD/JPY's consolidationA bullish engulfing candle formed on Friday thanks to a hot US inflation report. The fact that incoming BOJ governor Ueda delivered a dovish message at his confirmation hearing simply adds to our bullish conviction on USD/JPY.
Prices are now consolidating on the 1-hour timeframe, so we'd welcome any pullback towards the weekly pivot point to consider long setups, with the next bullish target sitting around the weekly R1 pivot (137.30). The OBV remains elevated to suggest the rally has been supported by bullish volume, so we're also on guard for a bullish breakout from the current consolidation.
