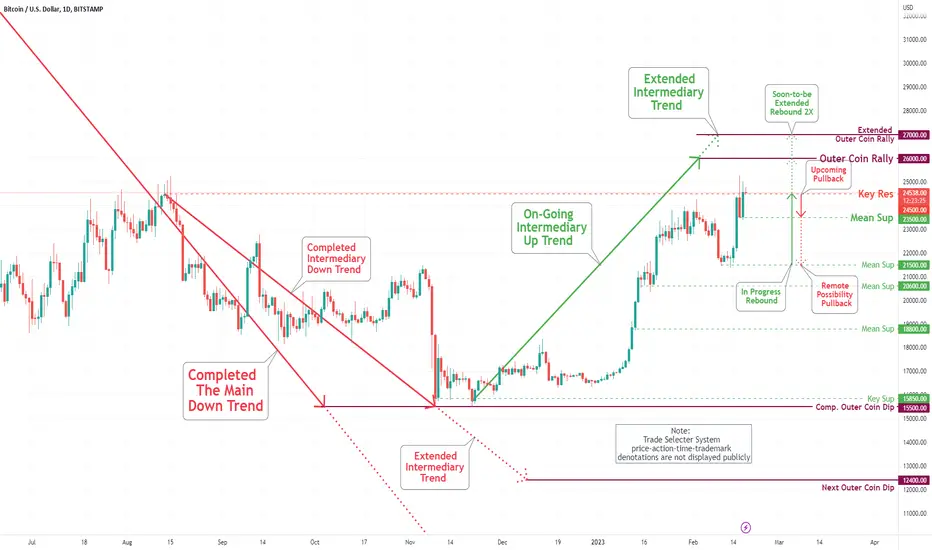
Bitcoin (BTC/USD) Daily Chart Analysis For Week of Feb 17, 2023Technical Analysis and Outlook:
The coin is resting comfortably at our Key Res $24,500, as shown on the Bitcoin Daily Chart Analysis Update For the Week of Feb 16. We expect a pullback to our Mean Sup $23,500 for this week's price action. Once this puppy settles down, we will see a resurgence to the upside - the initial target of Key Res $24,500 (Retest) with a rally all the way to the Outer Coin Rally of $26,000 and Soon-To-Be the Outer Coin Rally of $27,000 outcome.
Macroeconomic Analysis And Trading Ideas
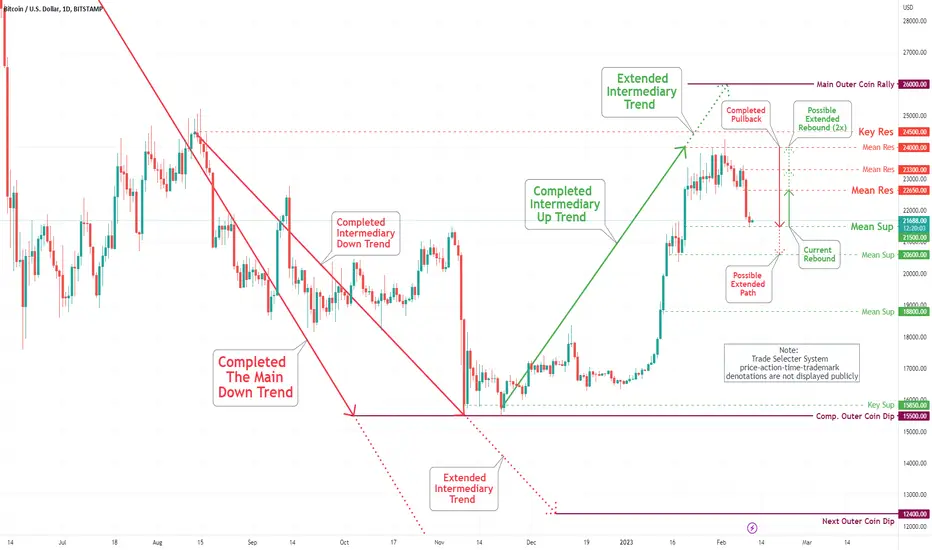
Bitcoin (BTC/USD) Daily Chart Analysis For Week of Feb 10, 2023Technical Analysis and Outlook:
Bitcoin hit our initial progressive pullback Mean Sup $22,500 and extended a retreat to Mean Sup $21,500 on Friday as shown on Bitcoin Daily Chart Analysis For the Week of Feb 3. Once this puppy flushed out weak-longs, resumption to the upside shows the initial target of Mean Res $22,650 with a possible rally all the way to the Mean Res $23,300 and $24,000 - this week.
an update on central bank liquidities
central bank balance sheets
central bank rates
central bank - mandate - inflation
central bank - mandate - employment

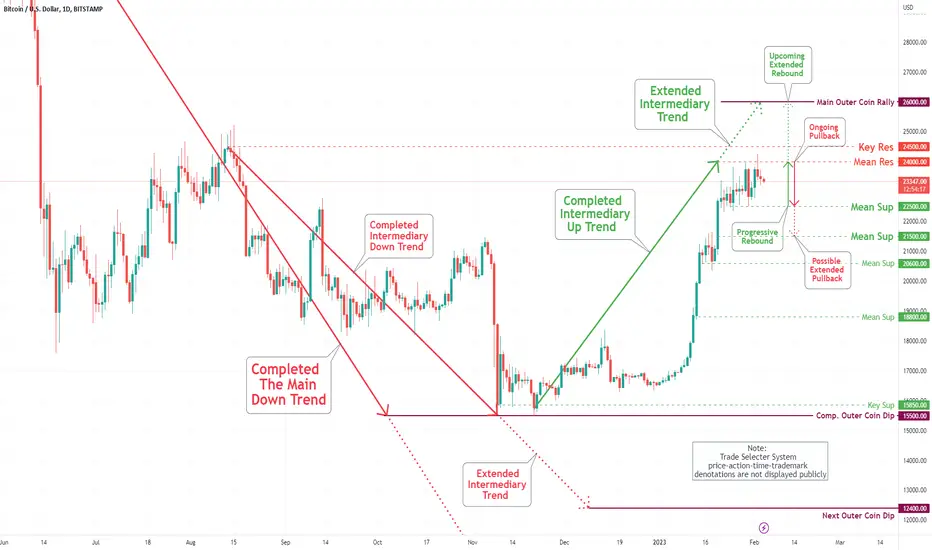
Bitcoin (BTC/USD) Daily Chart Analysis For Week of Feb 3, 2023Technical Analysis and Outlook:
Bitcoin extended a progressive rebound to a new Mean Res $24,000 - with the expectation of a pullback to the Mean Sup $22,500 and, possibly, an extension to Mean Sup $21,500. Once this puppy flushes out weak-longs, resumption to retest the Mean Res $24,000 and the Key Res $24,500 is imminent with a rally all the way to the Outer Coin Rally of $26,000.
Bitcoin (BTC/USD) Daily Chart Analysis For Week of Jan 27, 2023Technical Analysis and Outlook:
The coin hoovered under our completed with conformation Outer Coin Rally of $23,300 throughout the week - expect a pullback to the newly created Mean Sup $22,500 and, as a bonus, Mean Sup $21,500. Once this puppy flushes out weak-longs, resumption to retest the Outer Coin Rally of $23,300 and $26,000 is inevitable.
Bear Markets are for Building?Friends, fundamentally things could not be looking any better for Ethereum.
Multiple Central Banks are now building on Ethereum infrastructure. (1)(2)(3)
Treasury Tokenization thanks to Blackrock (will increase TVL ) (4)
Circle launching a Euro Stable Coin - which will increase adoption. (5)
Additional stable coins to follow!
Uniswap entering the FX market , slashing costs by a projected 80%! (6)
European Investment Bank (EIB) launches successful digital bond on Ethereum Blockchain (7)
Ethereum crossing over 100 million unique wallets (8)
Ethereum has more developers working on it then any other chain, with 16% of all new entrants building on ETH
Ethereum validators surged to 500,000 ! Shanghai upgrade is not even out yet.
The ETH protocol is not censor resistant , so while there are many OFAC-compliant blocks- validators are not forced to comply.
ETH is ESG Friendly , while Bloomberg warns Bitcoin is still being powered by China Coal (bad optics with energy prices in Europe recently) (9)
ETH is deflationary (Bitcoin & the USD are INFLATIONARY) (10)
The good news goes on & on - as I have not even gone over ZK Rollups, Scaling, Sharding etc.
Scarcity + Demand = Prices Rising
So what does all this mean fundamentally? Due to the burning mechanism in the protocol - with heavier adoption their is more burn. More burn means more scarcity. Inflation increases supply, this protocol decreases the supply through swaps. With central banks and 9 TRILLION moved on chain from USDC alone (not even accounting for DAI, USDT, or BUSD - the Binance stable coin is a also an ERC-20 token) adoption is rising We will see more stable coins continuing to increase adoption resulting in more eth burning.
When it comes to price:
Deflation>Inflation
Adoption is growing on this network. There is real value, there is real TVL.
Since the merge...
-->BTC Supply GREW by 110 BTC ($2.5B)
--> ETH Supply SHRUNK by 2,830 ETH ($4.5M)
Bitcoin/Ethereum Commentary
I have had angry direct messages in the past advising how Bitcoin is PROTECTION against inflation, how could it inflate if the supply is capped?
Even with a capped supply that will be targeted in 140 years (generations) the BTC inflation rate is +1.716%/year.
To make the situation graver - the miners create constant selling pressure powering the energy intensive network, coupled with physical hardware that has to be purchased & maintained. This equates to costs.
To pay for costs, miners must sell bitcoin to keep the network safe - creating constant selling pressure.
If you have made it to this point, please let me know your thoughts!
If I am missing a key piece of information, or you find something shared as inaccurate, please point it out so the whole TradingView community can benefit from it.
Citation
1 - www.bloomberg.com
2 - www.rba.gov.au
3 - www.centralbanking.com
4 - www.investing.com
5 - www.circle.com
6 - uniswap.org
7 - www.eib.org
8 - www.tradingview.com
9 - www.bloomberg.com
10 - ultrasound.money

230122 - DXY study in currency debasement.Thesis:
Increased Central Banks' balance sheets leads to currency debasement.
Following from previous study into the increase in the Central Banks' Balance sheet.
Chart:
DOLLAR INDEX WITH MAJOR CURRENCIES OVERLAID.
To track %-changes of each currency relative to the US-Dollar 1/ from 1976 (removal of last tethers of gold standard) and 2/ from 2016. 'Strange' divergencies in currency valuations around that time. (Different timescales lead to different %-changes - provides further insights)
All currencies above DXY: cheaper than USD. Everything below, more expensive.
Conclusions:
The @federalreserve may be printing US$ are the rate of knots, but EUR, JPY CHF and GBP do the same, to varying degrees.
The currency debasement is relative. As currencies are measured against another currency, if the Principal is not depreciating as much as the counter party, the debasement is not as serious. I don't know if I can draw the conclusion that this is only true in international trade. Domestically, the counterparty depreciation doesn't matter, if the principal depreciates, there's inflation domestically.
GBP has expanded balance sheet the most, followed by EUR.
CHF appreciated most
JPY has expanded the least, hence the depreciation of JPY since 2021. Sudden reversal since 2023 - trouble in JPY bond market, as depreciation of currency leads to smaller bond returns.
THE FEDERAL RESERVE HAS A REPUTATION ON SOCIAL MEDIA FOR PRINTING MONEY, BUT IT APPEARS THEIR POLICY IS VERY MUCH MIDDLE OF ROAD.
How to trade this
I am guessing that Bank of Japan will want the JPY to return to normal levels, to fix bond market.

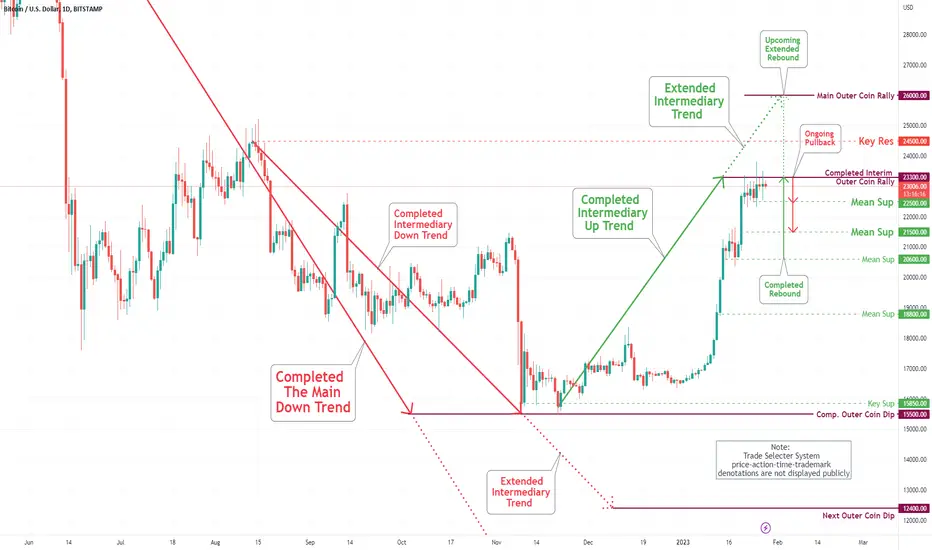
Bitcoin (BTC/USD) Daily Chart Analysis For Week of Jan 20, 2023Technical Analysis and Outlook:
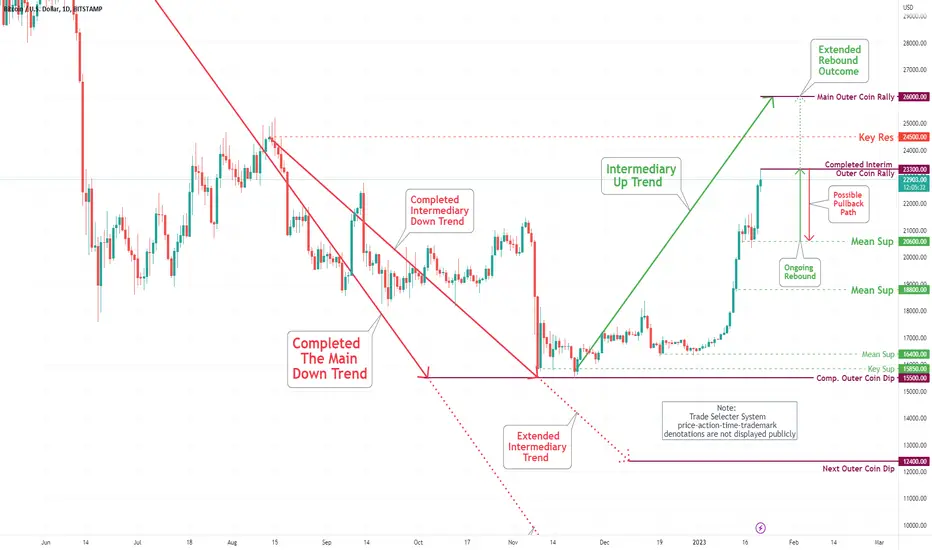
Bitcoin completed the Outer Coin Rally of $21,200 and Key Res $ 21,300 on January 14 and stayed very near the outcome throughout the week - busting through on Friday with follow-through on Saturday to complete the interim Outer Coin Rally of $23,000 (Not shown 60 min chart). The pending confirmation is in the process - Once confirmed, the pullback to Mean Sup $20,600 is inevitable. Once this puppy settles down, we will see a resurgence on the upside to finalize the Outer Coin Rally of $26,000.
230117 - Who's Tapering and Who's Not. I have to re-visit this. I am struggling to get 2 charts on the screen. Sorry for the dealy.
If the sell-off on Dow Jones, or the rally on Gold have anything to do with tapering the Central Banks' Balance sheets, they have a lot to talk about in Davos.
Notice the Difference between the M3 and Central Banks' Balances.
BOTH IS RELATIVE AND REAL TERMS.
Tapering is nigh impossible

Bitcoin (BTC/USD) Daily Chart Analysis For Week of Jan 13, 2023Technical Analysis and Outlook:
Bitcoin surged above $21,000 on Saturday for the first time in two months as the crypto rammed through our Mean Res $17,000, Mean Res $17,800, Mean Res $18,500, and Outer Coin Rally $19,100 throughout the week. The price action signifies a completed Outer Coin Rally of $21,200 (Not shown - 60 min chart) and significant Key Res $21,300 first introduced Bitcoin Daily Chart Analysis For Week of Nov 11. We expect a pullback to the newly created Mean Sup of $18,800. Once this puppy settles down, we will see a resurgence on the upside to retest the Outer Coin Rally of $21,200.

WHAT HAPPENED WITH JPY?Hello guys! Here is a quick summary of what happened in the market today, especially in the Japanese one, after the Bank of Japan surprised everyone.
On Tuesday, the Bank of Japan made its first move towards a shift away from ultra-loose monetary policy after weeks of speculation. As part of an adjustment to its yield curve control policy, the BoJ decided to increase the range of its target for the yield on 10-year government bonds from +/- 25 basis points to +/- 50 basis points. Despite this change, the Bank kept its short-term policy rate at -0.1% and maintained its commitment to easing in its statement. In fact, the BoJ plans to increase its purchases of Japanese government bonds in the coming quarter, from 7.3 trillion yen per month to 9 trillion yen.
The Bank of Japan's policy adjustment was more hawkish than financial markets had anticipated, and contributed to the yen's further recovery from a 30-year low reached this October. A stronger yen may provide some relief to the Japanese economy, which has been grappling with the high cost of imports due to the sharp decline in the value of the yen this year.
As the possibility of more hawkish central bank actions and a potential recession in 2023 increased, the value of Asian currencies against the US dollar decreased further and risk appetite remained low. While the US dollar strengthened against most Asian currencies, the strength of the yen, euro, and pound weighed on the dollar index and dollar index futures.
What do you think about the BoJ's move? FX:USDJPY FX:USDJPY BMFBOVESPA:JPY1! PEPPERSTONE:JPYX

230112- Relation (1) interest rate, (2) Treasury Yield, (3) oil U.S. INTEREST RATES vs TREASURY YIELD vs OIL PRICE
Timeframe: 1 month. start: 1972
Blue line: interest rates (USINT)
Orange area: 10-year U.S. Treasury Bond Yield (IRLTLT01USM156N)
Green Line: oil (scale on the left)
(A) WHEN INTEREST RATES ARE ABOVE BOND YIELD,
(1) it sparks a financial crisis: 1990, 2000, 2008, 2019
(2) it is followed by a spike in oil price.
(3) on smaller timescale, oil price rises and falls with increases and decreases in Treasury Yields.
(B) OBSERVATIONS ON INTEREST RATE:
(1) Interest Rates have been falling since 1980
(2) Treasury Yields have been declining since 1980
(3) It appears, the Federal Reserves strives for a 5% interest rate. It drops interest rates FAST when the market is too hot, and builds up slowly again, attempting to meat the 5% arbitrary target.
(4) As time goes on the Federal Reserve is more cautious in raising interest rates.
BUT MOST RECENT RAISES IN INTEREST RATE ARE ALL BUT SLOW.
s3.tradingview.com

How to use ECONOMIC INDICATORS for informed trading decisionsHello everyone! Here you have some information that I consider useful on how to interpret and use economic indicators and data to make informed trading decisions in the foreign exchange market:
GDP (Gross Domestic Product) - GDP is a measure of a country's economic output and is considered to be one of the most important indicators of economic growth. A higher GDP indicates a stronger economy, which can lead to an increase in demand for the country's currency.
Unemployment Rates - Unemployment rates measure the percentage of the workforce that is currently without a job. A low unemployment rate indicates a strong economy, which can lead to an increase in demand for the country's currency.
Inflation - Inflation measures the rate at which the average price level of a basket of goods and services in an economy is increasing. High inflation can lead to a decrease in demand for the country's currency, while low inflation can lead to an increase in demand.
Interest Rates - Interest rates are the cost of borrowing money and are set by central banks. High interest rates can attract foreign investment, leading to an increase in demand for the country's currency.
Trade Balance - The trade balance measures the difference between a country's exports and imports. A positive trade balance indicates that a country is exporting more than it is importing, which can lead to an increase in demand for the country's currency.
Political Stability - Political stability is an important factor to consider when trading in the foreign exchange market. A stable political environment can lead to an increase in demand for a country's currency, while political instability can lead to a decrease in demand.
In summary, GDP, unemployment rates, inflation, interest rates, trade balance and political stability are important economic indicators to keep an eye on when making trading decisions in the foreign exchange market. By considering these indicators, along with other market conditions, traders can make more informed decisions about when to buy or sell a particular currency.
Please note that the above information is not a financial advice and only for educational purpose, Economic indicators are important but not the only factor to consider while making trading decisions and It's always important to do your own research and consider your own risk tolerance before making any trades.

Long USD short AUD due to long term growth constraint Long USD
Governor: Jerome H. Powell
Monetary Policy: Monetary policy in the United States comprises the Federal Reserve's actions and communications to promote maximum employment, stable prices, and moderate long-term interest rates--the economic goals the Congress has instructed the Federal Reserve to pursue.
o Sentiment: Bullish
o Rate Decision: 1%
o Current Rate: 0.33%
o Rate Differential: 1.67%
o Inflation Target: 1%
o Current Inflation Rate: 8.54%
o Statement Summarized: The US Fed will make MoM interest rate adjustments if inflation continues to persist, Unemployment maybe down however certain labor participates refuse to work in supply, logistics and or overall labor primarily due to the pay and work conditions
o Short Term Bias: U.S. Retail Sales will provide a adequate entry due to the higher the average volatility that will take place on that day due to the consensus that sales will be down, Indicating a temporally deprecation of the USD dollar.
o The Average Daily Range (ADR): 20 Pip
o Possible Opportunities 1: Although overall economic activity edged down in the first quarter, household spending (Consumer Staples) and business fixed investment (Bonds) remained strong. Job gains have been robust in recent months, and the unemployment rate has declined substantially (Indicator 1- Interest Rate Hike). Inflation remains elevated, reflecting supply and demand imbalances related to the pandemic, higher energy prices, and broader price pressures (Labor Constraints and wage increases).
o Possible Opportunities 2: The invasion of Ukraine by Russia is causing tremendous human and economic hardship. The implications for the U.S. economy are highly uncertain (Fear, reserve currency). The invasion and related events are creating additional upward pressure on inflation and are likely to weigh on economic activity. In addition, COVID-related lockdowns in China are likely to exacerbate supply chain disruptions (Labor Constraints and Zero Covid Policy). The Committee is highly attentive to inflation risks
o Possible Opportunities 3: The Committee would be prepared to adjust the stance of monetary policy as appropriate if risks emerge that could impede the attainment of the Committee’s goals. The Committee’s assessments will consider a wide range of information, including readings on public health, labor market conditions, inflation pressures and inflation expectations, and financial and international developments.
Short AUD
o Governor: Philip Lowe
o Monetary: In determining monetary policy, the Bank has a duty to contribute to the stability of the currency, full employment, and the economic prosperity and welfare of the Australian people. To achieve these statutory objectives, the Bank has an ‘inflation target’ and seeks to keep Consumer Price Inflation in the economy to 2–3 per cent, on average, over the medium term. Controlling inflation preserves the value of money and encourages strong and sustainable growth in the economy over the longer term.
o Sentiment: Neutral
o Rate Decision: RBA is primarily concerned with CPI
o Current Rate: 0.35%
o Rate Differential: %
o Inflation Target: 2-3% Average
o Current Inflation Rate: 5.1%
o Rate Differential: 2-3%
o Statement Summarized: RBA is primarily concerned with bringing down inflation however it will not add to its QE policy nor will it reverse its holdings of bonds on their Balance Sheet
o Balance Sheet activity: Will not sell current QE assets not are they reinvesting earnings. (Holding)
o Market Sentiment: (Two weeks of charts from the start date after Fed meeting)
o Short Term Bias: (Last for 1 day great for entry and exit)
o The Average Daily Range (ADR):
o Possible Opportunities 1: The outlook for economic growth in Australia also remains positive, although there are ongoing uncertainties about the global economy arising from: the ongoing disruptions from COVID-19, especially in China; the war in Ukraine; and declining consumer purchasing power from higher inflation. The central forecast is for Australian GDP to grow by 4¼ per cent over 2022 and 2 per cent over 2023. Household and business balance sheets are generally in good shape, an upswing in business investment is underway and there is a large pipeline of construction work to be completed. Macroeconomic policy settings remain supportive of growth and national income is being boosted by higher commodity prices.

Bitcoin (BTC/USD) Daily Chart Analysis For Week of Jan 6, 2023Technical Analysis and Outlook:
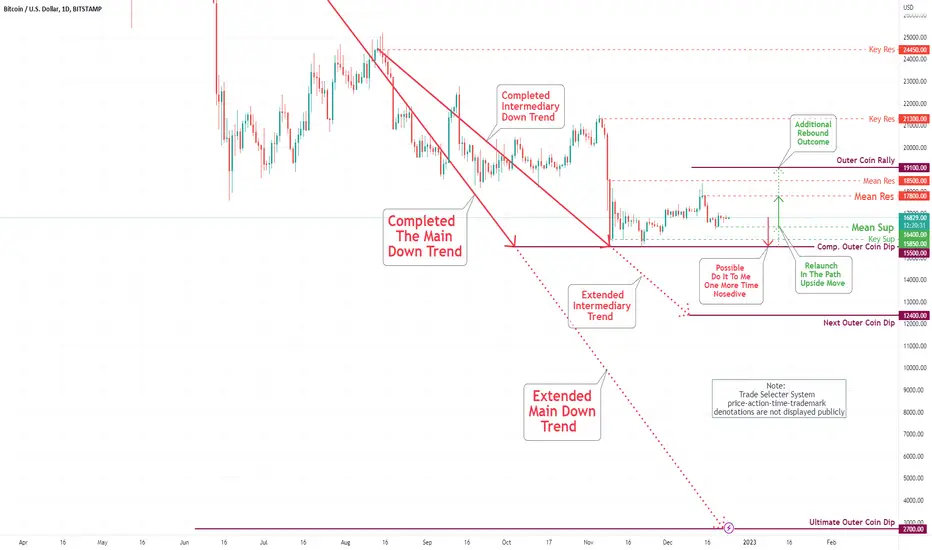
Bitcoin bounced closer to our Mean Res $17,000 throughout the week. The retest of the Key Sup $15,850 is a toss-up. This puppy may break from the current position to create upward action to Mean Res $17,800, Mean Res $18,500, and Outer Coin Rally $19,100.

Bitcoin (BTC/USD) Daily Chart Analysis For Week of Dec 30, 2022Technical Analysis and Outlook:
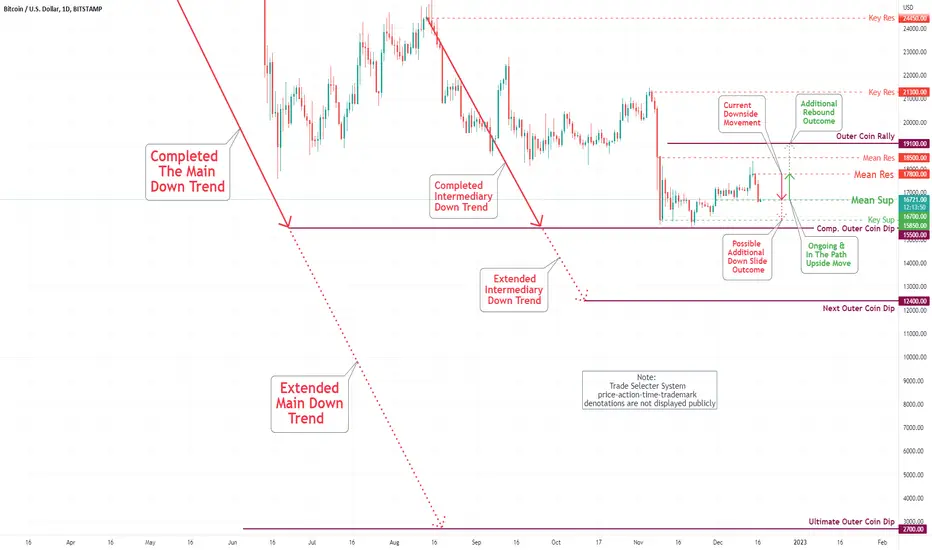
Bitcoin decanted closer to our Mean Sup of $16,400 throughout the week. The retest of the Key Sup $15,850 is a high probability at this time. The upward movement to retest newly created Mean Res $17,000 extending to Mean Res $17,800, Mean Res $18,500 is pending on the hitting Key Sup $15,850. However, be aware there is the possibility that this puppy may break from the current position to create upward action as specified above.

Bitcoin (BTC/USD) Daily Chart Analysis For Week of Dec 23, 2022Technical Analysis and Outlook:
Bitcoin stays put above our Mean Sup of $16,400. The upward movement is in the process to Mean Res $17,800, extending to Mean Res $18,500 with high degree aftermath. The retest of the Key Sup $15,850 is continuously low at this time, pending the above scenario being played out.
clear outflow for good reason in yendollar yen is getting absolutely demolished. boj is structuring the slaughter of yen, and its having tremendous consequences. look for this to continue.

THE IMPACT OF INTEREST RATES ON FOREX MARKETHello again! Interest rates can have a significant impact on the forex market , as they can affect the demand for and supply of different currencies. In general, higher interest rates tend to attract foreign investment and increase the demand for a currency, as investors can earn a higher return on their investments. This can lead to an appreciation of the currency in the foreign exchange market.
On the other hand, lower interest rates may discourage foreign investment and reduce the demand for a currency, leading to a depreciation of the currency in the forex market.
Interest rates can also affect the attractiveness of a country's assets, such as stocks and bonds, which can in turn affect the demand for its currency. For example, if a country has high interest rates, its assets may be more attractive to foreign investors, leading to an increase in demand for the country's currency.
In addition to the interest rate level, the direction and pace of change in interest rates can also affect the forex market. If a central bank is expected to increase interest rates in the near future, it may lead to an appreciation of the currency, as investors anticipate higher returns on their investments. On the other hand, if a central bank is expected to lower interest rates, it may lead to a depreciation of the currency.
Overall, the relationship between interest rates and the forex market is complex and can be influenced by a variety of factors, including economic conditions, inflation expectations, and global market conditions.

ECONOMIC CYCLE & INTEREST RATESHello traders and future traders! The state of an economy can be either growing or shrinking. When an economy is growing, it typically leads to improved conditions for individuals and businesses. Conversely, when an economy is shrinking or experiencing a recession, it can have negative consequences. The central bank works to maintain a stable level of inflation and support moderate economic growth through the management of interest rates.
What is an economic cycle?
An economic cycle refers to the fluctuations or ups and downs in economic activity over a period of time. These cycles are typically characterized by periods of economic growth and expansion, followed by periods of contraction or recession. Economic cycles are often measured by changes in gross domestic product (GDP) and other economic indicators, such as employment, consumer spending, and business investment.
Economic cycles can be caused by a variety of factors, including changes in monetary and fiscal policy, shifts in consumer and business confidence, and changes in global economic conditions. Economic cycles can also be influenced by external events, such as natural disasters or political instability.
Understanding economic cycles is important for businesses, governments, and individuals, as it helps them anticipate and prepare for changes in the economy and make informed decisions about investment, hiring, and other economic activities.
How is an economic cycle related to interest rates?
Interest rates can be an important factor in the economic cycle . During a period of economic expansion, demand for credit typically increases, as businesses and consumers borrow money to make investments and purchases. As a result, interest rates may rise to control the demand for credit and prevent the economy from overheating. Higher interest rates can also encourage saving, which can help to balance out the increased spending that often occurs during an economic expansion.
On the other hand, during a period of economic contraction or recession, demand for credit tends to decline, as businesses and consumers become more cautious about borrowing and spending. In response, central banks may lower interest rates to stimulate demand for credit and encourage economic activity. Lower interest rates can also make borrowing cheaper and more attractive, which can help to boost spending and support economic growth.
Overall, the relationship between interest rates and the economic cycle can be complex and dynamic, and the direction and magnitude of changes in interest rates can depend on a variety of factors, including economic conditions, inflation expectations, and the goals and objectives of central banks and other policy makers.
I hope you leant something new today!

Bitcoin (BTC/USD) Daily Chart Analysis For Week of Dec 16, 2022Bitcoin diligently retreated to our Mean Sup $17,600 as specified on Bitcoin (BTC/USD) Daily Chart Analysis For the Week of Dec 9. The upward movement is in the process to newly created Mean Res $17,800, extending to Mean Res $18,500 with a high degree aftermath. The retest of the Key Sup $15,850 is the low probability at this time, pending the above scenario being played out.
S&P in EUR present Wyckoff distributionS&P (in this chart ES futures) divided by EURUSD (in this chart Euro futures):
The whole of 2022 could be Wyckoff distribution, now entering Phase C, the shortest phase.
To confirm the pattern and continuation to phase D, look for:
Fed hike less aggressively in 2023
ECB hike more aggressively in 2023
A move up in EUR (a move down in DXY)
A move down in ES/SPY/SPX
ideally no later than the end of December.
Motivation:
European investors are likely overweight US stocks in 2022.
It is important to understand the price of S&P 500 in EURO as it is the cheaper currency to borrow.
Macroeconomic trends suggest distribution rather than accumulation.

GBPUSD: How to read the fundamentals?GBPUSD is ahead of an important week of CPI meeting in Tuesday and FOMC on Wednesday. if inflation remains under control we can expect fed to slow down the rate hikes more likely 50 bps the coming week and 25 bps early next year which should trigger USD bears and that's what we expect as well based on the last CPI data. Otherwise if CPI is above expectations we can expect the opposite Scenario and more of a strong Dollar and a hawkish FOMC.
when Good fundamentals meet good technicals then there is a good probability for your trade to go in your direction but always keep in mind that trading is a field of probabilities and since everything could happen a proper risk management should be taken in consideration. my recommendation is to risk 1% per trade so that will allow you to stay in the market the longest possible and will help you to compound your account as well. Otherwise if you risk 20% per trade then 5 losing trades in a row will knock you out of the market. And you don't want that to happen so you should stick to proper risk management of always risking small and aiming high.
if you have any question please don't hesitate to ask in the comment section. i'm happy to interact and answer to all!
