FOMC Meeting Next Week: Bank of America Expects 50bp Rate Hike The Federal Open Market Committee (FOMC) is set to meet next week, and investors are eagerly anticipating the outcome of the meeting. Bank of America Global Research has discussed its expectations for the meeting, saying that it expects the Fed to raise its target range for the federal funds rate by 50bp in December to 4.25-4.5%.
According to Bank of America, the Fed has telegraphed this move over the last few weeks through its communications. However, the more important question is where the Fed will go next. Bank of America expects the median forecast for 2023 to move up by 50bp to 5.125%, which is consistent with its terminal rate. The bank also expects the dot plot to show 100bp of cuts each in 2024 and 2025.
In addition, Bank of America expects the macro projections in the Statement of Economic Projections (SEP) to be revised to show lower GDP growth and inflation than in September, and higher unemployment.
At the press conference following the FOMC meeting, Bank of America expects Chair Powell to push back against easing in financial conditions and remind investors that a slower pace of hikes does not mean a lower terminal rate. The bank believes that Powell will stress that the Fed's job is far from done.
Overall, Bank of America expects the FOMC meeting next week to be consistent with the Fed's previous communications and for there to be no major surprises or shifts in policy.
Some Jargon Explained
The Dot Plot
The dot plot, also known as the Summary of Economic Projections (SEP), is a visual representation of Federal Reserve policymakers' individual forecasts for where they think key interest rates will be in the coming years. The dot plot shows the central tendency, or the middle of the range, of the individual forecasts for the federal funds rate.
Each participant in the FOMC meeting provides their own individual forecast for the federal funds rate at the end of each calendar year, as well as over the longer run. These forecasts are then plotted on a chart, with the dots representing the individual forecasts and the lines connecting the dots indicating the median of the group's forecasts.
The dot plot is released four times per year, along with the FOMC's policy statement, and provides insight into the collective thinking of FOMC members about the future path of interest rates. It is an important tool for investors to gauge the future direction of monetary policy.
The Terminal Rate
The terminal rate, also known as the long-run federal funds rate or the equilibrium real interest rate, is the interest rate that the Federal Reserve believes is consistent with the long-run health of the economy. It represents the level of the federal funds rate that is neither expansionary nor contractionary and is expected to prevail in the long run, once the economy has reached its full employment and price stability goals.
The terminal rate is not a fixed number, and can change over time depending on a variety of factors such as changes in the underlying productivity and demographic trends of the economy. The Federal Reserve uses the terminal rate as a reference point when setting its short-term interest rate targets.
In general, the terminal rate is expected to be lower than the current federal funds rate, as the Fed typically raises interest rates in the short run to prevent the economy from overheating and then lowers them in the long run to support economic growth. This means that the terminal rate can provide important information about the future direction of monetary policy.
Macroeconomic Analysis And Trading Ideas

Bitcoin (BTC/USD) Daily Chart Analysis For Week of Dec 2, 2022Technical Analysis and Outlook:
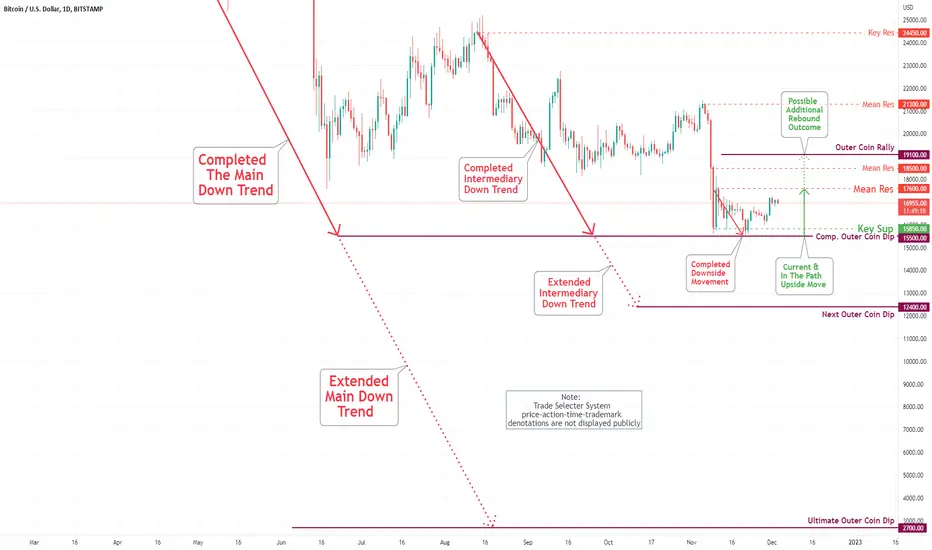
Bitcoin continuously (Slowly) advancing towards our leading destination of the Mean Res $17,600 and subsequently to the Outer Coin Rally of $19,100. The down-trend retest to Key Sup $15,850 is low at this time, pending the above scenario being played out. The next Outer Coin Dip of $12,400 outcome in the foreseeable future is pending.
Bitcoin (BTC/USD) Daily Chart Analysis For Week of Nov 25, 2022Technical Analysis and Outlook:
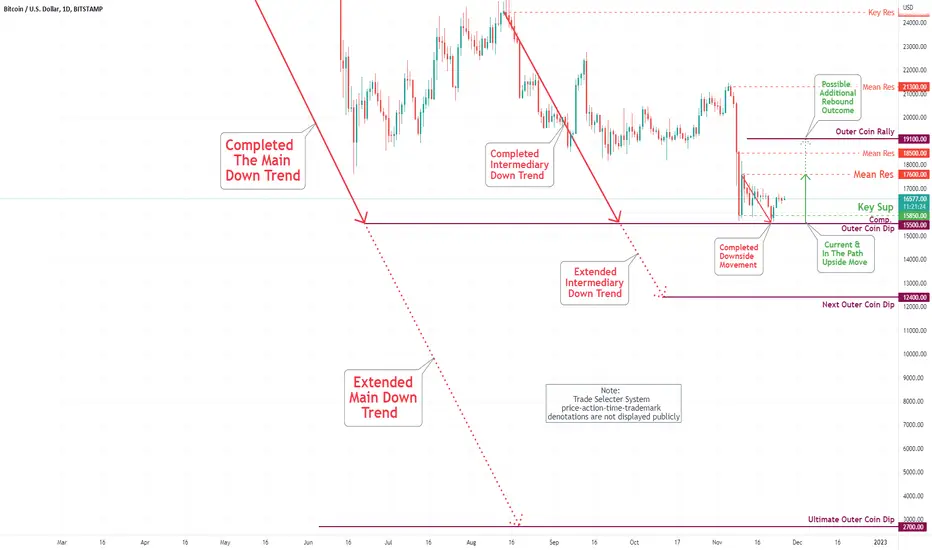
Bitcoin has repeated bounce from our Key Sup $15,850 on Nov 21. The coin is currently positioned to punch to the Mean Res $17,600 and subsequently to Outer Coin Rally $19,100. The down-trend projects for the next Outer Coin Dip of $12,400 in the foreseeable future are being delayed.
The RBNZ could push AUD/NZD down to the 1.07 and 1.06 handlesIf the RBNZ hike by 75bp tomorrow in line with the consensus, it will be their first hike of this magnitude on record. It would also mean they have to upgrade their terminal rate of their OCR projection, which could be deemed as a hawkish hike by markets and send NZD higher against other currencies. Of course, this also leaves the Kiwi dollar to weakness should the RBNZ surprise markets with a 50bp hike tomorrow.
As things stand, the RBA are expected to hike in 25bp increments and have even spoken of a potential 'pause' in rate hikes. This means RBNA remain the more hawkish than the RBA. This has allowed AUD/NZD to develop a nice bearish trend on the daily chart with timely swing highs, and prices are now on the cusp pf breaking lower and heading for 1.0700 and 1.0612. Unless we see a surprise 50bp hike tomorrow, the path of resistance appears lower for the cross and bears could seek to fade into rallies or short a break of new lows.
- Initial target is 1.0700, then the 1.0612 low.
- The bias remains bearish below 1.0900.

Bitcoin (BTC/USD) Daily Chart Analysis For Week of Nov 18, 2022Technical Analysis and Outlook:
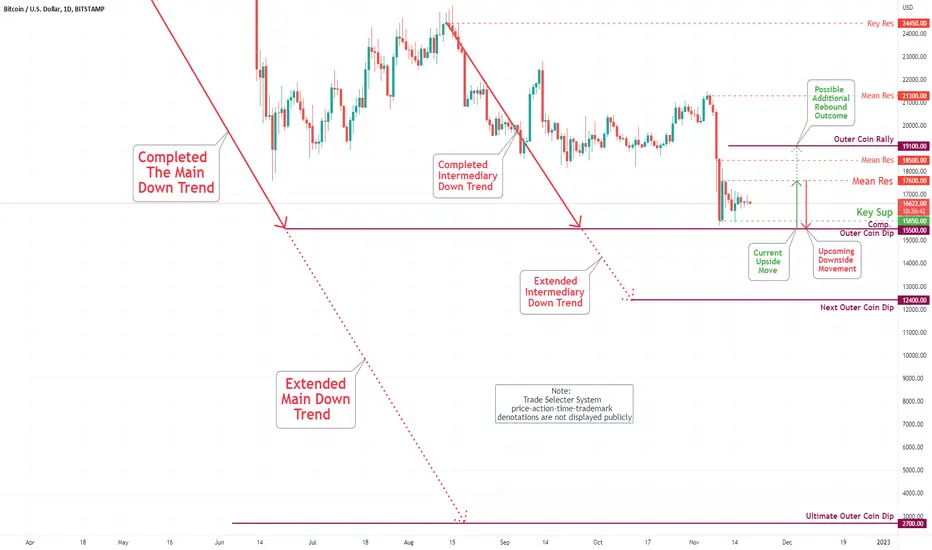
Bitcoin has repeated bounce from our Key Sup $15,850 on Nov 14. The coin is currently positioned itself to hit the Key Sup $15,850 and completed the Outer Coin Dip marked at $15,500, launching sharp upside movement to Mean Res $17,600 and Outer Coin Rally $19,100. The down-trend projects for the next Outer Coin Dip of $12,400 in the foreseeable future is being shelved for now.
Bitcoin (BTC/USD) Daily Chart Analysis For Week of Nov 11, 2022Technical Analysis and Outlook:
Bitcoin has completed our designated Outer Coin Dip of $15,500, as shown since Bitcoin Daily Chart Analysis For June 17. As a result, a massive rally was staged, creating Mean Res $17,600 launching from Key Sup $15,850 for an upcoming upside move with an additional Outer Coin Rally marked at $19,100. The down-trend projects the next Outer Coin Dip of $12,400 in the foreseeable future.

Bitcoin (BTC/USD) Daily Chart Analysis For Week of Nov 4, 2022Technical Analysis and Outlook:
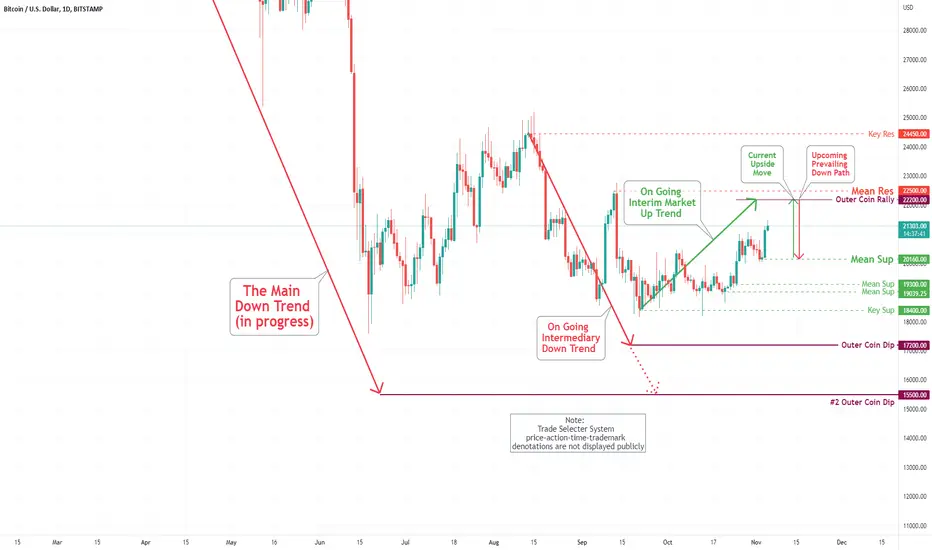
Bitcoin has completed the retest of our Mean Sup $20,300 (As sown on Bitcoin Daily Chart Analysis For the Week of Oct 28) and, as a result, pushed a breakout via Mean Res $20,800 heading towards our designated Outer Coin Rally $22,200 and Mean Res $22,500. The down path shows us a retracement to Mean Sup $21,160 and beyond in the foreseeable future.
NFP 261K is mid!
2016-2017 NFP Average = 168k (Trump Era)
2017-2018 NFP Average = 198k
2018-2019 NFP Average = 164k
2019-2020 NFP Average = -796k (COVID-19)
2020-2021 NFP Average = 474k (Biden Era)
2021-2022 NFP Average = 410k
There was a time when 261k would have been outstanding, but following on from the big job reset in 2019/2020 the average was above 400k.

Bitcoin (BTC/USD) Daily Chart Analysis For Week of Oct 28, 2022Technical Analysis and Outlook:
Bitcoin has completed a market rebound by producing medium strength Mean Res $20,800 with the continuous outcome mark at Outer Coin Rally of $22,200. The down path shows us a retracement to Mean Sup $20,300 and possibly all the way down to Mean Sup $19,300.

💶💴EUR/JPY The rally is not over yet💶💴EUR/JPY The rally is not over yet.
💶Euro is showing signs of strength in the current week.
💶 Looking at the Unemployment rate in the Eurozone, it stands at 6.6%, the lowest on record.
💶Inflation is already close to 10% and on the 31st when the flash year-on-year reading is forecast to be 10.1%
💶Interest rates have been raised by 75 basis points and the market is betting on another 75 point hike to 2%. The decision will be made on Thursday 27 October.
💶The consumer sentiment indicator which is off its lowest levels in years has started to rise slowly and the market expects the positive trend to continue in the coming months. There will be another reading on 28 October.
💶💴On the other side of the globe.
💴In Japan, no change.
💴Unemployment Rate low at 2.5%
💴Inflation low 3%. Japan is one of those countries that has not been hit by Inflation as much as Europe and the USA.
💴Interest rates at -0.1%. Still negative from 2016. Hence these falls in the Yen. When other countries raise rates causing their currencies to strengthen, their strength against the Yen increases.
💴For now, there are no increases on the horizon. The Bank of Japan says it has no intention of changing its monetary policy.
💴But the government doesn't want the Japanese Yen so cheap either, hence in recent days we have seen sharp falls which were interventions to stop the Yen weakening sharply against other currencies.
💴I don't think this will stop investors from pushing prices up again.
Turning to the chart.
📈It probably doesn't need to be told to everyone that we have been in an uptrend since 2000.
📈In the last few days, after the interventions and the attempt to dump the price which was momentarily pushed upwards. This took place at support levels zoned between 143 and 145.
📈 We do not see any signs that the price is going to make any correction in the coming days seeing such big pullbacks on the 1D candles.
📈In order to determine the target we move to the 1M chart.
📈Where after measuring the 2 biggest downward waves using fibo. We come out with a cluster at levels of 160 which seems a very likely scenario if the policy of the central bank of Japan remains unchanged and we enter a time of growths on the Euro.
📈Entering at the current moment and setting a stop below the recent price pullbacks after the interventions with a take profit at the 160 level brings out our best profit/risk ratio so far since I've been posting at.
🚀If you appreciate my work and effort put into this post I encourage you to leave a like and give a follow on my profile.🚀


CENTRAL BANKS PARTIAL ECLIPSE PERIODCENTRAL BANKS ARE PLAYING THEIR CAT & MOUSE GAME. IF ANY CENTRAL BANK COMES OUT WITH A PIVOT THIS WEEK $DXY WILL WASH RIGHT OUT OF THIS FLOOR.
It's hump day... 109's will be enticed, trapped, and move either direction... up or down will depend on which Central Bank pivots.
Which Central Bank will it be is the question.
#25Sigma
#PivotJungle

Bitcoin (BTC/USD) Daily Chart Analysis For Week of Oct 21, 2022Technical Analysis and Outlook:
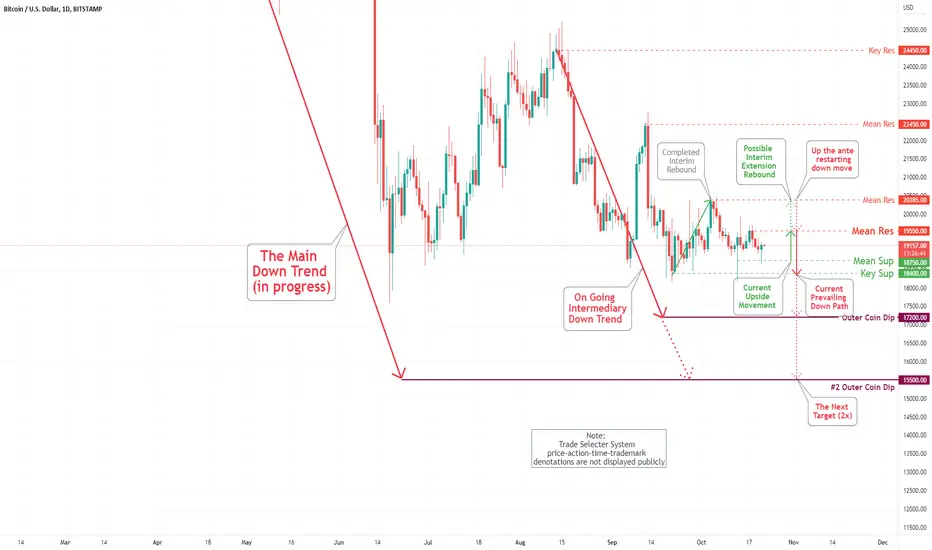
The Bitcoin is churning between our Mean Res $19,550 and Mean Sup $18,750. As specified on the Bitcoin (BTC/USD) Daily Chart Analysis For October 14, the possibility of moving to the Outer Coin Dip of $17,200 and extending the overall outcome to the #2 Outer Coin Dip at $15,500 is in the process. Reaching out in the short-term to the Mean Res $19,550 and possibly Mean Res $20,385 is blowing hot and cold.
Timing the bond markets meltdownIs the UK bonds or the gilts the culprit that trigger the global bond markets meltdown? Not exactly. In fact, in April this year, there were clear signals that the global bond markets were already in trouble, and we will discuss that.
Content:
• Why we should not blame it on the U.K bonds, then who?
• How to overcome this global bond crisis?
Disclaimer:
• What presented here is not a recommendation, please consult your licensed broker.
• Our mission is to create lateral thinking skills for every investor and trader, knowing when to take a calculated risk with market uncertainty and a bolder risk when opportunity arises.
US T-Bond Futures:
1/32 of one point
= US$31.25
32/32 is one point
= 32 x US$31.25 = US$1,000
123 to 122 = 1 point
= US$1,000
CME Real-time Market Data help identify trading set-ups in real-time and express my market views. If you have futures in your trading portfolio, you can check out on CME Group data plans available that suit your trading needs www.tradingview.com

USDJPYLong:
- USD strength/Yen weakness (QT in US/QE in Japan)
- Global USD shortage (foreign governments need USD = Bullish)
Price Target(s): 160.00
** If 160 is broken, 180.00 next level to watch **

Bitcoin (BTC/USD) Daily Chart Analysis For Week of Oct 14, 2022Technical Analysis and Outlook:
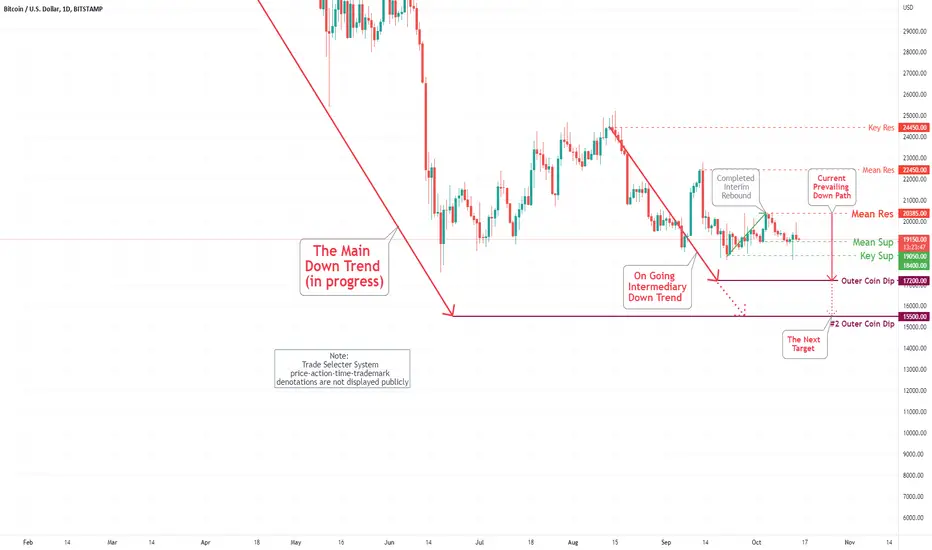
The Bitcoin completed down movements to targets of Mean Sup $19,050 and Key Sup $18,400 as specified Bitcoin (BTC/USD) Daily Chart Analysis For October 7, with the possibility of extending to the prevailing move to #2 Outer Coin Dip at $15,500 is much greater at the current market sentiment. The case of the short-term upside move to the Mean Res $20,385 is low.
Bitcoin(BTC/USD)Daily Chart Analysis For Week of October 7, 2022Technical Analysis and Outlook:
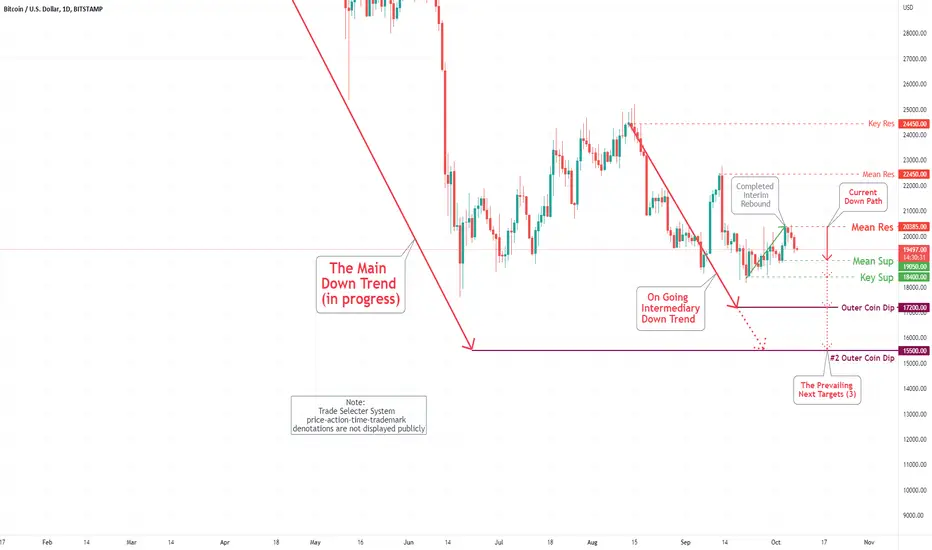
The Bitcoin completed our interim rebound as specified Bitcoin (BTC/USD) Daily Chart Analysis For September 30. On the downside, the main target is our newly created Mean Sup $19,050, Key Sup at $18,400, and the next Outer Coin Dip at $17,200, with the possibility of extending to the prevailing move to #2 Outer Coin Dip at $15,500 - There are possible short-term upside moves to Mean Res $20,385.
The SNB could surprise (again) with a larger than expected hikeThe SNB (Swiss National Bank) are expected to hike interest rates tomorrow, which would send their rate above zero for the first time since 2011.
The central bank entered ZIRP (zero interest rate policy) between 2011 – 2015 before switching to NIRP (negative interest rate policy) with a rate of -0.75%, where it remained until June this year. And with seemingly few paying attention, they not only hiked rates but came out swinging with a 50bp hike and sent shockwaves across currency markets. This quickly saw the yen strengthen as traders assumed the BOJ would be next to follow, but we’re still waiting and will likely be for some time. But the main point I am making is that the SNB are likely to hike again tomorrow, and it would be wise to at least be prepared for a larger hike than some expect.
A 50, 75 or even 100bp hike could be on the table for the SNB
A recent poll saw economists up their 50bp hike for the SNB to 75bp. But in light of Sweden’s Riksbank hiking by 100bp, wholesale prices in Germany exploding higher and the potential for the Fed to hike by 100bp, I’m not discounting the potential for the SNB to join to 100bp club. Besides, they hiked by 50bp when the consensus was for no change at all and have a track record with an element of surprise. Furthermore, the Swiss government upgraded 2022 CPI from 2.5% to 3%, and for 2023 from 1.4% to 2.3% - so perhaps they know something we don’t.
CHF/JPY daily chart:
There are fewer finer examples of a strong bullish trend on a currency chart, than CHF/JPY right now. Momentum has been increasing during each impulse move higher, the moving averages are in ‘bullish sequence’ and fanning out, and prices are respecting the closest average as support.
Prices have been coiling up within a falling wedge pattern (bullish in an uptrend) and potentially printed its swing low this week at the 10-day EMA. Furthermore, a 3-day bullish reversal pattern called a morning star has formed, so the bias remains bullish above this week’s low and for a move to the 150.71 high. A break above which brings 154 into focus.
However, even if prices break low we would still keep an eye out for a potential swing low, given the diverging policies between the SNB and BOJ.

Bitcoin (BTC/USD) Daily Chart Analysis For September 30, 2022Technical Analysis and Outlook:
The Bitcoin completed our interim rebound as specified Bitcoin (BTC/USD) Daily Chart Analysis For September 23. On the downside, the main target is our Key Sup at $18,400 and the next Outer Coin Dip at $17,200, with the possibility of extending to the prevailing move to #2 Outer Coin Dip at $15,500 - There are possible short-term upside moves.

Can I tell you about: The BoJ InterventionThe USDJPY had been climbing strongly especially as the price broke above the 140.50 resistance level to an overall high of 145.90. However, before the high of 145.90 was reached, the price had been resisted by the 145-round number resistance level.
On the 14th of September , as the USDJPY tested the 145 resistance level again, the Bank of Japan conducted a rate check, in apparent preparation for currency intervention. The signaling of the BoJ's intention to intervene in the Forex market saw the USDJPY trade lower towards the 142.50 support level.
On 22nd September , with the release of the BoJ monetary policy decision maintaining at -0.1% and failing to indicate an intervention from the BoJ, the USDJPY traded with significant volatility but eventually traded higher towards the 145.90 price level.
As the price hit the 145.90 price level, the BoJ announced that it had intervened in the foreign exchange market, to buy the yen for the first time since 1998, in an attempt to shore up the battered currency.
This saw the UDSJPY plunge to around 140.36 yen. However, as Finance Minister Shunichi Suzuki declined to disclose how much authorities had spent buying yen, whether other countries had consented to the move, and with no subsequent signs of further intervention, the Yen has almost completely retraced the reactionary plunge.
Currently trading below the 145 resistance level and the 78.60% fib level, the directional bias of the USDJPY is still heavily dependent on the strength of the USD and the overall volatility of the DXY. But it could be a while more before we see the USDJPY trade higher beyond the 146 resistance level.

Bitcoin (BTC/USD) Daily Chart Analysis For September 23, 2022Technical Analysis and Outlook:
Bitcoin prices continue to slide down: Currently, the crypto is targeting our Key Sup at $18,400 and the next Outer Coin Dip at $17,200, with the possibility of extending to the prevailing move to #2 Outer Coin Dip at $15,500. There is an isolated chance for a breakout to our Mean Res $20,200.

Bitcoin (BTC/USD) Daily Chart Analysis For September 16, 2022Technical Analysis and Outlook:
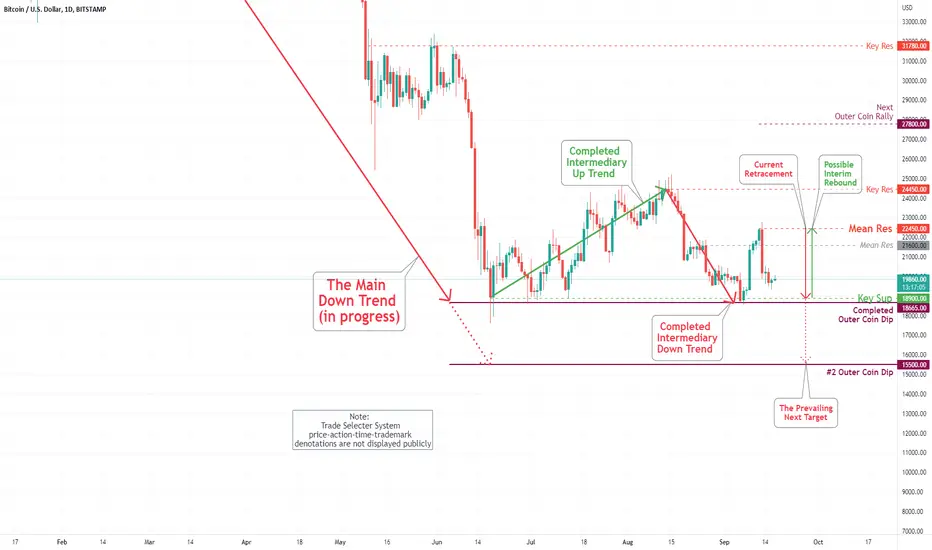
Bitcoin prices completed a rebound to our Mean Res $21,600 and some more as specified on ''Daily Chart Analysis For September 9''. Currently, the crypto is in the process of revisiting our Key Sup $18,900 and completed Outer Coin Dip $18,665 with the possibility of extending to the prevailing move to #2 Outer Coin Dip. There is a slight chance for a breakout to our Mean Res $22,450.
2 Year Treasury Bond Yield vs FED Funds RateThis post is intended to show the current gap between the market for the 2 year US treasury yield on bonds and the official funds rate, and why the market is forcing central banks hands into raising interest rates when the market is in such a fragile state in ability to support and maintain debt at heighten interest rate levels.
Simply put, bond market are crashing (i.e. no one wants to hold onto treasure bonds at present because they are yielding very little / people are losing faith in governments ability to uphold their debt obligations / competition in the market for credit is rising etc. etc). All these factors play into buying selling behavior and is repriced in the market.
As a bond or lone has a fixed bond or repayment structure ($amount), if the capital price the bond changes hand in the secondary market is lowered, the effective yield from the bond goes up. For example if a bond is made for $10,000 and requires a 10% interest rate (i.e. $1,000) per specified period, then if this loan / contract / bond (same thinking) is changed hands in the secondary market and sold for $5,000, the new own still receivers the conditions of the prior arrangement. Hence $1000 per period. As the price was $5,000, then the interest or Yield on that bond is now 20% (i.e. $1000 / $5000 x100 = 20%).
As new credit is competing against the secondary market (i.e. you could loan your money out to a new loan or you could buy an existing loan (Bond) on the secondary market), this is how the bond market drives interest rates.
Complicated but hope this makes sense.
in summary, falling bond prices cases rising yields or interest rates. Raising bond prices causes lower interest rates.
Central Banks play in this market as a market participant with an unlimited check book (this is how new base currency or M1 enters the market ( QE - Quantitative Easing) or is removed from the currency supply (QT - Quantitative Tightening ).
If Central Banks want interest rates to rise, they flood the market with bonds, dropping the market prices with excess supply and causing yields to rise. If they want interest rates to drop, they soak up supply in the market of bonds, causing prices to rice and yields (interest rates to drop).
This process is called 'Open Market Manipulation'. AKA planned market manipulation at it's best.
www.federalreserve.gov
The 'official funds rate' is just a forecast which shows how the Central Bank plans to manipulate the bond market until it's next meeting.
Interest rates on loans / bonds etc should be viewed as a measure of risk of default. High interest rates reflect the reward on offer for lending your currency out and the risk you will not get it back.
In short, Market conditions (such as inflation ) changes investors view on risk. When Central Bank manipulation of the bond market goes our of whack with the risk to lending in the market, we see large gaps between the yield curves on bonds between the official funds rates issued by the Central Bank .
This gap is clearly shown this chart, comparing the 2 year yield against the Official FED Funds rate (the interest rate you hear about on the TV).
History shows the 2 year is a good leading indicator on what Central Banks will do with interest rates.
Make no mistake, the market and inflation is forcing Central Banks to raise interest rates.
I very much question the robustness of 'the economy' to handle higher interest rates at present.
