TRADE OF THE WEEK | Great Investment That Paid Off 💰
Hey traders,
At the beginning of January, we spotted together a great short-term investment opportunity on Natural Gas.
Buying major weekly structure support we were expecting a strong bullish wave to a current high.
Our confirmation was a double bottom formation on a daily time frame.
We bought the retest of its neckline.
Finally, the goal is reached.
Patience pays traders.
❤️Please, support this idea with like and comment!❤️
CFD

CFDs for WTI Crude Oil - RISE OR FALL?This graph is a representation of my point of you of the futures market. (USD)

SILVER JUPITER/SATURN RELATIONSHIPS15 / 30 / 60 degrees relationship of Jupiter / Saturn cycle on SILVER Weekly chart.
Seems that it is bullish untill reaching a top around mid Jun 2023...

Natural Gas (NATGASUSD): Did You See That Confirmation? 💨
Update for my yesterday's post on Natural Gas:
the price retested a broken supply area and I spotted a very nice confirmation.
The market broke a resistance line of a bullish flag pattern.
Now you can wait for an occasional retest to buy expecting a bullish movement at least to 5.68 level.
❤️Please, support this idea with like and comment!❤️

XAUUSD Bearish PressurePrice is bouncing in the ascending parallel channel as a correction and retrace, and as you see in the 4H chart, it was rejected from the channel’s upper side.
Currently, we can see a strong bearish push on price. The main trend is bearish and price is in the correction phase.
There is a support level at 1940, and if price breaks this level, I expect a fall towards the channel’s lower band around 1925, and in the case of a downside breakout on the channel, the next target is around the next major low near 1900 and 1895

XAUUSD: Making Ascending ChannelAs we saw last week, XAUUSD dropped significantly after the big growth.
Currently, price is making an ascending parallel channel with two touches on the lower band and one touch on the upper side (it need the second touch on the upper level to make channel valid)
We can see an upside push and rejection from the trend line:
If price breaks the red resistance level at 1944 and a bullish candle closure above this level, we can expect a rise on the XAUUSD around 1974 which is also the channel’s upper side.

NG Sideways ZoneAfter a significant rise as a result of war, price has approached to the resistance level at 5.000 which has pushed the price for several times in the past.
Currently, price is bouncing between the red resistance level at 5.000 and the yellow support zone around 4.800 which is a sideways area.
We should wait for the breakout on the resistance or support level first, then in the case of a candle closure above or below the broken level, we can expect a move towards the target.

Multi Year Breakout in Silver. A New Bull Run?Silver Micro Futures has broken out from a triangle pattern with good volumes. It has been correcting under the same for nearly 560 Days. Due to geopolitical tensions, commodity prices are expected to rise. This could mark a bull run in Silver. Resistance is marked in Red. So it would have to take out the supply area to continue Rallying.
Even Though This could be the start of a bull run in silver, I would like to make a small and quick profit from the bullishness.
Buy @ 68888
Target @ 74757
Stop Loss @ 65466
Risk Reward Ratio 2:1
As it has broken out from a year-long correction we can expect silver prices to go higher after taking out Major Resistances.
Note: Views are personal, Not Responsible for P & L. DYOR before trading/Investing.

BTCUSD-- Just Brainstorming.Looking at my in-depth analysis of BTCUSD market. Made a few areas of interest and hope to start some dialogue regarding these price levels.
What price levels are you looking at moving forward? Let me know in the comments section. Happy trading, and good luck!

Crucial moments for BTCUSD -- Will we see 30k ever again?Wow, we are in some critical times in BTC's history! To keep it as simple as possible; we are looking for price to show the signs of the beginning form of a "higher low" when we look at our monthly (+) timeframe.
It is also important to see the pressure that is currently placed on the buying side of the channel of the downtrend we see when looking at the weekly chart (-). A break from this channel + further confirmation on intraday timeframes would begin demonstrating further the nature of the beginnings of a higher low when going back to the monthly candlestick view. These are places where new investors and patient traders are very likely to put their money where their mouth is.
"Where there is buyers, there are sellers.", meaning that this chart is showing potential areas for volatility. I personally find that its best to remain neutral (as a trader), and allow the market to break key areas and trendlines first before making a properly managed risk.
I own Bitcoin, and I trade it also.
I am publishing a 1H chart to show how important a close can be on a low timeframe, but the reality is that any serious player in the game is looking at price movement from a much larger one. You can find other perspectives and larger timeframe chart analysis' regarding Bitcoin in my previous publishings.
Critique my work! Let me know your thoughts in the comments section, and tell me what you think Bitcoin is going to do in the coming weeks. Be sure to like my page and follow me for more market ideas and chart analysis.
As always, happy trading and good luck!

XAUUSD Rise After RetraceAfter growing significantly and reaching strong monthly resistance levels, price started to drop and retrace.
Currently, price is in the correction phase and has approached to the yellow support zone.
We can see the rejection and upside push from this level in the past, and at this moment it seems like it may happen again.
We should wait for the current 4H candle to be closed first, then if price breaks the ascending trend line and closes a bullish 4H candle above it, we can expect a rise to the red resistance level around 2003, and in the case of an upside breakout on the red resistance level, wait for bullish candle confirmation to be closed above the level (2003), then go long again with a target at 2047

XAUUSD Triangle PatternAs you see in the 4H chart, price has made a symmetrical triangle pattern and is moving inside the pattern right now.
Since the symmetrical triangles can be broken out to both directions, we should wait for the price to see to which direction it will break the pattern.
After the triangle’s breakout, wait for the breakout and candle closure on the last major high or low to be more confident about the validation of the breakout.
If price breaks the triangle to the upside, wait for the red resistance level at 1945 to broken, then we can expect a rise to 1974.
On the other side, if price breaks the triangle to the downside, wait for the yellow support zone around 1918 to be broken too, then we can expect a drop on XAUUSD.
Personally, I’m on the bearish side for XAUUSD.

CHFJPY-- 5:1 R/R positionCHFJPY-- A top-down analysis using fibonacci and support/resistance zones to identify a possible higher-low on a high timeframe uptrend. Critique my analysis! Like the idea and follow me for more day-trading perspectives. Happy trading, and good luck!

BTCUSD-- High Volatility means Pay Day for us CFD tradersI am expecting major movements this month on BTCUSD!
I am very excited to share my first analysis of March '22 on this particular pair.
The price area shown in the chart is my current POI.
I will be monitoring this level to see how price reacts early in the development of the new monthly candle. Target areas are fibonacci levels drawn on the 1M timeframe, and you can see more perspectives and my reasoning for the placememnt of those levels on the next post after this one.
You can also find other posts about cryptocurrency by me! They can be found in the links to the related ideas below.
Happy trading, and good luck!

XAUUSD Bearish PressureLast week, after the war begun between Russia and Ukraine, we saw a significant rise on XAUUSD as a safe haven.
Price had a significant growth around 1980 (approximately near to $2000 which is a strong resistance level and almost the highest price that XAUUSD has been ever met before).
Since price approached to this strong resistance level, it started a drop. Currently, we can see the bearish pressure on price.
There is a support level around 1887 which has pushed the price to the upside for several times in the past. If price breaks this level to the downside and closes the bearish 4H candle below it, I expect a drop on XAUUSD to 1850 in the future.
But, remember that, because the war isn’t over yet and we don’t know what might happen, we should be aware of the probability of growth either.

XAUUSDXauusd Technical Analysis Basically on elliott waves Principles and Priceaction Strategey
Good opp to buy For investors
And Good opp to sell for Traders
Wait and Watch

NG Both SidesAs you see in the chart, price is moving in the ascending parallel channel and currently, it has been pushed to the upside after retesting the channel’s lower band.
If price breaks the red resistance level at 4.515 and closes a bullish candle above this level, we can expect a rise on NG to the channel upper band.
On the other hand, since we should always consider the another side either, if price breaks the yellow support zone around 4.300 and closes below this level, the bullish scenario is canceled and price may drop to 4.00

XAUUSD Retest or Breakout?After a significant growth, price has started to do some rest and it seems like it is making a reversal pattern.
There is a support zone around 1891 which has pushed the price to the upside in the past.
If price breaks the yellow support zone and closes a bearish candle below this level, I expect a drop to 1877 which was a resistance level before and now has turned into a support level. In the case of a downside breakout on 1877, the next target would be around 1850
On the other side, if price retests 1877 and got rejected from it, we can expect the drop as a downside retrace and then a beginning of a rise towards the last high around 1913

NQAfter a significant sharp fall, price has started a mild upside move on the bullish trend line.
Currently, price has respected the trend line and is pushed to the upside after touching it, and the last 4H candle has been closed bullish.
Since price is moving in the uptrend and failed to make lower lows, I expect a rise towards the last high at 14600, and in the case of an upside breakout on this level, the next target would be 15000
Otherwise, if price breaks the trend line to the downside, price will continue moving downside and the bullish scenario will be canceled.

XAUUSD Resistance ApproachAs you see in the chart, XAUUSD has been very bullish and rising significantly in the past few days.
Currently, price is approaching to the last recent high at 1879:
Since price has been rejected in the last time from this level, we can expect another rejection and a drop on price for the second time with a target around 1850
On the other side, since we are in an uptrend, there is a high possibility of upside breakout on the resistance level, and if price closes a bullish candle above this level, we can expect more rise for XAUUSD around (1897 - 1900)


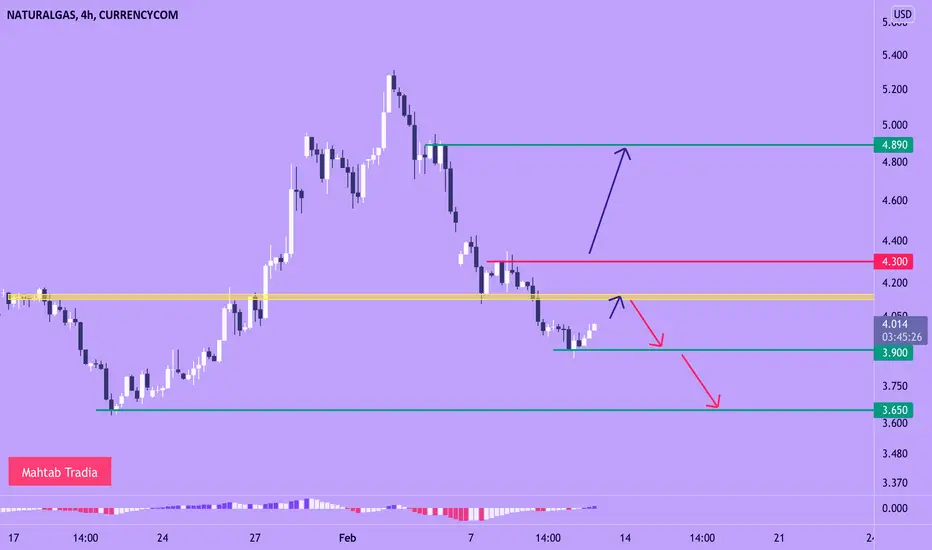
NG Possible ScenariosWe are in a downtrend and price has made lower lows and lower highs. Currently, price is moving up to retest the yellow broken level.
Since, we are in a downtrend, if price retests the yellow level and gets rejected from it, I expect a drop on NG to the marked green levels.
On the other hand, since price failed to break the last major low and could not make a lower low:
If price breaks the yellow level to the upside, we should wait for the red resistance level (last high) to be broken out to the upside and make a higher high, then we can expect a bullish reversal move on NG.
Gold movement February 9, 2022All eyes on todays USD news.
Xauusd has gained strength since last week and has been on a bullish path and current at 1827 region.
1829/32 will stand as a strong resistance and above that we can see bull will roll the dice to 1838 zone
On the contrary, 1818 is acting as a strong support zone and below that we can expect the bears to take the game towards 1812, 1804 with a short term target close to 1760/52.
If you like the analysis, please like and share your feedback.
