GOLD ANALYSIS GOLD is trading in uptrend
Above SMA 100
price now is in corrective bearish Elliot wave 4 we r waiting price to retest uptrendline corresponding to key level and 50% Fibonacci level at 1756.00
then waiting for bullish movement to be occurred in order to open long position
It's expected to target resistance levels 1789.55, 1812.00 respectively
CFD
US 30 , Gillionaire Corporate AnalysisHey for every one , if you have a different ideia , tell us on comments.
XAUUSD - CFD - 11 April 2021Hello traders, I hope you guys had a great weekend.
first of all I wanna show you my analysis in Gold.
there was an strong resistance in 1737 - 1741 area and price already broke this and retest it as support zone. there's and pin bar on the support area and we can use the pin bar strategy in this case.
well, maybe I take this trade.
show me some love with following my trradingview page and please do not forget to like this idea❤️
USOIL ANALYSISUSOIL is trading below major downtrendline
Price is based below key level at 62.00
Price is based below HVN at level 60.75 which indicates that usoil is in distribution phase
Price is forming Head & Shoulders pattern
MACD shows weakness in bullish momentum
RSI is below level 50
It's expected to target demand zone at level 57.50
Price taking at $57- April Target $68Oil experienced a small retrace following the aggressive high being formed March 7th on open. Tapping some of the key levels I projected in my last post there is definitely possibility for a reversion back to highs as the near term demand continues to increase. Summer is fast approaching and with an infrastructure bill being presented this week the oil and gas industry could see some strong bids. My view with current sanctions and policy, below 57 could serve as a discount pricing for the month of April with 52 potentially serving as a more defined floor.
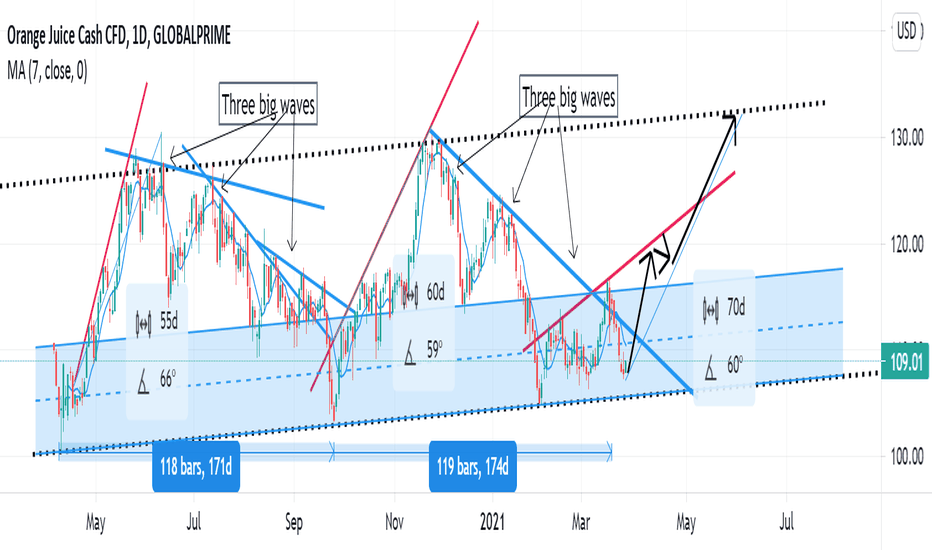
Best time to buy Orange Juice?Orange Juice demand/supply cycle frequency appears to be 170 days. Close to 25 weeks or 6 months.
When the price falls down, they come in three big waves. But the price increase happens fast. It takes about 2 months to increase the price to the maximum level.
Price falling happens slowly, takes about 4 months.
The last bull run in March couldn't break the resistance and fell back to the weekly support level. I can't see a reason for the price breaking weekly support.
A sharp price drop to key levels always shows a strong pullback. If the next bull run can break the resistance, the price could settle around $119 (or shoot past it to the previous high $130)
Can't think of a better time to buy Orange Juice. But wait until weekly support is confirmed by at least two consecutive days.
This is an idea only, not a financial advice.
Platinum long setup. Based on trend lines and support alone Platinum looks bullish. However, there is a triangle/ pennant forming therefore need to test if the bottom support holding up (or check if it forms a descending triangle ).
Most likely it will retest the previous high, fall back. If trendline support holds up, it should nicely go up.
This is just a trading idea, not a piece of advice. Do your own research before investing.
Crude Oil at Critical LevelWTI Crude Oil is currently at a critical support level. The red line signifies the broadening formation that Crude is moving in. If we see a proper bounce here, the volatility in the markets as a whole will cool off too, because oil heavily influences the industrial and financials sectors.
We are on an bullish channel on US100As we see in the chart, we are at the beginning of a new bull trend that has responded to the midline of our channel. Our support and res line has been drawn in the chart and we are close to breaking the channel's middle line for a big bull trend up to the top of our channel, we will see if the price reacts to the res line and then by using Fiboncchi, we can take decisions for take profit levels.
TP 1: 13250 USD
TP" 2: 13350 USD
Gold back to the topOn the H4 time frame, there is a divergence between the upward movement of the candlestick and the downward movement of the Stochastic indicator. So it can be concluded that in the short to medium term Gold will rise.
Note: This is just an idea from me, please compare it with your own analysis before opening a position. Thank you.
WTI OIL Still Below Key Level! Bearish Bias! Sell!
Hello,Traders!
OIL is trading in an uptrend and is very bullish
Due to it being oversold previously
And also due to the positive fundamentals picture
However, it has reached the first major resistance level
And failed to break it during the first attemtp
While this level remains unbroken
I will be bearish biased but any short needs to be low risk
Because it goes counter to the trend
Any long position before the breakout is also unadvisable
Or permitted with lower risk
If this level gets broken
The next major resistance level for Oil is 76.5$
Sell!
Like, comment and subscribe to boost your trading!
See other ideas below too!


