I'll expect S&P500 short to 2533 after retracement to 2610 area!I'll expect S&P500 short to 2533 after retracement to 2610 area! The cycle will be completed I expect.
What about this ' Cycle phenomenon' ? read here:
My main strategy is called 'cycle-trading'. After years of learning and practicing after I bought a teaching-package from a visionair, I found a way of how to trade successful with CFD's on the stock-market. Every stock is following an certain cycle which repeats itself. So, movements are often appearing in the same percentage, aswel long as short. This cycles appear at all levels; when you analyse the chart at 1 month, 1 week, 1 day, 1 hour. (others I don't use). This is the case, because all in life is build by the fibonacci sequence. When you analyse the chart, you'll also see the stock market is behaving itself as the fibonacci sequence. But, still the most difficult part and what it's all about, is where does a long or a short start? and which point is telling you that the cycle is started, so that you know it will probably go to the next fibonacci resistance? .... therefore I have developed some own indicators!
The exact positions of where to open, to close and the stop loss position and take profit position is very important to be successful with trading!
My strategy is to never trade on volatile markets. You will lose your money when you do! Trade on technical-chart analysis! not on news and volatility!
One of my other strategies is that trades are only interesting and ‘safe’ to open when: you can possibly lose 1/3rd of the possible profit. So; when you set the indicators after analysing resistances, and you can lose 100 but win 300, it is worth the try!
How do I decide to open a position or not? First I analyse:
- sentiment on the market > are people in buy mode or short mode
- I have some own created indicators, some I show in my charts. Therefor I use the fibonacci sequence. My indicators tell to open a position or not and in combination with other own created indicators I decide where to place the stop loss and take profit positions.
- and this own indicators tell me when probably a new long position starts or a new short > these are the positions where I place my orders! or open directly.
- and again other own created indicators tell me how far long or short it probably goes. The take profit and stop loss positions are other positions than the resistances in the market!
- the moving-averages and bollinger-bands are very important indicators also. They are helping a lot! by making decisions.
And that is Why I win more than I lose in the end. Patience is everything, we’ll wait for the right moment! But don't forget; trading means investing. Sometimes you lose more than you win in the beginning of a period!
Most of the times the sentiment changes on Monday! please consider that when you start a position on Monday. Tuesday, Wednesday and Thursday are on steady markets normally calm trading days. Than, my strategies work at their best!
Don't forget to follow me, so you get updated when I post new ones. Also read my account and the 'status updates' to be informed.
Thank you for following and Succes with trading !
Richard from Rich.Exclusive.Trading
Cfdtrading

S&P500 risk for short to 2600. Or long to 2675-------------------------------------------------------------------------------------------------------------------------------------------
My main strategy is called 'cycle-trading'. After years of learning and practicing after I bought a teaching-package from a visionair, I found a way of how to trade successful with CFD's on the stock-market. Every stock is following an certain cycle which repeats itself. So, movements are often appearing in the same percentage, aswel long as short. This cycles appear at all levels; when you analyse the chart at 1 month, 1 week, 1 day, 1 hour. (others I don't use). This is the case, because all in life is build by the fibonacci sequence. When you analyse the chart, you'll also see the stock market is behaving itself as the fibonacci sequence. But, still the most difficult part and what it's all about, is where does a long or a short start? and which point is telling you that the cycle is started, so that you know it will probably go to the next fibonacci resistance? .... therefore I have developed some own indicators!
The exact positions of where to open, to close and the stop loss position and take profit position is very important to be successful with trading!
My strategy is to never trade on volatile markets. You will lose your money when you do! Trade on technical-chart analysis! not on news and volatility!
One of my other strategies is that trades are only interesting and ‘safe’ to open when: you can possibly lose 1/3rd of the possible profit. So; when you set the indicators after analysing resistances, and you can lose 100 but win 300, it is worth the try!
How do I decide to open a position or not? First I analyse:
- sentiment on the market > are people in buy mode or short mode
- I have some own created indicators, some I show in my charts. Therefor I use the fibonacci sequence. My indicators tell to open a position or not and in combination with other own created indicators I decide where to place the stop loss and take profit positions.
- and this own indicators tell me when probably a new long position starts or a new short > these are the positions where I place my orders! or open directly.
- and again other own created indicators tell me how far long or short it probably goes. The take profit and stop loss positions are other positions than the resistances in the market!
- the moving-averages and bollinger-bands are very important indicators also. They are helping a lot! by making decisions.
And that is Why I win more than I lose in the end. Patience is everything, we’ll wait for the right moment! But don't forget; trading means investing. Sometimes you lose more than you win in the beginning of a period!
Most of the times the sentiment changes on Monday! please consider that when you start a position on Monday. Tuesday, Wednesday and Thursday are on steady markets normally calm trading days. Than, my strategies work at their best!
Don't forget to follow me, so you get updated when I post new ones. Also read my account and the 'status updates' to be informed.
Thank you for following and Succes with trading !
Richard from Rich.Exclusive.Trading

When Oil break $64 we go short; when break $65 long. -------------------------------------------------------------------------------------------------------------------------------------------
My main strategy is called 'cycle-trading'. After years of learning and practicing after I bought a teaching-package from a visionair, I found a way of how to trade successful with CFD's on the stock-market. Every stock is following an certain cycle which repeats itself. So, movements are often appearing in the same percentage, aswel long as short. This cycles appear at all levels; when you analyse the chart at 1 month, 1 week, 1 day, 1 hour. (others I don't use). This is the case, because all in life is build by the fibonacci sequence. When you analyse the chart, you'll also see the stock market is behaving itself as the fibonacci sequence. But, still the most difficult part and what it's all about, is where does a long or a short start? and which point is telling you that the cycle is started, so that you know it will probably go to the next fibonacci resistance? .... therefore I have developed some own indicators!
The exact positions of where to open, to close and the stop loss position and take profit position is very important to be successful with trading!
My strategy is to never trade on volatile markets. You will lose your money when you do! Trade on technical-chart analysis! not on news and volatility!
One of my other strategies is that trades are only interesting and ‘safe’ to open when: you can possibly lose 1/3rd of the possible profit. So; when you set the indicators after analysing resistances, and you can lose 100 but win 300, it is worth the try!
How do I decide to open a position or not? First I analyse:
- sentiment on the market > are people in buy mode or short mode
- I have some own created indicators, some I show in my charts. Therefor I use the fibonacci sequence. My indicators tell to open a position or not and in combination with other own created indicators I decide where to place the stop loss and take profit positions.
- and this own indicators tell me when probably a new long position starts or a new short > these are the positions where I place my orders! or open directly.
- and again other own created indicators tell me how far long or short it probably goes. The take profit and stop loss positions are other positions than the resistances in the market!
- the moving-averages and bollinger-bands are very important indicators also. They are helping a lot! by making decisions.
And that is Why I win more than I lose in the end. Patience is everything, we’ll wait for the right moment! But don't forget; trading means investing. Sometimes you lose more than you win in the beginning of a period!
Most of the times the sentiment changes on Monday! please consider that when you start a position on Monday. Tuesday, Wednesday and Thursday are on steady markets normally calm trading days. Than, my strategies work at their best!
Don't forget to follow me, so you get updated when I post new ones. Also read my account and the 'status updates' to be informed.
Thank you for following and Succes with trading !
Richard from Rich.Exclusive.Trading

NEO heavy resistance 66.10. Looks like a great buy moment now.Crypto currencies I don't trade as CFD's. Too much risk, mainly because they expire very soon every time. When you want to invest in crypto, I advise you to buy 'real coins' and not to speculate the chart with CFD's. I have bought XRP-Ripple, Bitcoin, Bitcoin Cash, Ethereum, ReddCoin, FeatherCoin, Adcoin (ACC) and looking for NEO now !
-------------------------------------------------------------------------------------------------------------------------------------------
My main strategy is called 'cycle-trading'. After years of learning and practicing after I bought a teaching-package from a visionair, I found a way of how to trade successful with CFD's on the stock-market. Every stock is following an certain cycle which repeats itself. So, movements are often appearing in the same percentage, aswel long as short. This cycles appear at all levels; when you analyse the chart at 1 month, 1 week, 1 day, 1 hour. (others I don't use). This is the case, because all in life is build by the fibonacci sequence. When you analyse the chart, you'll also see the stock market is behaving itself as the fibonacci sequence. But, still the most difficult part and what it's all about, is where does a long or a short start? and which point is telling you that the cycle is started, so that you know it will probably go to the next fibonacci resistance? .... therefore I have developed some own indicators!
The exact positions of where to open, to close and the stop loss position and take profit position is very important to be successful with trading!
My strategy is to never trade on volatile markets. You will lose your money when you do! Trade on technical-chart analysis! not on news and volatility!
One of my other strategies is that trades are only interesting and ‘safe’ to open when: you can possibly lose 1/3rd of the possible profit. So; when you set the indicators after analysing resistances, and you can lose 100 but win 300, it is worth the try!
How do I decide to open a position or not? First I analyse:
- sentiment on the market > are people in buy mode or short mode
- I have some own created indicators, some I show in my charts. Therefor I use the fibonacci sequence. My indicators tell to open a position or not and in combination with other own created indicators I decide where to place the stop loss and take profit positions.
- and this own indicators tell me when probably a new long position starts or a new short > these are the positions where I place my orders! or open directly.
- and again other own created indicators tell me how far long or short it probably goes. The take profit and stop loss positions are other positions than the resistances in the market!
- the moving-averages and bollinger-bands are very important indicators also. They are helping a lot! by making decisions.
And that is Why I win more than I lose in the end. Patience is everything, we’ll wait for the right moment! But don't forget; trading means investing. Sometimes you lose more than you win in the beginning of a period!
Most of the times the sentiment changes on Monday! please consider that when you start a position on Monday. Tuesday, Wednesday and Thursday are on steady markets normally calm trading days. Than, my strategies work at their best!
Don't forget to follow me, so you get updated when I post new ones. Also read my account and the 'status updates' to be informed.
Thank you for following and Succes with trading !
Richard from Rich.Exclusive.Trading

BitCoinCash seems to hold resistance. Possible climb to 1350!Crypto currencies I don't trade as CFD's. Too much risk, mainly because they expire very soon every time. When you want to invest in crypto, I advise you to buy 'real coins' and not to speculate the chart with CFD's. I have bought XRP-Ripple, Bitcoin, Bitcoin Cash, Ethereum, ReddCoin, FeatherCoin, Adcoin (ACC) !
-------------------------------------------------------------------------------------------------------------------------------------------
My main strategy is called 'cycle-trading'. After years of learning and practicing after I bought a teaching-package from a visionair, I found a way of how to trade successful with CFD's on the stock-market. Every stock is following an certain cycle which repeats itself. So, movements are often appearing in the same percentage, aswel long as short. This cycles appear at all levels; when you analyse the chart at 1 month, 1 week, 1 day, 1 hour. (others I don't use). This is the case, because all in life is build by the fibonacci sequence. When you analyse the chart, you'll also see the stock market is behaving itself as the fibonacci sequence. But, still the most difficult part and what it's all about, is where does a long or a short start? and which point is telling you that the cycle is started, so that you know it will probably go to the next fibonacci resistance? .... therefore I have developed some own indicators!
The exact positions of where to open, to close and the stop loss position and take profit position is very important to be successful with trading!
My strategy is to never trade on volatile markets. You will lose your money when you do! Trade on technical-chart analysis! not on news and volatility!
One of my other strategies is that trades are only interesting and ‘safe’ to open when: you can possibly lose 1/3rd of the possible profit. So; when you set the indicators after analysing resistances, and you can lose 100 but win 300, it is worth the try!
How do I decide to open a position or not? First I analyse:
- sentiment on the market > are people in buy mode or short mode
- I have some own created indicators, some I show in my charts. Therefor I use the fibonacci sequence. My indicators tell to open a position or not and in combination with other own created indicators I decide where to place the stop loss and take profit positions.
- and this own indicators tell me when probably a new long position starts or a new short > these are the positions where I place my orders! or open directly.
- and again other own created indicators tell me how far long or short it probably goes. The take profit and stop loss positions are other positions than the resistances in the market!
- the moving-averages and bollinger-bands are very important indicators also. They are helping a lot! by making decisions.
And that is Why I win more than I lose in the end. Patience is everything, we’ll wait for the right moment! But don't forget; trading means investing. Sometimes you lose more than you win in the beginning of a period!
Most of the times the sentiment changes on Monday! please consider that when you start a position on Monday. Tuesday, Wednesday and Thursday are on steady markets normally calm trading days. Than, my strategies work at their best!
Don't forget to follow me, so you get updated when I post new ones. Also read my account and the 'status updates' to be informed.
Thank you for following and Succes with trading !
Richard from Rich.Exclusive.Trading

Copper opportunity to go long. End of fibonacci trend now!Aswel Fibonacci long as short analysis tell me that Copper -1.33% is at the end of a trend line now. It is at Fibonacci 0% long and 100% short. So, when it breaks the low resistance price can fall to 2.96500 / 2.92000. When resistance hold, price will climb back to 3.06800, 3.09600, 3.12000. I have opened a position!
-------------------------------------------------------------------------------------------------------------------------------------------
My main strategy is called 'cycle-trading'. After years of learning and practicing after I bought a teaching-package from a visionair, I found a way of how to trade successful with CFD's on the stock-market. Every stock is following an certain cycle which repeats itself. So, movements are often appearing in the same percentage, aswel long as short. This cycles appear at all levels; when you analyse the chart at 1 month, 1 week, 1 day, 1 hour. (others I don't use). This is the case, because all in life is build by the fibonacci sequence. When you analyse the chart, you'll also see the stock market is behaving itself as the fibonacci sequence. But, still the most difficult part and what it's all about, is where does a long or a short start? and which point is telling you that the cycle is started, so that you know it will probably go to the next fibonacci resistance? .... therefore I have developed some own indicators!
The exact positions of where to open, to close and the stop loss position and take profit position is very important to be successful with trading!
My strategy is to never trade on volatile markets. You will lose your money when you do! Trade on technical-chart analysis! not on news and volatility!
One of my other strategies is that trades are only interesting and ‘safe’ to open when: you can possibly lose 1/3rd of the possible profit. So; when you set the indicators after analysing resistances, and you can lose 100 but win 300, it is worth the try!
How do I decide to open a position or not? First I analyse:
- sentiment on the market > are people in buy mode or short mode
- I have some own created indicators, some I show in my charts. Therefor I use the fibonacci sequence. My indicators tell to open a position or not and in combination with other own created indicators I decide where to place the stop loss and take profit positions.
- and this own indicators tell me when probably a new long position starts or a new short > these are the positions where I place my orders! or open directly.
- and again other own created indicators tell me how far long or short it probably goes. The take profit and stop loss positions are other positions than the resistances in the market!
- the moving-averages and bollinger-bands are very important indicators also. They are helping a lot! by making decisions.
And that is Why I win more than I lose in the end. Patience is everything, we’ll wait for the right moment! But don't forget; trading means investing. Sometimes you lose more than you win in the beginning of a period!
Most of the times the sentiment changes on Monday! please consider that when you start a position on Monday. Tuesday, Wednesday and Thursday are on steady markets normally calm trading days. Than, my strategies work at their best!
Don't forget to follow me, so you get updated when I post new ones. Also read my account and the 'status updates' to be informed.
Thank you for following and Succes with trading !
Richard from Rich.Exclusive.Trading

Ethereum at bottom of fibonacci resistance. Will it bounce back?Ethereum at bottom of fibonacci resistance. Will it bounce back? or short further to 443 ?
Ethereum Fibonacci resistances at 10,99 / 254,70 / 443,99 / 581,23 / 718,46 / 884,00 / 1153,83
Just like Bitcoin/Bitcoin Cash/XRP and Feathercoin it looks like Ethereum is also building an horizontal pattern and possibly will bounce between 581 and 884.
I own some of all of these coins because I am convinced of the Blockchain technology will dominate in the future and prices will rise in the future.
Crypto currencies I don't trade as CFD's. Too much risk, mainly because they expire very soon every time. When you want to invest in crypto, I advise you to buy 'real coins' and not to speculate the chart with CFD's. I have bought XRP-Ripple, Bitcoin, Bitcoin Cas and Ethereum!
-------------------------------------------------------------------------------------------------------------------------------------------
My main strategy is called 'cycle-trading'. After years of learning and practicing after I bought a teaching-package from a visionair, I found a way of how to trade successful with CFD's on the stock-market. Every stock is following an certain cycle which repeats itself. So, movements are often appearing in the same percentage, aswel long as short. This cycles appear at all levels; when you analyse the chart at 1 month, 1 week, 1 day, 1 hour. (others I don't use). This is the case, because all in life is build by the fibonacci sequence. When you analyse the chart, you'll also see the stock market is behaving itself as the fibonacci sequence. But, still the most difficult part and what it's all about, is where does a long or a short start? and which point is telling you that the cycle is started, so that you know it will probably go to the next fibonacci resistance? .... therefore I have developed some own indicators!
The exact positions of where to open, to close and the stop loss position and take profit position is very important to be successful with trading!
My strategy is to never trade on volatile markets. You will lose your money when you do! Trade on technical-chart analysis! not on news and volatility!
One of my other strategies is that trades are only interesting and ‘safe’ to open when: you can possibly lose 1/3rd of the possible profit. So; when you set the indicators after analysing resistances, and you can lose 100 but win 300, it is worth the try!
How do I decide to open a position or not? First I analyse:
- sentiment on the market > are people in buy mode or short mode
- I have some own created indicators, some I show in my charts. Therefor I use the fibonacci sequence. My indicators tell to open a position or not and in combination with other own created indicators I decide where to place the stop loss and take profit positions.
- and this own indicators tell me when probably a new long position starts or a new short > these are the positions where I place my orders! or open directly.
- and again other own created indicators tell me how far long or short it probably goes. The take profit and stop loss positions are other positions than the resistances in the market!
- the moving-averages and bollinger-bands are very important indicators also. They are helping a lot! by making decisions.
And that is Why I win more than I lose in the end. Patience is everything, we’ll wait for the right moment! But don't forget; trading means investing. Sometimes you lose more than you win in the beginning of a period!
Most of the times the sentiment changes on Monday! please consider that when you start a position on Monday. Tuesday, Wednesday and Thursday are on steady markets normally calm trading days. Than, my strategies work at their best!
Don't forget to follow me, so you get updated when I post new ones. Also read my account and the 'status updates' to be informed.
Thank you for following and Succes with trading !
Richard from Rich.Exclusive.Trading

XAUUSD should continue to sell off: Short tf (4hr) analysisPrice action for GOLD (XAUUSD) terminated a Primary wave i.e. wave ((C)) at the close on Jan 25, 2018. Price swing from this pivot ~$1365.95 on Jan 25, 2018 up to a low of ~$1309.59 on March 1,2018 can be observed to have completed a 3 wave move best described by a regular flat Elliott wave structure.
It appears that XAUUSD is currently completing a minor wave B position after which a minor wave C should see price return to the target area marked on the chart. Target area is between ~$1348.05 and $1343.38.
Completion of minor wave C will also complete at intermediate wave (X), which implies that XAUUSD should sell off and return to at least the low of March 1 2018 at ~$1309.59.
If XAUUSD holds in the target area, the entire move from Jan. 25, 2018 is therefore going to shape up as a WXY move.
Projections that can be used to take profit = the termination point of a wave Y based on a wave W are the following:
wave Y = 161.8% wave W or
wave Y = 100%wave W (this is more conservative)
POI = Point of invalidation for the 4hr tf analysis i.e. Price closing above 1359.58
P.S. Price swing as used by the author is to describe the overall trend in price. It does not equate to an Elliott wave move or structure.
Analysis was carried out using OANDA FX's data so prices quoted above might defer slightly depending on your broker.

S&P500 difficult to analyse now, wait to reach 2800 or 2690. S&P500 difficult to analyse now, wait to reach 2800 or 2690.
When the chart breaks 2800, it could be interesting to open a long with (longtime)-target 2880 and when it breaks 2690 it looks like we can focus on 2640.
In between bollinger bands now, fluctuations expected and not interesting to open a position now.
-------------------------------------------------------------------------------------------------------------------------------------------
My main strategy is called 'cycle-trading'. After years of learning and practicing after I bought a teaching-package from a visionair, I found a way of how to trade successful with CFD's on the stock-market. Every stock is following an certain cycle which repeats itself. So, movements are often appearing in the same percentage, aswel long as short. This cycles appear at all levels; when you analyse the chart at 1 month, 1 week, 1 day, 1 hour. (others I don't use). This is the case, because all in life is build by the fibonacci sequence. When you analyse the chart, you'll also see the stock market is behaving itself as the fibonacci sequence. But, still the most difficult part and what it's all about, is where does a long or a short start? and which point is telling you that the cycle is started, so that you know it will probably go to the next fibonacci resistance? .... therefore I have developed some own indicators!
The exact positions of where to open, to close and the stop loss position and take profit position is very important to be successful with trading!
My strategy is to never trade on volatile markets. You will lose your money when you do! Trade on technical-chart analysis! not on news and volatility!
One of my other strategies is that trades are only interesting and ‘safe’ to open when: you can possibly lose 1/3rd of the possible profit. So; when you set the indicators after analysing resistances, and you can lose 100 but win 300, it is worth the try!
How do I decide to open a position or not? First I analyse:
- sentiment on the market > are people in buy mode or short mode
- I have some own created indicators, some I show in my charts. Therefor I use the fibonacci sequence. My indicators tell to open a position or not and in combination with other own created indicators I decide where to place the stop loss and take profit positions.
- and this own indicators tell me when probably a new long position starts or a new short > these are the positions where I place my orders! or open directly.
- and again other own created indicators tell me how far long or short it probably goes. The take profit and stop loss positions are other positions than the resistances in the market!
- the moving-averages and bollinger-bands are very important indicators also. They are helping a lot! by making decisions.
And that is Why I win more than I lose in the end. Patience is everything, we’ll wait for the right moment! But don't forget; trading means investing. Sometimes you lose more than you win in the beginning of a period!
Most of the times the sentiment changes on Monday! please consider that when you start a position on Monday. Tuesday, Wednesday and Thursday are on steady markets normally calm trading days. Than, my strategies work at their best!
Don't forget to follow me, so you get updated when I post new ones. Also read my account and the 'status updates' to be informed.
Thank you for following and Succes with trading !
Richard from Rich.Exclusive.Trading

Will NaturalGas test 2600? or go back long to 2800 area ?NaturalGas could probably short to 2600 area when it breaks the current fibonacci resistance. When it doesn't break; long to 2800 area.
Gas is between the two bollinger bands now, so volatility / price fluctuations expected! difficult to open a trade on this one now.
-------------------------------------------------------------------------------------------------------------------------------------------
My main strategy is called 'cycle-trading'. After years of learning and practicing after I bought a teaching-package from a visionair, I found a way of how to trade successful with CFD's on the stock-market. Every stock is following an certain cycle which repeats itself. So, movements are often appearing in the same percentage, aswel long as short. This cycles appear at all levels; when you analyse the chart at 1 month, 1 week, 1 day, 1 hour. (others I don't use). This is the case, because all in life is build by the fibonacci sequence. When you analyse the chart, you'll also see the stock market is behaving itself as the fibonacci sequence. But, still the most difficult part and what it's all about, is where does a long or a short start? and which point is telling you that the cycle is started, so that you know it will probably go to the next fibonacci resistance? .... therefore I have developed some own indicators!
The exact positions of where to open, to close and the stop loss position and take profit position is very important to be successful with trading!
My strategy is to never trade on volatile markets. You will lose your money when you do! Trade on technical-chart analysis! not on news and volatility!
One of my other strategies is that trades are only interesting and ‘safe’ to open when: you can possibly lose 1/3rd of the possible profit. So; when you set the indicators after analysing resistances, and you can lose 100 but win 300, it is worth the try!
How do I decide to open a position or not? First I analyse:
- sentiment on the market > are people in buy mode or short mode
- I have some own created indicators, some I show in my charts. Therefor I use the fibonacci sequence. My indicators tell to open a position or not and in combination with other own created indicators I decide where to place the stop loss and take profit positions.
- and this own indicators tell me when probably a new long position starts or a new short > these are the positions where I place my orders! or open directly.
- and again other own created indicators tell me how far long or short it probably goes. The take profit and stop loss positions are other positions than the resistances in the market!
- the moving-averages and bollinger-bands are very important indicators also. They are helping a lot! by making decisions.
And that is Why I win more than I lose in the end. Patience is everything, we’ll wait for the right moment! But don't forget; trading means investing. Sometimes you lose more than you win in the beginning of a period!
Most of the times the sentiment changes on Monday! please consider that when you start a position on Monday. Tuesday, Wednesday and Thursday are on steady markets normally calm trading days. Than, my strategies work at their best!
Don't forget to follow me, so you get updated when I post new ones. Also read my account and the 'status updates' to be informed.
Thank you for following and Succes with trading !
Richard from Rich.Exclusive.Trading

BitcoinCash at heavy resistance now Long to 1350 or short to 405BitcoinCash at heavy resistance now Long to 1350 or short to 405. Looks like a good moment to BUY!!
Crypto currencies I don't trade as CFD's. Too much risk, mainly because they expire very soon every time. When you want to invest in crypto, I advise you to buy 'real coins' and not to speculate the chart with CFD's. I have bought XRP-Ripple, Bitcoin, Bitcoin Cash and Ethereum!
-------------------------------------------------------------------------------------------------------------------------------------------
My main strategy is called 'cycle-trading'. After years of learning and practicing after I bought a teaching-package from a visionair, I found a way of how to trade successful with CFD's on the stock-market. Every stock is following an certain cycle which repeats itself. So, movements are often appearing in the same percentage, aswel long as short. This cycles appear at all levels; when you analyse the chart at 1 month, 1 week, 1 day, 1 hour. (others I don't use). This is the case, because all in life is build by the fibonacci sequence. When you analyse the chart, you'll also see the stock market is behaving itself as the fibonacci sequence. But, still the most difficult part and what it's all about, is where does a long or a short start? and which point is telling you that the cycle is started, so that you know it will probably go to the next fibonacci resistance? .... therefore I have developed some own indicators!
The exact positions of where to open, to close and the stop loss position and take profit position is very important to be successful with trading!
My strategy is to never trade on volatile markets. You will lose your money when you do! Trade on technical-chart analysis! not on news and volatility!
One of my other strategies is that trades are only interesting and ‘safe’ to open when: you can possibly lose 1/3rd of the possible profit. So; when you set the indicators after analysing resistances, and you can lose 100 but win 300, it is worth the try!
How do I decide to open a position or not? First I analyse:
- sentiment on the market > are people in buy mode or short mode
- I have some own created indicators, some I show in my charts. Therefor I use the fibonacci sequence. My indicators tell to open a position or not and in combination with other own created indicators I decide where to place the stop loss and take profit positions.
- and this own indicators tell me when probably a new long position starts or a new short > these are the positions where I place my orders! or open directly.
- and again other own created indicators tell me how far long or short it probably goes. The take profit and stop loss positions are other positions than the resistances in the market!
- the moving-averages and bollinger-bands are very important indicators also. They are helping a lot! by making decisions.
And that is Why I win more than I lose in the end. Patience is everything, we’ll wait for the right moment! But don't forget; trading means investing. Sometimes you lose more than you win in the beginning of a period!
Most of the times the sentiment changes on Monday! please consider that when you start a position on Monday. Tuesday, Wednesday and Thursday are on steady markets normally calm trading days. Than, my strategies work at their best!
Like my analyses? don't forget to follow me, so you get updated when I post new ones. Also read my account and the 'status updates' to be informed.
Thank you for following and Succes with trading !
Richard from Rich.Exclusive.Trading

Feathercoin bouncing between 0,197 and 0,315. Feathercoin bouncing between 0,197 and 0,315. Breaking points and resistances are indicators for short term which you can use for short term CFD trading.
Crypto currencies I don't trade as CFD's. Too much risk, mainly because they expire very soon every time. When you want to invest in crypto, I advise you to buy 'real coins' and not to speculate the chart with CFD's. I have bought XRP-Ripple, Bitcoin, Bitcoin Cash and Ethereum! Feathercoin looks interesting now also. Price is exactly at the middle of bollinger band, so fluctuations expected!
-------------------------------------------------------------------------------------------------------------------------------------------
My main strategy is called 'cycle-trading'. After years of learning and practicing after I bought a teaching-package from a visionair, I found a way of how to trade successful with CFD's on the stock-market. Every stock is following an certain cycle which repeats itself. So, movements are often appearing in the same percentage, aswel long as short. This cycles appear at all levels; when you analyse the chart at 1 month, 1 week, 1 day, 1 hour. (others I don't use). This is the case, because all in life is build by the fibonacci sequence. When you analyse the chart, you'll also see the stock market is behaving itself as the fibonacci sequence. But, still the most difficult part and what it's all about, is where does a long or a short start? and which point is telling you that the cycle is started, so that you know it will probably go to the next fibonacci resistance? .... therefore I have developed some own indicators!
The exact positions of where to open, to close and the stop loss position and take profit position is very important to be successful with trading!
My strategy is to never trade on volatile markets. You will lose your money when you do! Trade on technical-chart analysis! not on news and volatility!
One of my other strategies is that trades are only interesting and ‘safe’ to open when: you can possibly lose 1/3rd of the possible profit. So; when you set the indicators after analysing resistances, and you can lose 100 but win 300, it is worth the try!
How do I decide to open a position or not? First I analyse:
- sentiment on the market > are people in buy mode or short mode
- I have some own created indicators, some I show in my charts. Therefor I use the fibonacci sequence. My indicators tell to open a position or not and in combination with other own created indicators I decide where to place the stop loss and take profit positions.
- and this own indicators tell me when probably a new long position starts or a new short > these are the positions where I place my orders! or open directly.
- and again other own created indicators tell me how far long or short it probably goes. The take profit and stop loss positions are other positions than the resistances in the market!
- the moving-averages and bollinger-bands are very important indicators also. They are helping a lot! by making decisions.
And that is Why I win more than I lose in the end. Patience is everything, we’ll wait for the right moment! But don't forget; trading means investing. Sometimes you lose more than you win in the beginning of a period!
Most of the times the sentiment changes on Monday! please consider that when you start a position on Monday. Tuesday, Wednesday and Thursday are on steady markets normally calm trading days. Than, my strategies work at their best!
Don't forget to follow me, so you get updated when I post new ones. Also read my account and the 'status updates' to be informed.
Thank you for following and Succes with trading !
Richard from Rich.Exclusive.Trading

Ethereum Fibonacci resistances 10/254/443/581/718/884/1153 Ethereum Fibonacci resistances at 10,99 / 254,70 / 443,99 / 581,23 / 718,46 / 884,00 / 1153,83
Just like Bitcoin/Bitcoin Cash/XRP and Feathercoin it looks like Ethereum is also building an horizontal pattern and possibly will bounce between 581 and 884.
I own some of all of these coins because I am convinced of the Blockchain technology will dominate in the future and prices will rise in the future.
Crypto currencies I don't trade as CFD's. Too much risk, mainly because they expire very soon every time. When you want to invest in crypto, I advise you to buy 'real coins' and not to speculate the chart with CFD's. I have bought XRP-Ripple, Bitcoin, Bitcoin Cash and Ethereum!
-------------------------------------------------------------------------------------------------------------------------------------------
My main strategy is called 'cycle-trading'. After years of learning and practicing after I bought a teaching-package from a visionair, I found a way of how to trade successful with CFD's on the stock-market. Every stock is following an certain cycle which repeats itself. So, movements are often appearing in the same percentage, aswel long as short. This cycles appear at all levels; when you analyse the chart at 1 month, 1 week, 1 day, 1 hour. (others I don't use). This is the case, because all in life is build by the fibonacci sequence. When you analyse the chart, you'll also see the stock market is behaving itself as the fibonacci sequence. But, still the most difficult part and what it's all about, is where does a long or a short start? and which point is telling you that the cycle is started, so that you know it will probably go to the next fibonacci resistance? .... therefore I have developed some own indicators!
The exact positions of where to open, to close and the stop loss position and take profit position is very important to be successful with trading!
My strategy is to never trade on volatile markets. You will lose your money when you do! Trade on technical-chart analysis! not on news and volatility!
One of my other strategies is that trades are only interesting and ‘safe’ to open when: you can possibly lose 1/3rd of the possible profit. So; when you set the indicators after analysing resistances, and you can lose 100 but win 300, it is worth the try!
How do I decide to open a position or not? First I analyse:
- sentiment on the market > are people in buy mode or short mode
- I have some own created indicators, some I show in my charts. Therefor I use the fibonacci sequence. My indicators tell to open a position or not and in combination with other own created indicators I decide where to place the stop loss and take profit positions.
- and this own indicators tell me when probably a new long position starts or a new short > these are the positions where I place my orders! or open directly.
- and again other own created indicators tell me how far long or short it probably goes. The take profit and stop loss positions are other positions than the resistances in the market!
- the moving-averages and bollinger-bands are very important indicators also. They are helping a lot! by making decisions.
And that is Why I win more than I lose in the end. Patience is everything, we’ll wait for the right moment! But don't forget; trading means investing. Sometimes you lose more than you win in the beginning of a period!
Most of the times the sentiment changes on Monday! please consider that when you start a position on Monday. Tuesday, Wednesday and Thursday are on steady markets normally calm trading days. Than, my strategies work at their best!
Like my analyses? don't forget to follow me, so you get updated when I post new ones. Also read my account and the 'status updates' to be informed.
Thank you for following and Succes with trading !
Richard from Rich.Exclusive.Trading

BitcoinCash perfect follows Fibonacci Building horizontal line?BitcoinCash is perfectly following the Fibonacci sequence. I see patterns which looks like the chart is building an horizontal line now?
Will this be a steady point? Fluctuations will continue between 950 and 1670. Every time when the resistances get broken, there is a change the price will go more long above 1670 or more short below 950, and following fibonacci sequence prices will be touched. Interesting! I am very curious what will happen coming months/years.
Crypto currencies I don't trade as CFD's. Too much risk, mainly because they expire very soon every time. When you want to invest in crypto, I advise you to buy 'real coins' and not to speculate the chart with CFD's. I have bought XRP-Ripple, Bitcoin, Bitcoin Cash and Ethernum!
-------------------------------------------------------------------------------------------------------------------------------------------
My main strategy is called 'cycle-trading'. After years of learning and practicing after I bought a teaching-package from a visionair, I found a way of how to trade successful with CFD's on the stock-market. Every stock is following an certain cycle which repeats itself. So, movements are often appearing in the same percentage, aswel long as short. This cycles appear at all levels; when you analyse the chart at 1 month, 1 week, 1 day, 1 hour. (others I don't use). This is the case, because all in life is build by the fibonacci sequence. When you analyse the chart, you'll also see the stock market is behaving itself as the fibonacci sequence. But, still the most difficult part and what it's all about, is where does a long or a short start? and which point is telling you that the cycle is started, so that you know it will probably go to the next fibonacci resistance? .... therefore I have developed some own indicators!
The exact positions of where to open, to close and the stop loss position and take profit position is very important to be successful with trading!
My strategy is to never trade on volatile markets. You will lose your money when you do! Trade on technical-chart analysis! not on news and volatility!
One of my other strategies is that trades are only interesting and ‘safe’ to open when: you can possibly lose 1/3rd of the possible profit. So; when you set the indicators after analysing resistances, and you can lose 100 but win 300, it is worth the try!
How do I decide to open a position or not? First I analyse:
- sentiment on the market > are people in buy mode or short mode
- I have some own created indicators, some I show in my charts. Therefor I use the fibonacci sequence. My indicators tell to open a position or not and in combination with other own created indicators I decide where to place the stop loss and take profit positions.
- and this own indicators tell me when probably a new long position starts or a new short > these are the positions where I place my orders! or open directly.
- and again other own created indicators tell me how far long or short it probably goes. The take profit and stop loss positions are other positions than the resistances in the market!
- the moving-averages and bollinger-bands are very important indicators also. They are helping a lot! by making decisions.
And that is Why I win more than I lose in the end. Patience is everything, we’ll wait for the right moment! But don't forget; trading means investing. Sometimes you lose more than you win in the beginning of a period!
Most of the times the sentiment changes on Monday! please consider that when you start a position on Monday. Tuesday, Wednesday and Thursday are on steady markets normally calm trading days. Than, my strategies work at their best!
Like my analyses? don't forget to follow me, so you get updated when I post new ones. Also read my account and the 'status updates' to be informed.
Thank you for following and Succes with trading !
Richard from Rich.Exclusive.Trading

My main strategy is called 'cycle-trading' a unique concept. My main strategy is called 'cycle-trading'. After years of learning and practicing after I bought a teaching-package from a visionair, I found a way of how to trade successful with CFD's on the stock-market. Every stock is following an certain cycle which repeats itself. So, movements are often appearing in the same percentage, aswel long as short. This cycles appear at all levels; when you analyse the chart at 1 month, 1 week, 1 day, 1 hour. (others I don't use). This is the case, because all in life is build by the fibonacci sequence. When you analyse the chart, you'll also see the stock market is behaving itself as the fibonacci sequence. But, still the most difficult part and what it's all about, is where does a long or a short start? and which point is telling you that the cycle is started, so that you know it will probably go to the next fibonacci resistance? .... therefore I have developed some own indicators!
The exact positions of where to open, to close and the stop loss position and take profit position is very important to be successful with trading!
My strategy is to never trade on volatile markets. You will lose your money when you do! Trade on technical-chart analysis! not on news and volatility!
One of my other strategies is that trades are only interesting and ‘safe’ to open when: you can possibly lose 1/3rd of the possible profit. So; when you set the indicators after analysing resistances, and you can lose 100 but win 300, it is worth the try!
How do I decide to open a position or not? First I analyse:
- sentiment on the market > are people in buy mode or short mode
- I have some own created indicators, some I show in my charts. Therefor I use the fibonacci sequence. My indicators tell to open a position or not and in combination with other own created indicators I decide where to place the stop loss and take profit positions.
- and this own indicators tell me when probably a new long position starts or a new short > these are the positions where I place my orders! or open directly.
- and again other own created indicators tell me how far long or short it probably goes. The take profit and stop loss positions are other positions than the resistances in the market!
- the moving-averages and bollinger-bands are very important indicators also. They are helping a lot! by making decisions.
And that is Why I win more than I lose in the end. Patience is everything, we’ll wait for the right moment! But don't forget; trading means investing. Sometimes you lose more than you win in the beginning of a period!
Most of the times the sentiment changes on Monday! please consider that when you start a position on Monday. Tuesday, Wednesday and Thursday are on steady markets normally calm trading days. Than, my strategies work at their best!
Like my analyses? don't forget to follow me, so you get updated when I post new ones. Also read my account and the 'status updates' to be informed.
Thank you for following and Succes with trading !
Richard from Rich.Exclusive.Trading

Looking for best position to buy. 2815 or 2867. Don't know yet!The stop-loss positions are making this chart very hard. There are huge chances to make huge money! but also huge risks to lose a lot!.
The resistance at 2.600 I don't like at all. When this one gets tested, we're going very deep. I'll wait next week what is going to happen.
--------------------------------------------------------------------------------------------------------------------------------------------------------------------------------------------
My main strategy is called 'cycle-trading' . After years of learning and practicing after I bought a teaching-package from a visionair, I found a way of how to trade successful with CFD's on the stock-market. Every stock is following an certain cycle which repeats itself. So, movements are often appearing in the same percentage, aswel long as short. This cycles appear at all levels; when you analyse the chart at 1 month, 1 week, 1 day, 1 hour. (others I don't use). This is the case, because all in life is build by the fibonacci sequence. When you analyse the chart, you'll also see the stock market is behaving itself as the fibonacci sequence. But, still the most difficult part and what it's all about, is where does a long or a short start? and which point is telling you that the cycle is started, so that you know it will probably go to the next fibonacci resistance? .... therefore I have developed some own indicators!
The exact positions of where to open, to close and the stop loss position and take profit position is very important to be successful with trading!
My strategy is to never trade on volatile markets. You will lose your money when you do! Trade on technical-chart analysis! not on news and volatility!
One of my other strategies is that trades are only interesting and ‘safe’ to open when: you can possibly lose 1/3rd of the possible profit. So; when you set the indicators after analysing resistances, and you can lose 100 but win 300, it is worth the try!
How do I decide to open a position or not? First I analyse:
- sentiment on the market > are people in buy mode or short mode
- I have some own created indicators, some I show in my charts. Therefor I use the fibonacci sequence. My indicators tell to open a position or not and in combination with other own created indicators I decide where to place the stop loss and take profit positions.
- and this own indicators tell me when probably a new long position starts or a new short > these are the positions where I place my orders! or open directly.
- and again other own created indicators tell me how far long or short it probably goes. The take profit and stop loss positions are other positions than the resistances in the market!
- the moving-averages and bollinger-bands are very important indicators also. They are helping a lot! by making decisions.
And that is Why I win more than I lose in the end. Patience is everything, we’ll wait for the right moment! But don't forget; trading means investing. Sometimes you lose more than you win in the beginning of a period!
Most of the times the sentiment changes on Monday! please consider that when you start a position on monade. Tuesday, Wednesday and Thursday are on steady markets normally calm trading days. Than, my strategies work at their best!
Like my analyses? don't forget to follow me, so you get updated when I post new ones. Also read my account and the 'status updates' to be informed.
Thank you for following and Succes with trading !
Richard from Rich.Exclusive.Trading

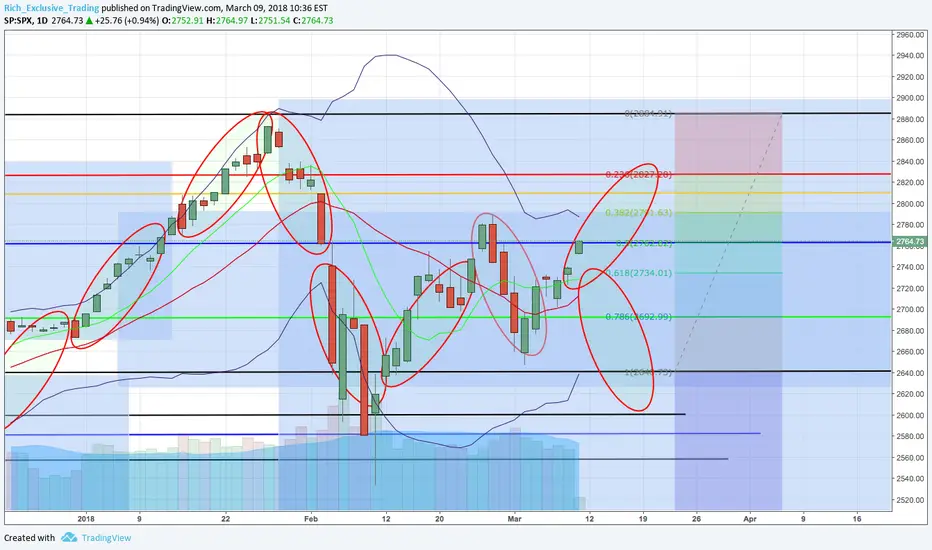
SP500 exactly 50%Fibonacci sequence now. Next week target? read:From this point the price can fall back (retrace) to 2.735 or even 2.693. But also it it possible the positive trend climb further to 2.791 or 2.827 !!
Not the moment to decide now. Let's wait the week to close and let's see how Monday starts. The news around steel and aluminum taxes are calming down.
--------------------------------------------------------------------------------------------------------------------------------------------------------------------------------------------
S&P500 is in horizontal pattern now and I expect this to continue during March and partly April. Maybe the end of April / March a new cycle will start and I expect it to climb further to $3000 dollar! ofcourese we will have some turbulence till we reach that. Another possibility is that it will break the lower resistances and an short cycle starts! than we will have huge shorts an retracemets to $2100 probably! but this can also take some time and happen in more far future. When we decide to go long next week and when we open a long trade, the exact positions of where to open, to close and the stop loss position is very important to be successful with trading!
My strategy is to never trade on volatile markets. You will lose your money when you do! Trade on technical-chart analysis! not on news and volatility!
One of my other strategies is that trades are only interesting and ‘safe’ to open when: you can possibly lose 1/3rd of the possible profit. So; when you set the indicators after analysing resistances, and you can lose 100 but win 300, it is worth the try!
How do I decide to open a position or not? First I analyse:
- sentiment on the market > are people in buy mode or short mode
- I have some own created indicators, some I show in my charts.
- and this own indicators tell me If a new long position starts or a new short > these are the positions where I place my orders!
- and again other own created indicators tell me how far long or short it probably goes. The take profit and stop loss positions are Other positions than the resistances in the market!
And that is Why I win more than I lose. Patience is everything, we’ll wait for the right moment!
Most of the times the sentiment changes on Monday! and Tuesday is a calm trading day.
Like my analyses? don't forget to follow me, so you get updated when I post new ones. Also read my account and the 'status updates' to be informed.
Thank you for following and Succes with trading !
Richard from Rich.Exclusive.Trading
NaturalGas at important resistance now. Will it go long further?NaturalGas at important resistance now. Will it go long further?
NaturalGas is very interesting now. It broak 2.755 which is an important breaking point. When it does, 2.845 we are going to look for opening a long position!
After years of studying, learning and practicing I have developed a way of trading which can provide an profit every month by trading cfd's.
The strategy I learned from an visionair is 'Cycle trading' and I have developed this further and made it my own.
How do I decide to open a position or not? First I analyse:
- sentiment on the market > are people in buy mode or short mode
- I have some own created indicators, some I show in my charts, as; is the trend horizontal / uptrend or downtrend or volatile.
- and this own indicators tell me when probably a new long position starts or a new short > these are the positions where I place my orders! one of the indicators I use here to help me is the Fibonacci sequence.
- and again other own created indicators tell me how far long or short it probably goes. The take profit and stop loss positions are Other positions than the resistances in the market! Here I work with 'the total expected possible profit' and an percentage from this total opportunity where I mostly close the trade to be safe.
And that's not all at all. Also I check if the opportunity is interesting, by analyzing the charts and when I can make the conclusion that when I should open an certain trade and the possible profit would be 2/3rd of the amount you can possibly lose. So, in bad case lose 100 dollar and best case win 300 dollar it is worth the try! losing these kind of trades, I see as an investment on the possible loss. Stop loss needs to be tight here.
Patience is everything, we’ll wait for the right moment!
Sometimes we are in huge loss, before we end the month in good profit. This is all part of the game. Without trading positions which we lose, we could never win more than we lose. Losing orders is investing in the knowledge to trade the right one to earn money.
Thank you for following and Succes with trading ! and please check my main TradingView account!
When you like my ideas, please follow me, so you don't miss my analyses and my 'status updates' !
Richard from Rich.Exclusive.Trading

Copper can break 3,0250. Risk for possibly 17% movement. Will Copper go long or short?. When the Copper price breaks 3,0250 or 3,223 an 17% movement is expected.
The chart can bounce back when the top or bottom price gets touched, the pattern is horizontal now. But WHEN IT BREAKS it will make a movement of probably 17% (always in parts).... So I hold my breath when we reach 3,0250.
After years of studying, learning and practicing I have developed a way of trading which can provide an profit every month by trading cfd's.
The strategy I learned from an visionair is 'Cycle trading' and I have developed this further and made it my own.
How do I decide to open a position or not? First I analyse:
- sentiment on the market > are people in buy mode or short mode
- I have some own created indicators, some I show in my charts, as; is the trend horizontal / uptrend or downtrend or volatile.
- and this own indicators tell me when probably a new long position starts or a new short > these are the positions where I place my orders! one of the indicators I use here to help me is the Fibonacci sequence.
- and again other own created indicators tell me how far long or short it probably goes. The take profit and stop loss positions are Other positions than the resistances in the market! Here I work with 'the total expected possible profit' and an percentage from this total opportunity where I mostly close the trade to be safe.
And that's not all at all. Also I check if the opportunity is interesting, by analyzing the charts and when I can make the conclusion that when I should open an certain trade and the possible profit would be 2/3rd of the amount you can possibly lose. So, in bad case lose 100 dollar and best case win 300 dollar it is worth the try! losing these kind of trades, I see as an investment on the possible loss. Stop loss needs to be tight here.
Patience is everything, we’ll wait for the right moment!
Sometimes we are in huge loss, before we end the month in good profit. This is all part of the game. Without trading positions which we lose, we could never win more than we lose. Losing orders is investing in the knowledge to trade the right one to earn money.
Thank you for following and Succes with trading ! and please check my main TradingView account!
When you like my ideas, please follow me, so you don't miss my analyses and my 'status updates' !
Richard from Rich.Exclusive.Trading

Cocoa at heavy resistance now 2443. Short or long? check my ideaCocoa is at a heavy resistance now, 2443. Will it go Short or long?
Price is exactly between two fibonacci resistances now; 2524 and 2368. I think price will bounce between these two before it breaks long or short.
When it breaks the long resistance 2524, I see a target of 2674. When it breaks low; target 2153.
Most difficult part are the exact positions where to buy and positions stop loss.
I have some ideas about which positions to place orders, but I'll try some movements before opening them.
After years of studying, learning and practicing I have developed a way of trading which can provide an profit every month by trading cfd's.
The strategy I learned from an visionair is 'Cycle trading' and I have developed this further and made it my own.
How do I decide to open a position or not? First I analyse:
- sentiment on the market > are people in buy mode or short mode
- I have some own created indicators, some I show in my charts, as; is the trend horizontal / uptrend or downtrend or volatile.
- and this own indicators tell me when probably a new long position starts or a new short > these are the positions where I place my orders! one of the indicators I use here to help me is the Fibonacci sequence.
- and again other own created indicators tell me how far long or short it probably goes. The take profit and stop loss positions are Other positions than the resistances in the market! Here I work with 'the total expected possible profit' and an percentage from this total opportunity where I mostly close the trade to be safe.
And that's not all at all. Also I check if the opportunity is interesting, by analyzing the charts and when I can make the conclusion that when I should open an certain trade and the possible profit would be 2/3rd of the amount you can possibly loss. So, in bad case lose 100 dollar and best case win 300 dollar it is worth the try! losing these kind of trades, I see as an investment on the possible loss. Stop loss needs to be tight here.
Patience is everything, we’ll wait for the right moment!
Sometimes we are in huge loss, before we end the month in good profit. This is all part of the game. Without trading positions which we lose, we could never win more than we lose. Losing orders is investing in the knowledge to trade the right one to earn money.
Thank you for following and Succes with trading !
Richard from Rich.Exclusive.Trading

S&P500 $2640 not broken. Still bullish. Sentiment Monday decidesS&P500 $2640 is not broken last week. I am Still bullish. The Sentiment next Monday on the market decides if it is the right time to go long again!
S&P500 is in horizontal pattern now and I expect this to continue during March and partly April. Maybe the end of April / March a new cycle will start and I expect it to climb further to $3000 dollar! ofcourese we will have some turbulence till we reach that. Another possibility is that it will break the lower resistances and an short cycle starts! than we will have huge shorts an retracemets to $2100 probably! but this can also take some time and happen in more far future. When we decide to go long next week and when we open a long trade, the exact positions of where to open, to close and the stop loss position is very important to be successful with trading!
S&P500 is in 3 monthly cycle now. I expect this to become an horizontal chart till the end of March. April / May I expect a new hugh climb will start. OR when an invert cycle starts, when lower resistances are broken, a huge short will appear. In my opinion S&P500 is very overbought. One day it will collapse to $2100 area. That will be the retracement to the previous horizontal pattern. Till that time we are bullish!
My strategy is to never trade on volatile markets. You will lose your money when you do! Just like last week, when came up unexpected volatility , we lost two trades S&P500 and also two trades Oil. The won positions a few days before were at a steady market. Trade on technical-chart analysis! not on news and volatility!
Well, one of my other strategies is that trades are only interesting and ‘safe’ to open when: you can possibly lose 1/3rd of the possible profit. So; when you set the indicators after analysing resistances, and you can lose 100 but win 300, it is worth the try!
How do I decide to open a position or not? First I analyse:
- sentiment on the market > are people in buy mode or short mode
- I have some own created indicators, some I show in my charts.
- and this own indicators tell me If a new long position starts or a new short > these are the positions where I place my orders!
- and again other own created indicators tell me how far long or short it probably goes. The take profit and stop loss positions are Other positions than the resistances in the market!
And that is Why I win more than I lose. Patience is everything, we’ll wait for the right moment!
Most of the times the sentiment changes on Monday!
Thank you for following and Succes with trading !
Richard from Rich.Exclusive.Trading

Oil is still bullish. As long as we are not breaking 59 dollarOil is still in bullish position. As long as we are not breaking 59 dollar I still believe we are in uptrend and the price can rise to 75 dollar. We have reached a critic point last week, but the week ended positive. The sentiment next Monday will decide if it will be interesting to open a long cfd!
My strategy is to never trade on volatile markets. You will lose your money when you do! Just like last week, when came up unexpected volatility at oil, and we lost two trades. The won position a day before was at a steady market.
Well, one of my other strategies is that trades are only interesting and ‘safe’ to open when: you can possibly lose 1/3rd of the possible profit. So; when you set the indicators after analysing resistances, and you can lose 100 but win 300, it is worth the try!
Now, I see a opportunity on Oil. The chart is horizontal but the upper horizontal resistance is broken. I have pointed out the breakingpoint with the black vertical line! Last week it retraced, but when it stays above $59 dollar we are still in uptrend!
How do I decide to open a position or not? First I analyse:
- sentiment on the market > are people in buy mode or short mode
- I have some own created indicators
- and this own indicators tell me If a new long position starts or a new short > these are the positions where I place my orders!
- and again other own created indicators tell me how far long or short it probably goes. The take profit and stop loss positions are Other positions than the resistances in the market!
And that is Why I win more than I lose. Patience is everything, we’ll wait for the right moment!
Most of the times the sentiment changes on Monday!
Thank you for following and Succes with trading !
Richard from Rich.Exclusive.Trading

Gas very interesting now. Waiting for making a big move. Long??NaturalGas is very interesting now. 2.755 is a breaking point, which I am Waiting the chart to pass. When it does, 2.852 looks like a good position to open a trade! following my unique strategy. NaturalGas is now waiting to making a big move. Long?? Chart is horizontal pattern!
My strategy is to never trade on volatile markets. You will lose your money when you do! Just like last week, when came up unexpected volatility at oil, and we lost two trades. The won position a day before was at a steady market.
Well, one of my other strategies is that trades are only interesting and ‘safe’ to open when: you can possibly lose 1/3rd of the possible profit. So; when you set the indicators after analysing resistances, and you can lose 100 but win 300, it is worth the try!
Now, I see a opportunity on NaturalGas. The chart is horizontal and the lower horizontal resistance is almost touched.When it breaks it is time to open a long.
How do I decide to open a position or not? First I analyse:
- sentiment on the market > are people in buy mode or short mode
- I have some own created indicators
- and this own indicators tell me If a new long position starts or a new short > these are the positions where I place my orders!
- and again other own created indicators tell me how far long or short it probably goes. The take profit and stop loss positions are Other positions than the resistances in the market!
And that is Why I win more than I lose. Patience is everything, we’ll wait for the right moment!
Most of the times the sentiment changes on Monday!
Thank you for following and Succes with trading !
Richard from Rich.Exclusive.Trading
