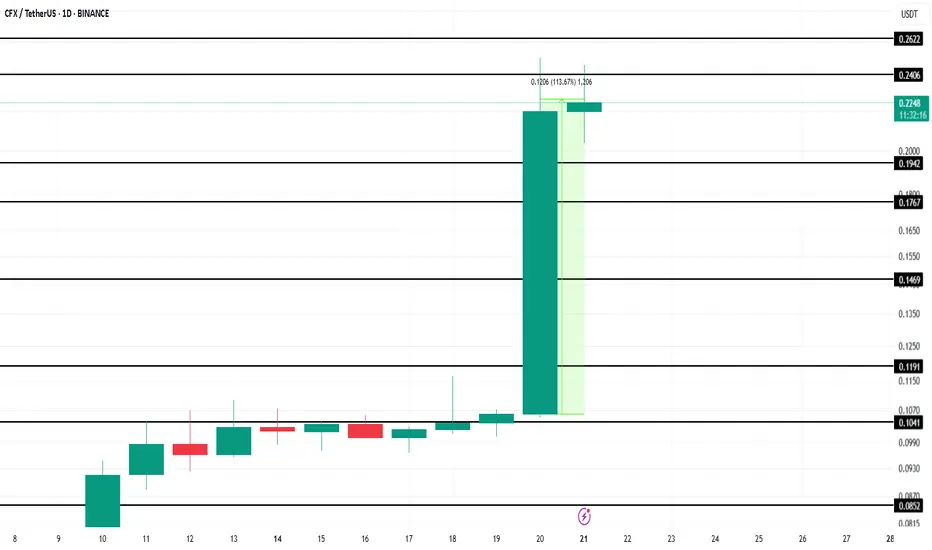
Altcoin To Watch This Week - Conflux (CFX) And Its 113% RiseBINANCE:CFXUSDT has seen a major rally, becoming one of the top-performing altcoins in recent days. Boosted by the recent Conflux Conference in Shanghai, CFX surged 113% in the last 24 hours. The altcoin is now trading at $0.22, drawing investor attention amid heightened momentum and renewed community optimism.
Excitement continues to grow as BINANCE:CFXUSDT gears up for its 3.0 upgrade , scheduled for early August. This major milestone could act as a bullish catalyst. If CFX rebounds from the $0.17 support level, the altcoin may breach $0.24 and potentially rise toward the key psychological mark of $0.30 in the short term.
However, risk remains if investors begin securing profits after the significant gains. A drop below the $0.17 support could drive BINANCE:CFXUSDT lower toward $0.11 . Such a move would reverse current bullish momentum, causing traders to reassess expectations as bearish sentiment overtakes the altcoin’s rally.
CFXBTC
CFXUSDT | Sellers Still in ControlI’ve seen this pattern before. CFXUSDT is still under pressure from strong sellers , and nothing has shifted yet to flip the bias.
The red box remains a key resistance. Until that level is clearly broken and turns into support with a proper retest, there’s no reason to look bullish .
If you're patient and wait for structure to shift, you’ll avoid the traps most traders walk into.
“I will not insist on my short idea. If the levels suddenly break upwards and do not give a downward break in the low time frame, I will not evaluate it. If they break upwards with volume and give a retest, I will look long.”
This is how high win rates are built . Not by guessing, but by reacting to confirmation.
📌I keep my charts clean and simple because I believe clarity leads to better decisions.
📌My approach is built on years of experience and a solid track record. I don’t claim to know it all but I’m confident in my ability to spot high-probability setups.
📌If you would like to learn how to use the heatmap, cumulative volume delta and volume footprint techniques that I use below to determine very accurate demand regions, you can send me a private message. I help anyone who wants it completely free of charge.
🔑I have a long list of my proven technique below:
🎯 ZENUSDT.P: Patience & Profitability | %230 Reaction from the Sniper Entry
🐶 DOGEUSDT.P: Next Move
🎨 RENDERUSDT.P: Opportunity of the Month
💎 ETHUSDT.P: Where to Retrace
🟢 BNBUSDT.P: Potential Surge
📊 BTC Dominance: Reaction Zone
🌊 WAVESUSDT.P: Demand Zone Potential
🟣 UNIUSDT.P: Long-Term Trade
🔵 XRPUSDT.P: Entry Zones
🔗 LINKUSDT.P: Follow The River
📈 BTCUSDT.P: Two Key Demand Zones
🟩 POLUSDT: Bullish Momentum
🌟 PENDLEUSDT.P: Where Opportunity Meets Precision
🔥 BTCUSDT.P: Liquidation of Highly Leveraged Longs
🌊 SOLUSDT.P: SOL's Dip - Your Opportunity
🐸 1000PEPEUSDT.P: Prime Bounce Zone Unlocked
🚀 ETHUSDT.P: Set to Explode - Don't Miss This Game Changer
🤖 IQUSDT: Smart Plan
⚡️ PONDUSDT: A Trade Not Taken Is Better Than a Losing One
💼 STMXUSDT: 2 Buying Areas
🐢 TURBOUSDT: Buy Zones and Buyer Presence
🌍 ICPUSDT.P: Massive Upside Potential | Check the Trade Update For Seeing Results
🟠 IDEXUSDT: Spot Buy Area | %26 Profit if You Trade with MSB
📌 USUALUSDT: Buyers Are Active + %70 Profit in Total
🌟 FORTHUSDT: Sniper Entry +%26 Reaction
🐳 QKCUSDT: Sniper Entry +%57 Reaction
📊 BTC.D: Retest of Key Area Highly Likely
📊 XNOUSDT %80 Reaction with a Simple Blue Box!
📊 BELUSDT Amazing %120 Reaction!
📊 Simple Red Box, Extraordinary Results
I stopped adding to the list because it's kinda tiring to add 5-10 charts in every move but you can check my profile and see that it goes on..

TradeCityPro | CFXUSDT A Wild Week of Volatility Ahead?👋 Welcome to TradeCityPro Channel!
Let’s dive in and analyze another altcoin in the market, CFX, which is likely to experience a highly volatile week ahead, offering great trading opportunities.
🌐 Overview Bitcoin
Before starting the analysis, I want to remind you again that we moved the Bitcoin analysis section from the analysis section to a separate analysis at your request, so that we can discuss the status of Bitcoin in more detail every day and analyze its charts and dominances together.
This is the general analysis of Bitcoin dominance, which we promised you in the analysis to analyze separately and analyze it for you in longer time frames.
🕒 Weekly Time Frame
CFX stands out as an older coin with prior bull-run experience. It’s trading above last year’s lows and hasn’t experienced steep declines.
Yesterday, we analyzed this coin briefly, but today, we’ll go into more detail. Unlike most altcoins that began their bullish moves from their lowest levels, CFX has already started its upward trajectory from 0.1219.
Fibonacci analysis shows that 0.1219 aligns with the 50% retracement level—a significant support both in Fibonacci terms and Dow Theory. After forming a range around this level and breaking the 0.1810 trigger, the coin moved toward its first target at 0.2596.
However, we were rejected at 0.2596 and even lost the critical support at 0.1087, dropping to the next support at 0.0647. Currently, it appears we’re pulling back to the key 0.1087 level.
📊 Daily Time Frame
On the daily chart, CFX was in a ranging box, forming higher lows. A breakout above 0.1851 was accompanied by a strong entry candle with buyer momentum, an RSI entry signal, and volume confirmation. Stop-loss was set at the daily low of 0.14.
If you followed this trigger, you’re likely in profit despite the current red daily candle. This correction is healthy, as an uptrend without pullbacks or red candles is often unsustainable.
After breaking the daily box between 0.1046 and 0.1230 and losing its support with an engulfing candle, we experienced a downward move to 0.0647. From there, sellers effectively exited the market, and buyers showed strength. After breaking 0.0823, we formed higher highs and lows. Now, after breaking 0.1046, we can consider buying for spot, with the main trigger being a break of 0.1230.
✍️ Final Thoughts
Stay level headed, trade with precision, and let’s capitalize on the market’s top opportunities!
This is our analysis, not financial advice always do your own research.
What do you think? Share your ideas below and pass this along to friends! ❤️

#CFX/USDT#CFX
The price is moving within a descending channel on the 1-hour frame and is expected to continue lower.
We have a trend to stabilize above the 100 moving average once again.
We have a downtrend on the RSI indicator that supports the decline with a break below.
We have a support area at the upper limit of the channel at 0.0815.
Entry price: 0.0815
First target: 0.0788
Second target: 0.0763
Third target: 0.0740

#CFX/USDT#CFX
The price is moving in a descending channel on the 1-hour frame and is expected to continue upwards
We have a trend to stabilize above the moving average 100 again
We have a descending trend on the RSI indicator that supports the rise by breaking it upwards
We have a support area at the lower limit of the channel at a price of 0.0950
Entry price 0.1000
First target 0.1033
Second target 0.1073
Third target 0.1123

CFX roadmap (3D)By analyzing the complete CFX data, it can be observed that wave C of a larger structure has been completed.
Wave C formed a triangle, and its final wave, wave E, has also been completed.
It is expected to remain bearish in the long term and eventually deliver good returns from the green zone in the future.
A daily candle closing above the invalidation level will invalidate this outlook.
For risk management, please don't forget stop loss and capital management
Comment if you have any questions
Thank You

#CFX/USDT #CFX
The price is moving in a descending channel on the 1-hour frame and is adhering to it well and is heading to break it strongly upwards
We have a bounce from the lower limit of the descending channel, this support is at a price of 0.1455
We have a downtrend on the RSI indicator that is about to be broken, which supports the rise
We have a trend to stabilize above the moving average 100
Entry price 0.1500
First target 0.1570
Second target 0.1660
Third target 0.1743

#CFX/USDT#CFX
The price is moving in a descending channel on the 4-hour frame and sticking to it well
We have a bounce from the lower limit of the descending channel, this support is at 0.1242
We have an upward trend, the RSI indicator is about to break, which supports the rise
We have a trend to stabilize above the moving average 100
Entry price 0.1485
First target 0.1621
Second target 0.1770
Third target 0.1955

CFXUSDT: Is the Next Big Pump Brewing in the Blue Box?CFXUSDT Analysis Promising Setup with Volume Increase
CFXUSDT is showing strength with a notable volume spike. This could be a solid opportunity if the price reaches the blue box.
Highlights:
Volume Increase: Strong market activity supports the bullish potential.
Blue Box Entry: I plan to enter near the blue box with a stop below the most recent low.
For Risk-Reward Seekers: Those looking for higher risk-to-reward setups can wait for upward breaks in lower time frames within the blue box for confirmation.
Key Observations:
"The blue box is very carefully picked using volume footprint, volume profile, cumulative delta volume, and liquidity heatmap. When trading this zone, I will look for buyers and upward market structure breaks in lower time frames for confirmation."
This setup has potential, but as always, wait for confirmation before acting. 🚀
Let me tell you, this is something special. These insights, these setups—they’re not just good; they’re game-changers. I've spent years refining my approach, and the results speak for themselves. People are always asking, "How do you spot these opportunities?" It’s simple: experience, clarity, and a focus on high-probability moves.
Want to know how I use heatmaps, cumulative volume delta, and volume footprint techniques to find demand zones with precision? I’m happy to share—just send me a message. No cost, no catch. I believe in helping people make smarter decisions.
Here are some of my recent analyses. Each one highlights key opportunities:
🚀 RENDERUSDT: Strategic Support Zones at the Blue Boxes +%45 Reaction
🎯 PUNDIXUSDT: Huge Opportunity | 250% Volume Spike - %60 Reaction Sniper Entry
🌐 CryptoMarkets TOTAL2: Support Zone
🚀 GMTUSDT: %35 FAST REJECTION FROM THE RED BOX
🎯 ZENUSDT.P: Patience & Profitability | %230 Reaction from the Sniper Entry
🎯 DEXEUSDT %180 Reaction with %9 Stop
🐶 DOGEUSDT.P: Next Move
🎨 RENDERUSDT.P: Opportunity of the Month
💎 ETHUSDT.P: Where to Retrace
🟢 BNBUSDT.P: Potential Surge
📊 BTC Dominance: Reaction Zone
🌊 WAVESUSDT.P: Demand Zone Potential
🟣 UNIUSDT.P: Long-Term Trade
🔵 XRPUSDT.P: Entry Zones
🔗 LINKUSDT.P: Follow The River
📈 BTCUSDT.P: Two Key Demand Zones
🟩 POLUSDT: Bullish Momentum
🌟 PENDLEUSDT.P: Where Opportunity Meets Precision
🔥 BTCUSDT.P: Liquidation of Highly Leveraged Longs
🌊 SOLUSDT.P: SOL's Dip - Your Opportunity
🐸 1000PEPEUSDT.P: Prime Bounce Zone Unlocked
🚀 ETHUSDT.P: Set to Explode - Don't Miss This Game Changer
🤖 IQUSDT: Smart Plan
⚡️ PONDUSDT: A Trade Not Taken Is Better Than a Losing One
💼 STMXUSDT: 2 Buying Areas
🐢 TURBOUSDT: Buy Zones and Buyer Presence
🌍 ICPUSDT.P: Massive Upside Potential | Check the Trade Update For Seeing Results
🟠 IDEXUSDT: Spot Buy Area | %26 Profit if You Trade with MSB
📌 USUALUSDT: Buyers Are Active + %70 Profit in Total
🌟 FORTHUSDT: Sniper Entry +%26 Reaction
🐳 QKCUSDT: Sniper Entry +%57 Reaction
📊 BTC.D: Retest of Key Area Highly Likely
This list? It’s just a small piece of what I’ve been working on. There’s so much more. Go check my profile, see the results for yourself. My goal is simple: provide value and help you win. If you’ve got questions, I’ve got answers. Let’s get to work!

TradeCityPro | CFXUSDT Analysis: Don’t Fear the Red Candles!👋 Welcome to TradeCityPro Channel!
Let’s dive into the first day of the week where we’ve seen red candles and minor corrections. This is a good time to review our coins and prepare our triggers.
🌍 Market Overview
Before analyzing CFX, let’s take a quick look at Bitcoin. It faced a strong rejection at 100,400 and printed a significant red candle. But what should we do in such cases? For now, nothing. The trend remains bullish, and Bitcoin dominance is also correcting.
If Bitcoin’s dominance continues to drop and forms a lower high on the daily timeframe while the market remains bullish, keep an eye on the charts for potential altcoin entries. This scenario could signal the start of a bull run.
🕒 Weekly Time Frame
CFX stands out as an older coin with prior bull-run experience. It’s trading above last year’s lows and hasn’t experienced steep declines.
Yesterday, we analyzed this coin briefly, but today, we’ll go into more detail. Unlike most altcoins that began their bullish moves from their lowest levels, CFX has already started its upward trajectory from 0.1219.
Fibonacci analysis shows that 0.1219 aligns with the 50% retracement level—a significant support both in Fibonacci terms and Dow Theory. After forming a range around this level and breaking the 0.1810 trigger, the coin moved toward its first target at 0.2596.
For further targets, use Fibonacci extensions from the same 0.5 range. Once 0.5171 is broken, potential targets include 0.7385, 1.21, and 2.26.
If you entered at 0.181, holding your position is advised. For re-entry, consider buying after the 0.2596 breakout with a stop-loss at 0.1219. RSI confirmation above 76.18 would also validate the entry.
📊 Daily Time Frame
On the daily chart, CFX was in a ranging box, forming higher lows. A breakout above 0.1851 was accompanied by a strong entry candle with buyer momentum, an RSI entry signal, and volume confirmation. Stop-loss was set at the daily low of 0.14.
If you followed this trigger, you’re likely in profit despite the current red daily candle. This correction is healthy, as an uptrend without pullbacks or red candles is often unsustainable.
For re-entry, consider buying after the 0.2596 breakout with a stop-loss at 0.14. Alternatively, a pullback to 0.1851 with confirmation from a bullish candle could also provide a good entry point.
🕒 4-Hour Time Frame
Let’s discuss how you could have entered positions earlier. After the 0.1905 breakout, a bullish engulfing candle (covering the prior two candles) marked the entry trigger. The stop-loss was set below the previous low, ensuring a secure long position with a good risk-reward ratio.
But would you really use a 14% stop-loss in futures trading? Yes, in volatile conditions like this, a larger stop-loss ensures safety and increases win rates. It’s better to risk 1% with higher win rates than repeatedly hit small stop-losses, which could harm your trading psychology.
📈 Long Position Trigger
wait for the 0.2596 breakout or RSI returning to its range, coupled with momentum confirmation in lower timeframes.
In bullish markets, an RSI recovery from oversold levels and breaking above 30 can also serve as an early long trigger.
📉 Short Position Trigger
For shorts, I still advise against them. For example, shorting the 0.2412 breakdown with a stop-loss at 0.2596 would’ve only offered a 1:1 risk-reward ratio, going against the primary trend.
💡 BTC Pair Insight
Against Bitcoin, CFX has held its 0.00000164 support and found strength. After breaking the 0.00000294 trigger, the coin is expected to deliver its main moves in the USDT pair. If the market remains bullish, CFX could showcase significant upward momentum.
📝 Final Thoughts
Stay calm, trade wisely, and let's capture the market's best opportunities!
This analysis reflects our opinions and is not financial advice.
Share your thoughts in the comments, and don’t forget to share this analysis with your friends! ❤️

CFXUSDT Breaks Double-Bottom ResistanceCFXUSDT Technical analysis update
CFX/USDT price found strong support at $0.10 and bounced 110% from this level, forming a potential double-bottom pattern. The price is now breaking the neckline resistance on the daily chart while trading above the 100 and 200 EMA. This setup indicates a possible 100-200% bullish move from the current levels.

CFX is super bullish (2D)It appears to be within a large diametric pattern where wave E has recently concluded. After a brief period of consolidation or minor negative fluctuations, it could move toward the targets of wave E.
By maintaining the green zone, the price may move upward.
Closing a daily candle below the invalidation level will invalidate this analysis
For risk management, please don't forget stop loss and capital management
Comment if you have any questions
Thank You

#CFX (SPOT) entry range(0.1200- 0.1600) T.(0.4630) SL(0.1181)BINANCE:CFXUSDT
entry range (0.1200- 0.1600)
Target1 (0.2230) - Target2 (0.3330) - Target3 (0.3900) - Target4 (0.4630)
SL .1D close below (0.1181)
*** collect the coin slowly in the entry range ***
*** No FOMO - No Rush , it is a long journey ***
**** #Manta ,#OMNI, #DYM, #AI, #IO, #XAI , #ACE #NFP #RAD #WLD #ORDI #BLUR #SUI #Voxel #AEVO #VITE #APE #RDNT #FLUX #NMR #VANRY #TRB #HBAR #DGB #XEC #ERN #ALT #IO #ACA #HIVE #ASTR #ARDR #PIXEL #LTO #AERGO #SCRT #ATA #HOOK #FLOW #KSM #HFT #MINA #DATA #SC #JOE #RDNT #IQ #CFX ****

CFX ROADMAP (1D)From where we put the red arrow on the chart, it looks like CFX is forming a big triangle, and we are now in the middle of wave D of this triangle.
Wave D looks like a diamond diametric. It seems that we are in the middle of the F wave of this diametric.
It can move from the red box to the green box.
We are looking for sell/short positions in the supply range.
We are looking for buy/long positions in the green range.
Closing a daily candle above the invalidation level will violate the analysis.
For risk management, please don't forget stop loss and capital management
Comment if you have any questions
Thank You

#CFX/USDT#CFX
The price is moving in a descending channel on the 4-hour frame and is sticking to it very well and is expected to break it upwards
We have a bounce from a major support area in green at 0.1260
We have a downtrend on the RSI indicator that was broken upwards which supports the rise
We have a trend to stabilize above the 100 moving average which supports the rise
Entry price 0.1340
First target 0.1420
Second target 0.1500
Third target 0.1580

CFX explanationCFX update! I am holding it.
We took a CFX trade back then; it gave 50-55% profit on spot with its first target being hit. Then we bought CFX at $0.28 for mid-term on spot without a stop-loss. I expect it to run along with APT when APT will pump. Holding it tight.
It will have its day.

CFX looks bullishThe price compression is seen on the support.
We have a bullish iCH on the chart.
The trigger line is broken.
By maintaining the demands, it can move towards the targets.
The targets are clear on the chart.
Closing a daily candle below the invalidation level will violate the analysis.
For risk management, please don't forget stop loss and capital management
When we reach the first target, save some profit and then change the stop to entry
Comment if you have any questions
Thank You

#CFX/USDT#CFX
The price is moving within a bearish channel on a 1-day frame and is strongly committed to it.
We have a support area at 0.1935 and we bounced from it at the lower border of the channel
We have a tendency to stabilize above the Moving Average 100
We have a downtrend on the RSI indicator that supports the rise
Entry price is 0.2100
The first target is 0.2677
The second target is 0.3079
The third goal is 0.3537

CFXBTC CFXUSDT to the infinite /500-1000% pump in April-MayHi my lovely followers, I hope you are fine.
I want to share my ideas about one of th best projects in crypto space.
It is definitly Conflux/ $CFX/ Which will be one of few winners in 2024. It will record new highs createding unforgetable and Legendary story in crypto space.
I'm sure with BSIM+ BTC L2/staking BTC on CFX+ Hong Kond dollar stablecoin launch/ in April-May 2024 + #AI+#RWA+#DEPIN+#NFT+#GAMING+#DEFI conencted with Conflux is coming.
As you see on my weekly CFXBTC chart it is mega bullish, it broke long term accumulation phase made a beautifulo retest and ready to go parabolic. This is 3rd wave which will be more aggressive than previous 1st wave back in 2023 Q1 when it jumped x10, CFX completed its wave 2 correction and started its MMBM which will send it significantly higher towards 2.4-3$+ in April-May.
Don't forget to check all analyses below this tweet, where you will find more details/CFXUSDT chart, CFX-FET identical charts.
Please like, commenct and hit follow bottun.

#CFX/USDT#CFX
The price has been trading in a bearish channel since April 2022
The price recently broke this channel strongly
The price also broke the moving average of 100 on the frame 1 D .
We had a strong support area at price 0.1000
The price rebounded upward
The price now is 0.1783.
First goal of 0.2015 .
Second goal 0.3288 .
This rise is supported by oversold conditions on the MACD
And the free moving momentum after it was broken
It is expected that the price will take some time with corrections to reach the second target

#CFX/USDT#CFX
The price is moving in a bearish flag on the 4-hour frame
We are now on the verge of breaking the channel upwards
After the price rebounded from touching the uptrend as a support area at the .2200 level
We have stability above moving average 100
We also have support from the RSI indicator
Current price 0.2233
First target 0.2266
Second target 0.2331
Third goal 0.2401

CFX sitting on 0.618 level!!!Cfx, A chinese narrative token, is currently sitting on 0.618 level on fibonacci...
What do you think Will it give a god candle soon??

CFX/BTC - Conflux Network: Trend Reversal◳◱ On the $CFX/ CRYPTOCAP:BTC chart, the Trend Reversal pattern suggests indications that the trend may be gaining or losing strength. Traders might observe resistance around 0.00000526 | 0.000006 | 0.0000072 and support near 0.00000406 | 0.0000036 | 0.0000024. Entering trades at 0.00000495 could be strategic, aiming for the next resistance level.
◰◲ General info :
▣ Name: Conflux Network
▣ Rank: 94
▣ Exchanges: Binance, Kucoin, Hitbtc
▣ Category/Sector: Infrastructure - Smart Contract Platforms
▣ Overview: Conflux Network is a smart contract platform that features a Turing-complete state machine built atop a high-throughput consensus protocol. Conflux reaches an agreement on transaction validator based on the total order of blocks organized in a Tree-Graph, a novel consensus mechanism that scaling benefits relative to existing blockchains. It also uses Proof-of-Work (PoW) to supplement its Tree-Graph consensus protocol. Conflux has a native token called CFX that serves as the reward for network miners and as a means for paying transaction fees.
◰◲ Technical Metrics :
▣ Mrkt Price: 0.00000495 ₿
▣ 24HVol: 25.206 ₿
▣ 24H Chng: 10.0%
▣ 7-Days Chng: 12.51%
▣ 1-Month Chng: 6.03%
▣ 3-Months Chng: 30.72%
◲◰ Pivot Points - Levels :
◥ Resistance: 0.00000526 | 0.000006 | 0.0000072
◢ Support: 0.00000406 | 0.0000036 | 0.0000024
◱◳ Indicators recommendation :
▣ Oscillators: NEUTRAL
▣ Moving Averages: STRONG_BUY
◰◲ Technical Indicators Summary : STRONG_BUY
◲◰ Sharpe Ratios :
▣ Last 30D: -0.73
▣ Last 90D: 1.04
▣ Last 1-Y: 1.70
▣ Last 3-Y: 0.46
◲◰ Volatility :
▣ Last 30D: 1.08
▣ Last 90D: 1.18
▣ Last 1-Y: 1.96
▣ Last 3-Y: 1.81
◳◰ Market Sentiment Index :
▣ News sentiment score is N/A
▣ Twitter sentiment score is N/A
▣ Reddit sentiment score is 0.62 - Bullish
▣ In-depth CFXBTC technical analysis on Tradingview TA page
▣ What do you think of this analysis? Share your insights and let's discuss in the comments below. Your like, follow and support would be greatly appreciated!
◲ Disclaimer
Please note that the information and publications provided are for informational purposes only and should not be construed as financial, investment, trading, or any other type of advice or recommendation. We encourage you to conduct your own research and consult with a qualified professional before making any financial decisions. The use of the information provided is solely at your own risk.
▣ Welcome to the home of charting big: TradingView
Benefit from a ton of financial analysis features, instruments and data. Have a look around, and if you do choose to go with an upgraded plan, you'll get up to $30.
Discover it here - affiliate link -
