CfxBreakdown of the downtrend in the weekly time frame,,continue to the target of $1 and $1.7,,,check to buy
CFXUSD

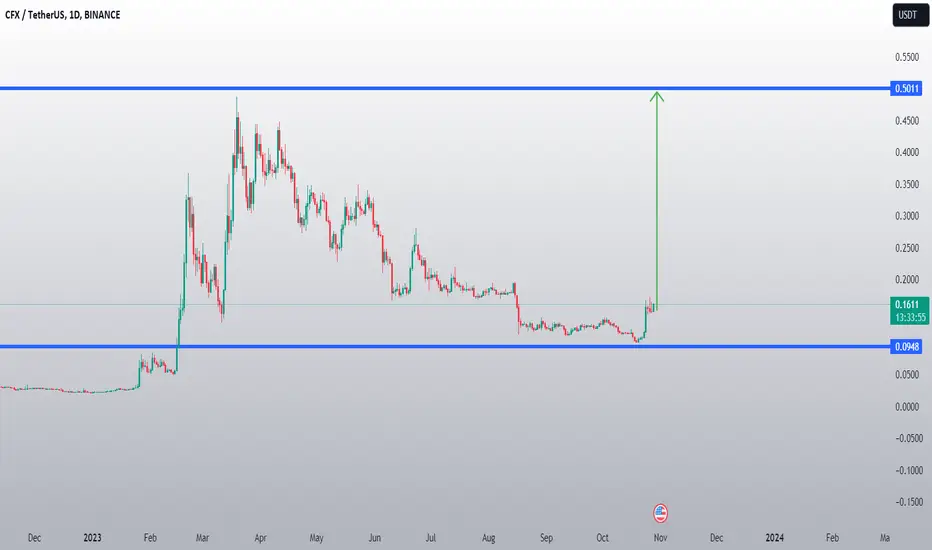
CFX IS BULLISHWe have large structures.
In our opinion, the wave b of C is over and the price is ready to move towards the targets of wave c of C.
By maintaining two green lines, powerful pumps can appear
Do not enter the position without setting stop loss and capital management

The two CFX targets are +44% and 117% from current values.Hey, everybody!
How bullish CONFLUX looks!
There are upside signals on absolutely all timeframes.
On the weekly timeframe a bullish candle has formed, which absorbed all the previous weeks of consolidation and price decline.
The main restraining factor for the price growth now is EMA 200, after its breakdown I expect the continuation of growth up to the area of ~$0.226 (+44%), and then the final target is 0.618 by Fibo 0.339 (+117%) from the current values.
This is not financial advice, everything you do is at your own risk!

CFX 1D BUYCFX 1D support is now at ~$0.14
Enter 50% at the current price
and try to set some BUY orders near the support zone
If CFX stays above the trendline,
the Take-Profit target would be 5%, 10%, and 15% from your entry
Cheers

CFX has a drop aheadThe CFX symbol is near a fresh resistance that is higher for the time frame. It has collected several liquidity pools.
Weakness can be seen in the recent movement and the liquidity pool has been formed below the price. It is expected to drop and correct when it hits the red boxes.
For risk management, please don't forget stop loss and capital management
Comment if you have any questions
Thank You

CFX / CFXUSDTGood Luck >>
• Warning •
Any deal I share does not mean that I am forcing you to enter into it, you enter in with your full risk, because I'll not gain any profits with you in the end.
The risk management of the position must comply with the stop loss.
(I am not sharing financial or investment advice, you should do your own research for your money.)

CFX IS ABLE TO SHOW 200% VOLUME SINCE LAST DATASince the data shows there is volume from China coins, CFX can be the next one that can show a break increase in the coming time.
There is unexpected China volume on some China-connected coins. This can be a new adding for bullrun.
AND CFX is a coin that shows with high chance that China's volume effect can target.
Manage the risk well, this is not trading advice.
CFX VOLUME INCREASECFX seems to have a building increase in volume since 19-1-2023
We are checking if this coin can soon target higher targets.

CFXUSD: Channel Down bullish breakout. Immediate target 0.1900.Conflux crossed today over the top of the April Channel Down, as well as the 1D MA50. The 1D technical outlook has turned overbought instantly (RSI = 71.137, MACD = -0.001, ADX = 36.832) but that might not weigh against a continuation of the uptrend as the 1D MACD just formed a Bullish Cross. The intra day pullback is a buy opportunity, aimed at the R1 level and the 1D MA200 (TP = 0.19000).
## If you like our free content follow our profile to get more daily ideas. ##
## Comments and likes are greatly appreciated. ##

Uptrend reversal point: above 0.1350Hello?
Hello traders!
If you "Follow" us, you can always get new information quickly.
Please also click “Boost”.
Have a good day.
-------------------------------------
(CFXUSDT chart)
The key is whether the price can be maintained by rising to the 0.1953-0.294 range.
(1W chart)
Accordingly, it is necessary to check whether support can be received by rising above 0.1350.
(1D chart)
If the price rises above 0.333 and holds, it is expected to create a new wave.
The key is whether it can receive support around 0.1212-0.1282 and rise to around 0.1640-0.1882.
Otherwise, if it shows resistance below 0.1212, it may fall to around 0.0792, so you need to think about a response plan.
-------------------------------------------------- -------------------------------------------
** All explanations are for reference only and do not guarantee profit or loss in investment.
** Trading volume is displayed as a candle body based on 10EMA.
How to display (in order from darkest to darkest)
More than 3 times the trading volume of 10EMA > 2.5 times > 2.0 times > 1.25 times > Trading volume below 10EMA
** Even if you know other people’s know-how, it takes a considerable amount of time to make it your own.
** This chart was created using my know-how.
---------------------------------

CFXUSD ❕ tests the resistance50EMA broke up through 200EMA (30m TF)
RSI is in the buying zone.
I believe that the asset will continue to rise.

CFXUSD Inside the Channel Down, not bullish yet.Conflux (CFXUSD) has been trading within a Channel Down pattern since the March 19 High. The 1D MA50 (blue trend-line) has priced all Lower Highs since May 23 but it is the 1D MA100 (green trend-line) that has been untouched since June 01.
The 1D RSI is on Higher Lows against the Lower Lows of the price, waving a big Bullish Divergence. The last time we saw a similar Channel Down structure was last year in Q3 - Q4. The pattern eventually broke upwards on a parabolic rise after the price broke above the 1D MA100. Before that, the earliest signal was when the 1D RSI broke above its onw Lower Highs trend-line.
As a result, we will wait for the RSI to make the first move and buy when the 1D MA100 breaks. All Fibonacci levels that follow will be targeted one by one.
-------------------------------------------------------------------------------
** Please LIKE 👍, FOLLOW ✅, SHARE 🙌 and COMMENT ✍ if you enjoy this idea! Also share your ideas and charts in the comments section below! **
-------------------------------------------------------------------------------
💸💸💸💸💸💸
👇 👇 👇 👇 👇 👇

Our attempt to identify the next "pump coin". CFX long trade #10While the previous few days, the most voluminous and liquidity cryptocurrencies have been falling in value stood still or grew slightly, they moved in the 1-2% range., some coins have been pumping like as: FLM, GTC, PERP, UNFI, Cyber, TRB etc...
This trade is our attempt to determine which coin will be the next to "pumping". That is why we halve our standard entry amount to $5000 and emphasize that a stop order is required.
Enter = 0,1281
Stop = 0,1243 ( -3%)
TP1 = 0,1960 ( +53%)
TP2 = 0,2780 ( +117%)
P/L ratio = 39.5
According to these conditions, with a position size of $5000, the amount of potential loss is $150, and the potential profit is TP1 = $2650 or TP2 = $5850
Depending on the dynamics of price growth, we will decide where to record profits in real-time.
Therefore, if you are interested in watching for this trade, write a comment, put a like, and you will receive a notification when we update the idea.

Cfx analysis #Cfx is in descending parallel channel. Dump expected by following blue arrow.
If any 4hrs candle closed above 0.1280 then it will pump.
This is not a signal. It's just analysis.
For signals, contact for VIP

CFX is ready to do some movements!Hello Traders,
It's time to see some fireworks on altcoins soon. CFX is one of them, and it's ready to blast off after 4 months of correction.
Please hit the boost button and follow me for more ideas.
Thanks

CFX target 0.434h time frame
-
CFX getting rid of this falling wedge
But hasn't showed any momentum yet.
Here is also the Fib level 0.382 which allow us to set a good trading plan.
TP: 0.43~0.45 / 0.51~0.54
SL: 0.1277

Asia's Bullish Crypto! Japan(ASTR) + S Korea(KLAY) +China(CFX)While the west is confused the East is on the move.
Keeping an eye on those blockchains that have beaten out Eth and BNB as the defacto Layer1 platforms. Positioning now for the hype.
Japan - Astar ASTR = Huge partnerships (Sony, Toyota, and many more) and strong gov support (Web3 gov initiative)
S Korea - Klaytn KLAY = Founded by the largest consumer tech conglomerate in S Korea. (Kakao). Korea loves crypto (BTC on Bithumb routinely trades 30% premium)
China - Conflux CFX = state approved and adopted by Chinese instagram (RedBook). . .China's back. Enough said.

CFXUSD ❕ downtrend channelCFX has dropped below the 50EMA on the 4H TF.
Relative strength index indicates sellers' strength.
I expect price to continue to decline.

CFXUSD Double bottomed and is looking for +45% rally.Conflux (CFXUSD) made a low two days ago on the 0.1725 Support and along with the June 15 Low, makes so far a Double Bottom formation. It is no surprise then to see the price on a strong 1D candle today, headed towards the 1D MA200 (orange trend-line) and the 1D MA50 (blue trend-line).
The pattern since the March 19 High is a Channel Down, so if the Double Bottom breaks, we will sell and target a new Lower Low at 0.1000.
Until it does though, the Double Bottom is a formation capable of breaking above the Channel Down, so we will take a long on the current price and target the 0.382 Fibonacci retracement level from the top (0.29000) which is the bottom of the High Volatility Zone (and now Resistance Zone) of the 0.5 - 0.382 Fib range. That move represents a +45% rise from the current value.
Beyond that, we will buy only if the price breaks above the 0.618 Fib and target the March 19 High at 0.488000.
Notice the 1D RSI, which is completing an Inverse Head and Shoulders pattern, a typical bullish reversal formation.
-------------------------------------------------------------------------------
** Please LIKE 👍, FOLLOW ✅, SHARE 🙌 and COMMENT ✍ if you enjoy this idea! Also share your ideas and charts in the comments section below! **
-------------------------------------------------------------------------------
💸💸💸💸💸💸
👇 👇 👇 👇 👇 👇

CFX aim at 0.566~0.594h time frame
-
CFX creating a great wedge.
Here is a nice entry with low potential loss.
Target: 0.566~0.59
SL: breaking below wedge

CFXUSDTJust like the previous chart I mentioned for cfx, it lost its support and went out of the trend line. Now we are witnessing rebalancing and returning to the trend line. I think we will see a downward trend in the long term.
⚠️ "Daily crypto market analyses I provide are personal opinions & not financial advice. Trading carries risks, so do your own research & seek advisor's help."

CFXUSD: Inverted Head and Shoulders Trading Above Old ResistanceCFX seems to be showing some bullish price action above the old resistance of $0.2488 all while forming an Inverted Head and Shoulders, confirming Hidden Bullish Divergence and holding above the moving averages on significant timeframes. The Bullish targets would probably be $0.60 then $1.64

CFXUSD The 1D MA50 distinguishes buying from selling.Conflux (CFXUSD) is testing the 1D MA50 (blue trend-line) today near the top of its March Channel Down. With the 1D MACD on a Bullish Cross and the 1D RSI rebounded from the (nearly) oversol 30.00 territory, a 1D candle closing above the 1D MA50, will be a bullish break-out signal first towards Resistance 1 and then the -0.5 Fibonacci extension at 0.93000.
Until the 1D MA50 break-out, it is more likely that the Channel Down continues to drop steadily and if the price closes below it, sell more aggressively towards the 1D MA200 (orange trend-line) and 0.17000.
-------------------------------------------------------------------------------
** Please LIKE 👍, FOLLOW ✅, SHARE 🙌 and COMMENT ✍ if you enjoy this idea! Also share your ideas and charts in the comments section below! **
-------------------------------------------------------------------------------
💸💸💸💸💸💸
👇 👇 👇 👇 👇 👇
