Uptrend reversal point: above 0.1350Hello?
Hello traders!
If you "Follow" us, you can always get new information quickly.
Please also click “Boost”.
Have a good day.
-------------------------------------
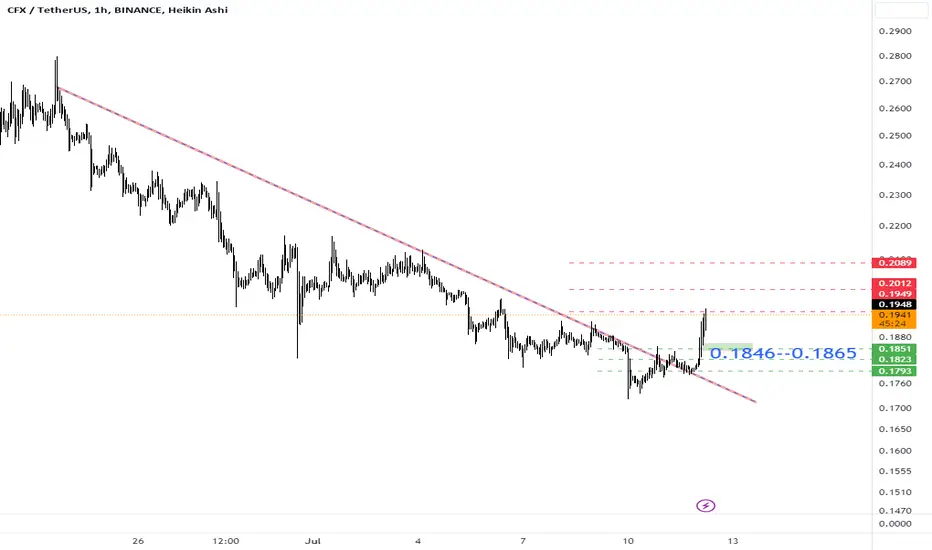
(CFXUSDT chart)
The key is whether the price can be maintained by rising to the 0.1953-0.294 range.
(1W chart)
Accordingly, it is necessary to check whether support can be received by rising above 0.1350.
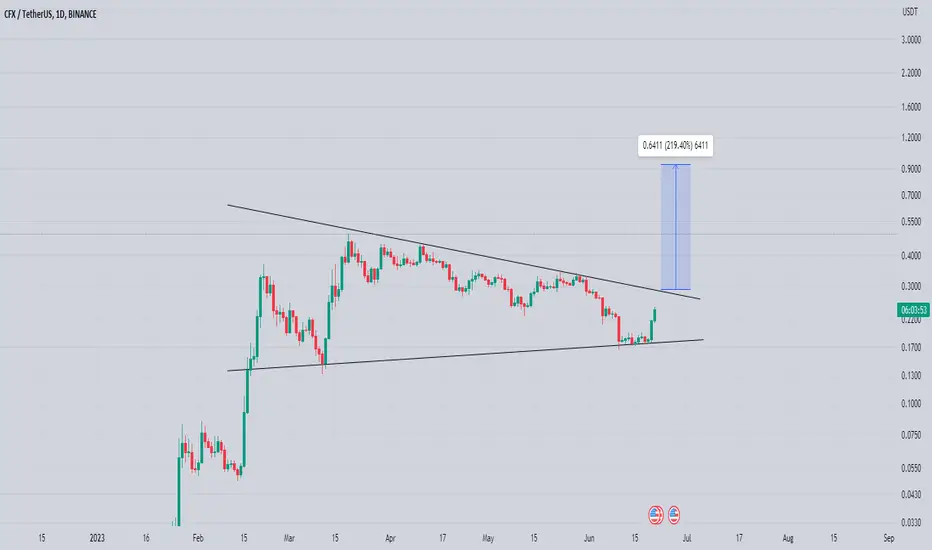
(1D chart)
If the price rises above 0.333 and holds, it is expected to create a new wave.
The key is whether it can receive support around 0.1212-0.1282 and rise to around 0.1640-0.1882.
Otherwise, if it shows resistance below 0.1212, it may fall to around 0.0792, so you need to think about a response plan.
-------------------------------------------------- -------------------------------------------
** All explanations are for reference only and do not guarantee profit or loss in investment.
** Trading volume is displayed as a candle body based on 10EMA.
How to display (in order from darkest to darkest)
More than 3 times the trading volume of 10EMA > 2.5 times > 2.0 times > 1.25 times > Trading volume below 10EMA
** Even if you know other people’s know-how, it takes a considerable amount of time to make it your own.
** This chart was created using my know-how.
---------------------------------
CFXUSDT

$CFX Performing descending broadening LSE:CFX Performing descending broadening wedge pattern
Descending Broadening Wedge Pattern Explained
A descending broadening wedge chart pattern is a bullish reversal pattern. This pattern is created by two declining and diverging trend lines .
A descending broadening wedge forms as price moves between the upper resistance and lower support trend lines multiple times as the trading range expands during the downtrend in price. Price should touch each line 2 or 3 times to be considered a valid pattern. This pattern looks like a megaphone pointing down and to the right.
A descending broadening wedge is looked at as a bullish pattern as it forms but it is not validated as a buy signal until the pattern starts to make short term higher lows and higher highs and the upper resistance trend line is broken and price begins to move to the upside and above the upper trend line. As the descending broadening wedge pattern is forming trading volumes become most meaningful as the pattern breaks out above the upper trend line, this should happen on increasing volume showing that the chart is starting to go into an accumulation cycle.

Our attempt to identify the next "pump coin". CFX long trade #10While the previous few days, the most voluminous and liquidity cryptocurrencies have been falling in value stood still or grew slightly, they moved in the 1-2% range., some coins have been pumping like as: FLM, GTC, PERP, UNFI, Cyber, TRB etc...
This trade is our attempt to determine which coin will be the next to "pumping". That is why we halve our standard entry amount to $5000 and emphasize that a stop order is required.
Enter = 0,1281
Stop = 0,1243 ( -3%)
TP1 = 0,1960 ( +53%)
TP2 = 0,2780 ( +117%)
P/L ratio = 39.5
According to these conditions, with a position size of $5000, the amount of potential loss is $150, and the potential profit is TP1 = $2650 or TP2 = $5850
Depending on the dynamics of price growth, we will decide where to record profits in real-time.
Therefore, if you are interested in watching for this trade, write a comment, put a like, and you will receive a notification when we update the idea.

#CFXCurrently its 50/50
Either the coin bounces and breaks above 0.132$ and in this case it goes higher till 0.15 and rejects or 0.17 and rejects (n.1)
Or the coin breaks below 0.11$ in this situation, we can expect the coin lower to 0.099$ or 0.07$

CFX - 🚩 Flying High: Unveiling the Bullish Flag Formation 📈🚀On the weekly chart, CFX displays a promising bull flag formation. In the long term, it resembles a head and shoulders pattern around 0.09, with a favorable risk-reward profile. There are two resistance ladders on KDJ and Fisher indicators that need to be surpassed. The projected path is shown in black. The bull flag setup remains intact, even potentially retracing to the 0.07c area.
PS Notice the green highlights on indicators.

CFXUSDTCFXUSDT, after recent massive selloff, CFXUSDT was trading in range and now has strong breakout from range.
If this breakout holds and bulls stay in the market the next target could be 0.1560.
What you guys think of it ?

Cfx analysis #Cfx is in descending parallel channel. Dump expected by following blue arrow.
If any 4hrs candle closed above 0.1280 then it will pump.
This is not a signal. It's just analysis.
For signals, contact for VIP

CFX: Break(fake)out zone?Friends, I've been asked to give a comment on the BINANCE:CFXUSDT chart, so here is my take on it.
I've made both:
Wave analysis, that shows we're actually near entering into the last zone of purchases for the long term
And analysed this descending wedge with the possible breakout (You can totally see most of coins are in the same position).
I suggest you to look closely, if we will break it out, we will make the last wave with the upmove within the descending area, then - provide the last correction to the bottom zone, which, by that time, will connect with the old trendline resistance and the new support, and from there we will enter the long and boring accumulation zone.
Few words.
Nowadays most of the Alts' charts feel pretty much the same. Descending Wedges/triangles are everywhere. And this is the good time to trade those breakouts/fakeouts.
Cause after that, the real boring market will come into place. And it may take another year to reaccumulate everything and to shakeout The Last Samurais.
The bottom zone is near, however we're still not there.
👁️ A.I.Vision

CFXUSDT ANALYSIS The price is respecting the upsloping support however it remains below the resistance.
If the price breaks the support you can enter short position however if the price breaks above the resistance, it might be the long opportunity.
Targets are shown on the chart.
Enter the trade only if/when break out occurs.

CFX/USDT Analysis on Daily TimeframeCFX/USDT Analysis on Daily Timeframe:
The price is currently attempting to break down from this pattern. If the breakdown happens, we might witness a drop in CFX price by at least 30-50%. I anticipate the price to break down soon, but we'll have to wait and see.
Please remember: this is just an idea. Before making any decisions, it's important to conduct your own research.
Best of luck in your trading endeavors!
If you find our analysis helpful, please consider supporting us.
Happy trading!

CFXUSDT Analysis For Long Position!Did Analysis on 1D and 4H TF!
If CFXUSDT Breaks 0.1941 and closes above this then it will reach TP1 and TP2
Wait for the Breakout and i have clearly mentioned the Take profit 1 and TP2!
Breakout and Retest will be a strong Signal!
Do watch for volume and i don't believe in indicators only price action & volume is the key!
CFXUSDT Analysis on 1D and 4H time frame ⏰.
STOPLOSS IS MUST! and depends on your portfolio!
THIS IS NOT A FINANCIAL ADVICE. JUST SHARING MY IDEA WITH YOU GUYS.
DYOR!
Trade safe. :)

CFX is ready to do some movements!Hello Traders,
It's time to see some fireworks on altcoins soon. CFX is one of them, and it's ready to blast off after 4 months of correction.
Please hit the boost button and follow me for more ideas.
Thanks

CFX target 0.434h time frame
-
CFX getting rid of this falling wedge
But hasn't showed any momentum yet.
Here is also the Fib level 0.382 which allow us to set a good trading plan.
TP: 0.43~0.45 / 0.51~0.54
SL: 0.1277

Asia's Bullish Crypto! Japan(ASTR) + S Korea(KLAY) +China(CFX)While the west is confused the East is on the move.
Keeping an eye on those blockchains that have beaten out Eth and BNB as the defacto Layer1 platforms. Positioning now for the hype.
Japan - Astar ASTR = Huge partnerships (Sony, Toyota, and many more) and strong gov support (Web3 gov initiative)
S Korea - Klaytn KLAY = Founded by the largest consumer tech conglomerate in S Korea. (Kakao). Korea loves crypto (BTC on Bithumb routinely trades 30% premium)
China - Conflux CFX = state approved and adopted by Chinese instagram (RedBook). . .China's back. Enough said.

Combo correction wave WXY | $0.13Daily chart
BINANCE:CFXUSDT has soared and completed impulse wave at 0.4876 and it's trading around 0.1904 now.
CFX is in the combo correction wave, I think so. On the chart, it shows a first leg (wave A) completed at 0.1665 and happening wave B then wave C
I expect wave C will down around 0.135 - 0.125
Wait and see next move

CFXUSDTFive upward waves were made, and a complex overlapping correction occurred for them. It is possible that we will see another five quick and short rising waves to end the large corrective rise of the currency.
Note: the analysis fails if the price closes below an area 0.17 usdt

CFXUSDT BULLFLAG BREAKOUTHello Tradingview friends! Make sure to LIKE and FOLLOW for more chart ideas! Today i am
bringing you my view on CFXUSDT and the bull flag i believe CFXUSDT has formed and is
showing signs of strength and a potential breakout!
What does bull flag mean?
A bull flag is a bullish chart pattern formed by two rallies separated by a brief consolidating
retracement period. The flagpole forms on an almost vertical price spike as sellers get
blindsided from the buyers, then a pullback that has parallel upper and lower trendlines, which
form the flag.
Thanks. Liquidmex

cfxAfter breaking its resistance line, it entered an upswing, and now it is in a resistance range, in case of correction, the green box and green lines can provide support.
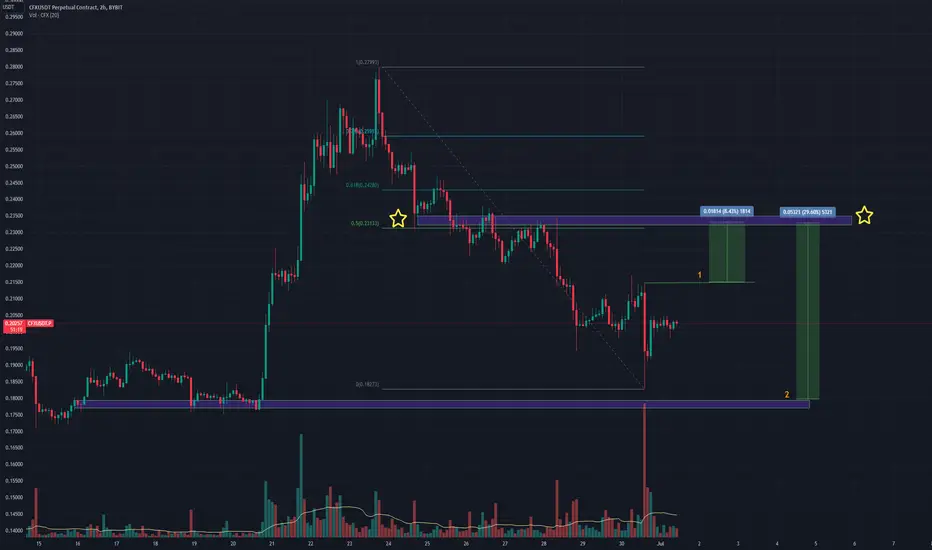
Probable long analysis and signal for CFX cryptoProbable long analysis and signal for CFX crypto
In the two-hour time frame, at the bottom of the chart, you can see a good over-block area.
When the price reaches that area, we can enter a long position with great risk and reward.
Of course, you can enter a long position from the current price.
If you place a fibo on the downswing, you will see that the 50 fibo area is itself a heavy supply area, so you can set the target in the same area that I marked with a gold star.
Your possible profit by entering from the first zone is about 9% without leverage
Your possible profit by entering from the second zone is about 30% without leverage
Good pattern based crypto! From examining the previous price action of CFX, it can be well understood that this crypto is pattern-oriented and tends to act like it did in the past. Therefore, it is expected to soar from this area to 0.45 based on the chart. Stop loss can be set at 0.1345.

🚀 Explosive Crypto Alert! CFXUSDT Set to Skyrocket! 💎 Breakout Alert: Paradisers, CFXUSDT is teetering on the brink of a significant trendline breakout, indicating a potential momentum shift. Keep your eyes peeled for any drastic price action as a breakout could be just around the corner.
💎 Steady Price Action: If CFXUSDT manages to shatter the trendline and maintain its upward trajectory, it would validate the robustness of the potential bullish move. Keep a close watch on the price action for confirmation.
💎 Rising Volumes: Trading volumes for CFXUSDT are climbing, signaling heightened interest and engagement from market participants. Increased volumes often accompany bullish movements, offering additional support for an upward trend.
💎 Accumulation Phase: Before a potential breakout, CFXUSDT has been in an accumulation phase, where buyers have been soaking up selling pressure. This phase suggests a sentiment shift in the market, favoring the bulls.
💎 The Bottom Line: CFXUSDT is flashing promising signs of a bullish breakout. With a looming trendline breakout, steady price action, surging volumes, and the accumulation phase, the stage is set for a potential upward move. Stay alert and be ready to capitalize on the opportunity for significant gains!
Remember, Paradisers, conducting thorough research and exercising caution is crucial when making investment decisions. Happy trading!

cfx getting ready for another massive bullish rally Seems Like Getting ready for Another Massive bullish Rally
Forming Bullish Pennant In Daily Timeframe Incase Of breakout Expecting Another 180 - 200% Bullish Wave
Cfx Update Cfxusdt
Retested the daily support I am expecting a bullish move from this support
Persnol opinion not financial advice , Do your own research
