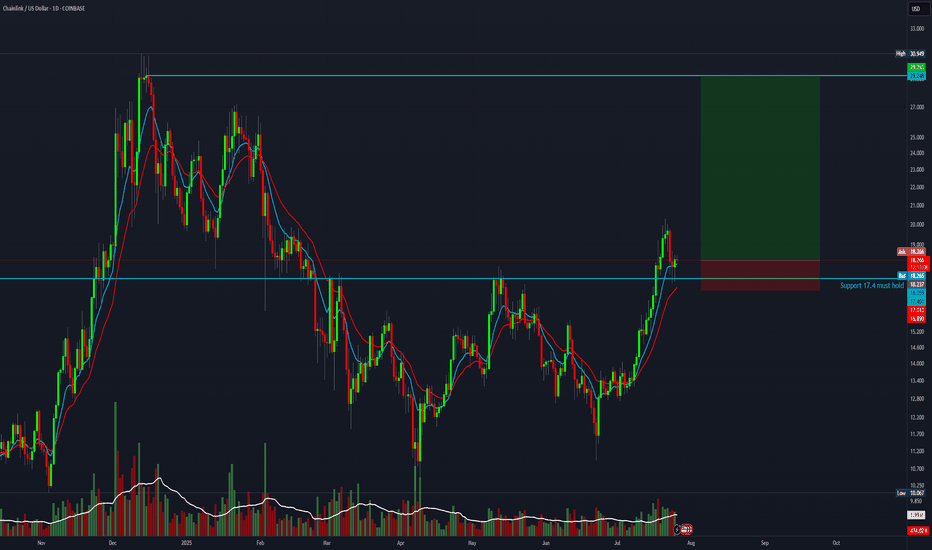
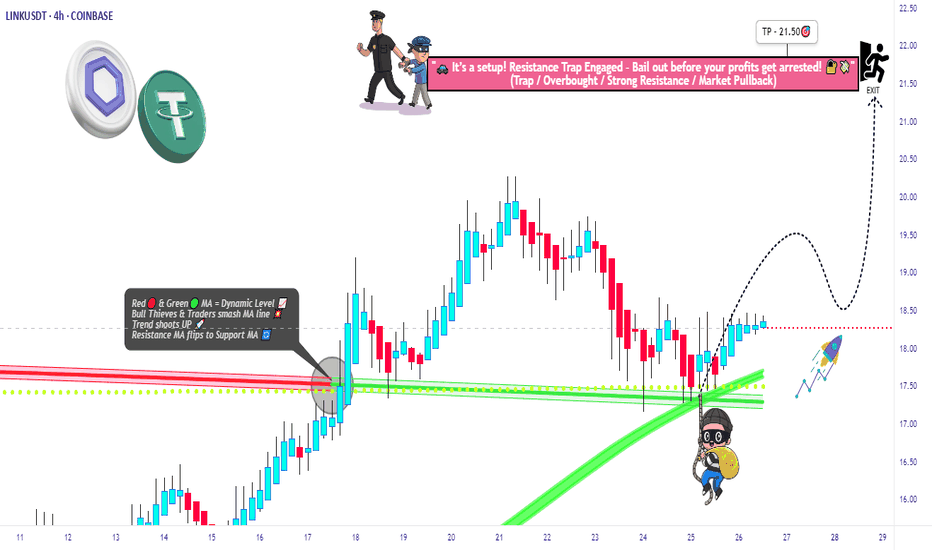
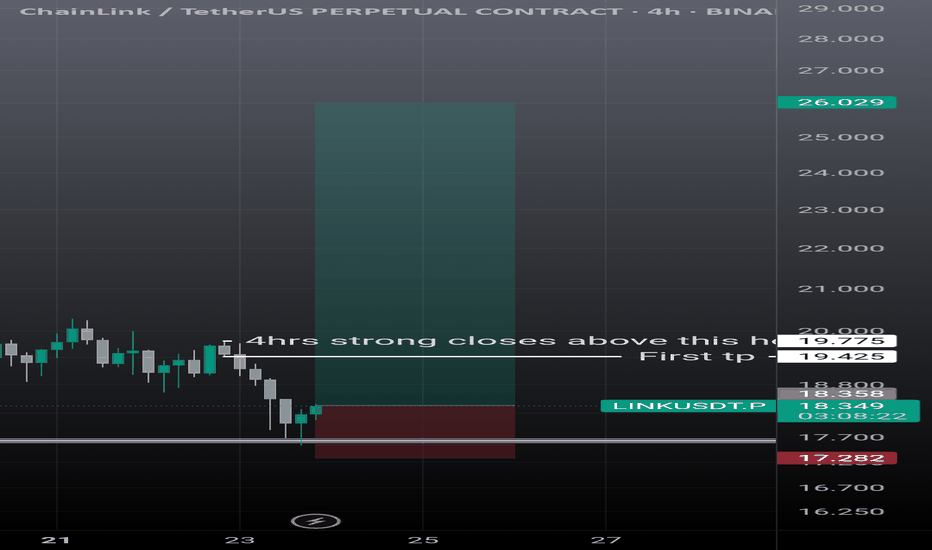
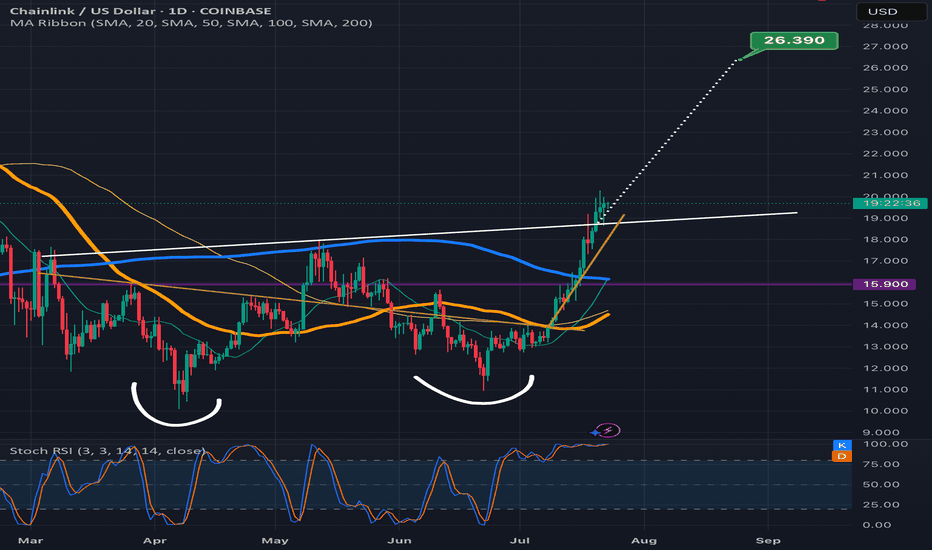
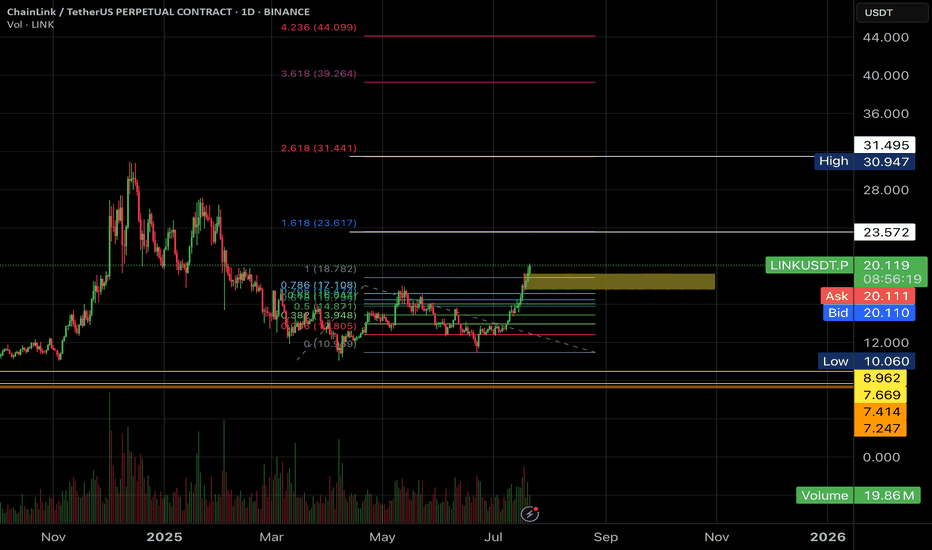
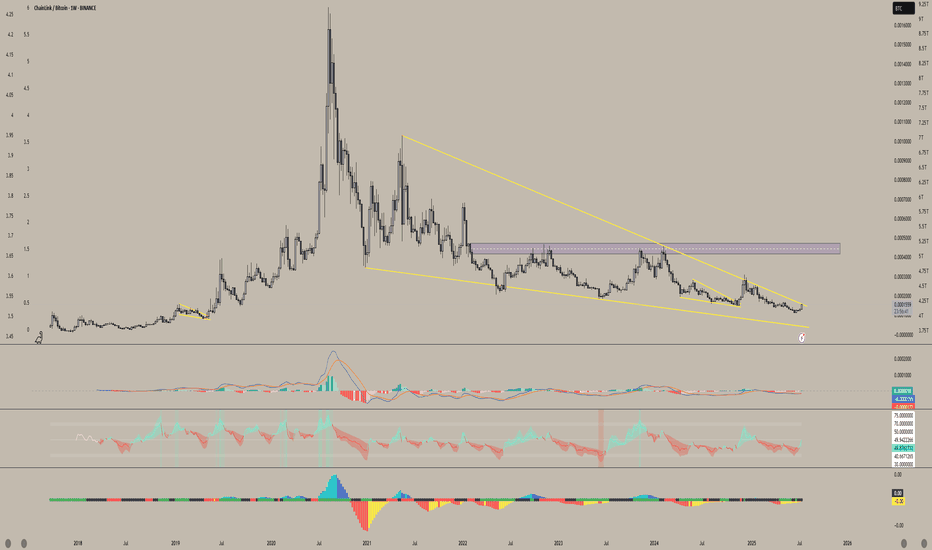
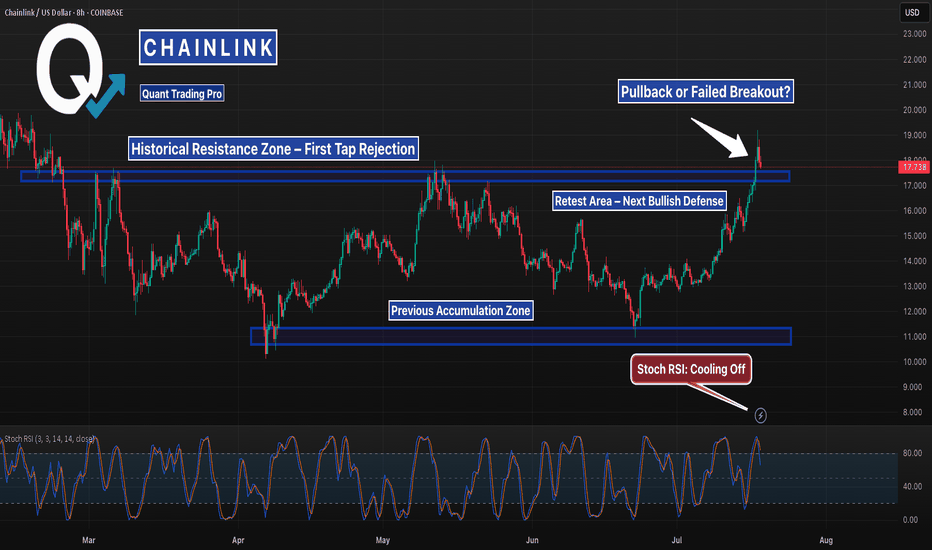
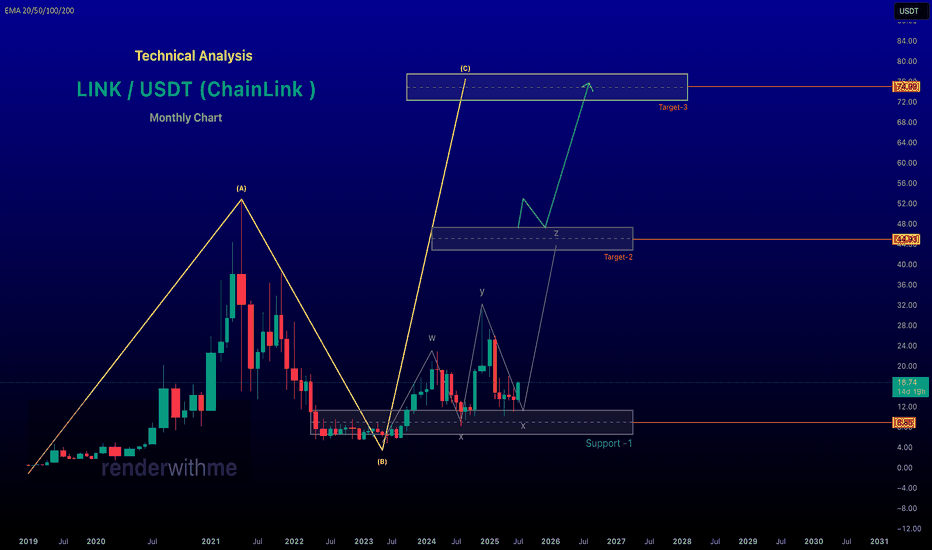
CHAINLINK 200 DOLLARS BY SEPTEMBER 2025 Only up for Chainlink from this moment , do not let them shake you out , my time fib will show the way as always , for Link its showing August which is when the fractal finishes , late August .
Chainlink so far is repeating the same fractal as last cycle , its very close been using it for over one year to time the market with amazing results the fractal cycle top pattern comes in in August 2025.
The sell zone is in the yellow box , invalidation of this idea would be LINK closing a weekly under 20 dollars.
Chainlink
LINK/USDT 1H: Oversold & Accumulating – Ready for a Reversal?LINK/USDT 1H Chart Analysis
🚀 Follow me on TradingView if you respect our charts! 📈
Current Market Structure:
Bearish momentum continues after a recent breakdown.
RSI at 28.70, showing oversold conditions.
Hidden Bullish Divergence forming between RSI and price action.
Smart Money Activity:
Market Makers engineered a liquidity sweep below $20.50.
Accumulation likely occurring at the discount zone.
Premium zone identified between $25.50-$26.00.
Key Levels:
Entry Zone: $20.50 - $20.80 (discount zone).
Targets:
T1: $22.30 (FVG fill).
T2: $23.50 (Equilibrium zone).
Stop Loss: Below $19.80 (to protect downside risk).
Risk Score:
8/10 (High volatility – strong R:R setup).
Market Maker Intent:
Likely accumulating at current levels before the next leg up.
Liquidity grab appears complete, suggesting a potential reversal.
No short entries recommended due to oversold conditions.
Recommendation:
Long positions are favorable within the $20.50 - $20.80 range.
Wait for reversal confirmation before entering.
Monitor volume and price action near $22.30 resistance for breakout strength.
Confidence Level:
7/10 for potential bullish reversal.
🚀 Follow me on TradingView if you respect our charts! 📈
Chainlink BullRipple stablecoin $RLUSD has adopted the Chainlink standard for verifiable data to fuel DeFi adoption with real-time, secure pricing data
The launch of the Chainlink Cross-Chain Interoperability Protocol (CCIP) has been pivotal, enabling seamless cross-chain token transfers and enhancing smart contract capabilities.
Plus the chart looks very bullish.
Chainlink Could Target $30 Once It Breaks Descending Triangle
Chainlink (LINK), the leading decentralized oracle network, has been consolidating within a descending triangle pattern on its price chart. This technical formation often signals a period of indecision among market participants, but it also carries the potential for a significant breakout. If LINK successfully breaks above the descending trendline, it could ignite a powerful rally, potentially propelling the price towards the $30 mark.
Understanding the Descending Triangle
A descending triangle is a bearish chart pattern characterized by a series of lower highs and relatively flat lows. It suggests that selling pressure is gradually increasing, while buying pressure remains relatively weak. However, the flat lows indicate that there is still significant support for the asset.
In the case of Chainlink, the price has been consolidating within this descending triangle for several weeks. This period of consolidation allows market participants to accumulate positions and prepare for a potential breakout.
Factors Fueling a Potential Rally
Several factors could contribute to a bullish breakout and propel Chainlink's price towards $30:
• Growing Adoption: Chainlink's technology continues to gain traction across various sectors, including DeFi, gaming, and enterprise applications. As more projects integrate Chainlink's oracles, the demand for LINK tokens is likely to increase.
• Technological Advancements: Chainlink is constantly evolving and improving its technology, enhancing its security, scalability, and interoperability. These advancements can attract new users and drive further adoption.
• Favorable Market Conditions: A broader bullish trend in the cryptocurrency market could provide a significant tailwind for Chainlink. If Bitcoin and other major cryptocurrencies experience a sustained rally, Chainlink could benefit from increased investor interest and capital inflows.
• Technical Breakout: A successful breakout above the descending trendline would be a strong technical signal, confirming the bullish sentiment and attracting more buyers to the market.
Technical Analysis
Technical analysis provides several clues about the potential for a bullish breakout.
• Volume: A surge in trading volume accompanying a breakout would significantly increase the likelihood of a sustained rally.
• Moving Averages: A move above key moving averages, such as the 50-day and 200-day moving averages, would further strengthen the bullish case.
• Relative Strength Index (RSI): The RSI is a momentum indicator that can help identify overbought or oversold conditions. A breakout accompanied by a rising RSI would suggest strong bullish momentum.
Potential Challenges and Risks
While the outlook for Chainlink appears promising, it is crucial to acknowledge potential challenges and risks:
• Competition: Chainlink faces competition from other decentralized oracle networks and emerging technologies.
• Regulatory Uncertainty: The regulatory landscape for cryptocurrencies remains uncertain, and any negative regulatory developments could impact Chainlink's price.
• Market Volatility: The cryptocurrency market is highly volatile, and sudden price swings can significantly impact Chainlink's price.
Investment Considerations
Investing in cryptocurrencies carries significant risks, including the risk of losing all or part of your investment.
• Conduct thorough research: Understand the technology behind Chainlink, its potential use cases, and the risks involved.
• Diversify your portfolio: Don't invest all your funds in a single cryptocurrency.
• Invest only what you can afford to lose: Avoid investing more than you can afford to lose financially.
• Stay informed: Keep abreast of the latest developments in the Chainlink ecosystem and the cryptocurrency market as a whole.
Conclusion
Chainlink has the potential to play a crucial role in the future of decentralized finance and blockchain technology.
• If it successfully breaks out of the descending triangle pattern and gains traction in the broader market, it could experience significant price appreciation.
• However, investors should carefully consider the risks involved and conduct thorough research before making any investment decisions.
Disclaimer: This article is for informational purposes only and does not1 constitute financial advice.
• Investing in cryptocurrencies2 involves significant risks, and you should carefully consider your investment objectives, financial situation, and risk tolerance before making any investment decisions.
Note: This article provides a general overview of Chainlink and its potential.
• The cryptocurrency market is dynamic and subject to rapid change.
• It is essential to conduct independent research and consult with a qualified financial advisor before making any investment decisions.
Disclaimer: This article is for informational purposes4 only and does not constitute financial advice.
• Investing in cryptocurrencies5 involves significant risks, and you should carefully consider your investment objectives, financial situation, and risk tolerance before making any investment decisions.6
LINK/USDT Analysis – Breakout or Rejection?CRYPTOCAP:LINK is approaching a key descending resistance zone, while the rising trendline continues to provide strong dynamic support (marked with golden boxes).
The price is currently at a decision point—either a breakout or a rejection from resistance.
Please tap the like button to show your support.
Thank you!
LongI usually trade with two time frames. I tend to avoid to buy the dip. I rather buy the strength using momentum indicators:
I just opened a long position using three time frames based on the reasons below:
Weekly:
The stochastic reset at 50 level and is moving to the upside - Bullish momentum building up.
Daily:
Both MACD and RSI lines are about to cross and move to the upside in the bull zone. Stochastic lines have already crossed and are moving to the upside. In terms of price action, it dropped to the previous month low, bounced up and now moving above the previous month mid level.
4H:
The price is currently sitting just below the sell block and below the previous week mid level. I will open a long position if the current 4H candle closes above the previous month's mid level and MACD lines enter the bull zone with green histogram. Having said that, It might be safer to wait for a candle to close above $26 and stochastic lines will enter 50 level.
I don't trade with leverage. I usually close the position when momentum indicators present a clear negative divergence in 4H or daily chart.
7% PUMP OR DUMP INCOMING FOR CHAINLINKCurrently trading at resistance. we need to flip this $24.75 level into support to then aim for a 7% pump to the upside.
If we reject here, I would expect a 7% dump to the value area low.
#Chainlink #Crypto #Oracle
Calculate Your Risk/Reward so you don't lose more than 1% of your account per trade.
Every day the charts provide new information. You have to adjust or get REKT.
Love it or hate it, hit that thumbs up and share your thoughts below!
This is not financial advice. This is for educational purposes only.
TradeCityPro | LINKUSDT The Time to Buy Has Arrived👋 Welcome to TradeCityPro Channel!
Let’s analyze another cryptocurrency from the market, which is also one of my favorites due to its infrastructure role and its ability to simplify crypto. It seems that a buying opportunity has arrived.
🌐 Overview Bitcoin
Before starting the analysis, as always, let’s take a look at Bitcoin on the 1-hour timeframe, where the futures entry trigger at 104,227 was activated. Currently, it is below the important resistance level of 105,939, which will be the last trigger I provide for futures entry.
If this resistance at 105,939 is broken and Bitcoin dominance is declining at the time of the breakout, switch to altcoins and look for long positions on those that have already made a bullish leg and are trading at relatively higher levels. As long as we are above 104,227, I will continue looking for long triggers.
📊 Weekly Timeframe
On the weekly timeframe, LINK has been one of the cryptocurrencies that remained in a range for 500 days. After breaking out, we have seen the beginning of an uptrend.
This is exactly what I mean by avoiding capital lock-up. We waited weeks for the 8.06 trigger to break, allowing us to buy with momentum confirmation rather than buying inside the range and waiting in a high-risk market.
You might say, "Why not buy inside the range to avoid missing the 8.06 breakout?" My answer is that hundreds of coins are still stuck in similar ranges without showing any bullish moves, and even now, they could trap your capital for a long time, causing frustration!
If you entered at 8.06, continue holding. If you are looking for a re-entry, you can buy after the 29.02 breakout. As for selling, I am not selling yet and will actually try to accumulate more!
📈 Daily Timeframe
On the daily timeframe, LINK is one of the few cryptocurrencies that, after recent corrections, did not return to lower levels. Instead, it bounced off the 0.382 Fibonacci level, increasing the bullish bias.
After breaking 12.96, LINK had a strong rally up to 29.07, where resistance was observed.
Instead of considering 29.07 as resistance, I prefer to buy after a breakout of 26, as this level was previously a pullback zone and had multiple rejections.
Since we have bounced off the 0.382 Fibonacci level, a breakout of the recent high could trigger a new upward move towards the Fibonacci extension targets, which are : 31.24 – 35.10 – 41.44 – 51.19
For buying, I plan to enter a spot position after a 26 breakout with a stop-loss at 15.22, and I will continue holding. I will also look for a futures long position before 26, but for that, I will need momentum confirmation and volume increase!
⏱ 4-Hour Timeframe
On the 4-hour timeframe, a risky long trigger at 24.34 was activated, but there hasn't been much movement yet. A pullback to 24.34 is possible.
📈 Long Position Trigger
the 26.30 trigger is excellent, and I will try to find lower timeframe entries before that. As long as we are above 22.37, my bullish strategy remains intact.
📉 Short Position Trigger
I am not considering any setups unless a clear structure forms. If we see a sharp drop to 22.37 and then break below it, I might consider shorting, but I prefer to focus on more bearish coins instead of LINK.
📝 Final Thoughts
Stay calm, trade wisely, and let's capture the market's best opportunities!
This analysis reflects our opinions and is not financial advice.
Share your thoughts in the comments, and don’t forget to share this analysis with your friends! ❤️
LINKUSD: One more drop is possible on this Channel Down.Chainlink is neutral on its 1D technical outlook (RSI = 47.590, MACD = 0.090, ADX = 17.477), trading around its 1D MA50 but on a technical bearish wave of the December Channel Down. This pattern draws many comparisons with the one in June-July 2024, having so far identical RSI fractals. This suggests that the current rejection can test the 1D MA200 at the bottom of the Channel Down. Our target is a bit higher though (TP = 18.000) due to the presence of the S1 level.
## If you like our free content follow our profile to get more daily ideas. ##
## Comments and likes are greatly appreciated. ##
Will LINK Hold or Dive Deeper? Major Support Ahead!LINK has been range-bound for the past two weeks, struggling to break through the $26-$27 Key Zone. After multiple strong rejections, price started slowly to pull back, now approaching a critical support zone, the 0.618 Fibonacci retracement at $21.41.
Key Levels & Recent Price Action:
0.618 Fib Retracement ($21.41)
Weekly Level ($20.96) & 0.666 Fib → Additional confluence reinforcing this support zone
Fib Speed Fan (0.8) → Aligns with this level, making it a high-probability bounce area
Short Trade Recap
Today, the weekly level was tested, leading to a rejection, offering a valid short setup.
For the short trade target the dOpen was hit perfectly, acting as a key intraday level.
Now, the big question:
Will LINK lose the dOpen and head lower to finally test the 0.618 retracement?
Or will buyers step in to defend this level?
Long Setup & Upside Potential:
Entry Zone: $21.41 - $20.96 (Golden Pocket)
Stop Loss: Below 0.786 Fib
Take Profit: $30 psychological level, $35 - 0.618 Fib
Why This Trade Setup is High-Probability:
Liquidity Sweep Potential → A dip into this range could liquidate long positions, creating a strong buying opportunity
Golden Pocket Confluence → 0.618 & 0.666 Fibs + Weekly Support = A strong demand zone
Final Thoughts:
If LINK breaks below the dOpen, the swing low and the 0.618 fib retracement becomes the key level to watch for a high-probability long entry.
If price reacts strongly to this support zone, a long trade could target $30+ in the coming future, offering an excellent risk-to-reward setup!
BULLISH ON $LINK as potential front runner for Alt of 2025?I know that’s a BIG STATEMENT but I do see merit here. ChainLink is a very powerful network with its capability’s.
Anyway the idea is simple the first circle's purple green yellow all smaller to larger are same as the right side but the last yellow circle you see only 1/6th so if the rim. All this is hard to make out when zoomed in on a long frame chart so it was easiest way and I added pitch fork to give the over-all tend-line with the fork set to the last trend change. For a more realistic outlook which is still FUCKING INSANE! “”IF IT CAME OR COMES TRUE!”” I will see when I look at this accounts ideas ain 1-10 years and to holy shit I actually owned that..!?? Haha
Alright THIS IS WHY I AM SO BULLISH ON BITCOIN I MEAN LINK! lol CRYPTOCAP:BTC WILL PULL CRYPTOCAP:LINK ID OWN BOTH JUST A IMO.
ALSO MOT FINACIAL ADVICE I AM NOT FINANCIAL ADVISOR OR STUDY FINANCE SO I ONLY TRADE WHAT I KNOW WHORKS AND SHARE WITH SOME PEOPLE BUT THIS WONT BE THE SAME ON ANOTHER TRADE AS IT ALWAYS CHANGES SO TRADE YOUR OWN STRATEGIES!
Below is the reason I own and will continue to HODL CRYPTOCAP:LINK #ChainLink
Chainlink ( CRYPTOCAP:LINK ) has as a decentralised oracle network that connects smart contracts with real-world data, APIs, and traditional banking systems. It’s absolutely next level and NEW businesses or entrepreneurs will want to build on or use the chain link blockchain to do business maybe just pay people or for BONUS salary or even a “second option” to “Superannuation” or CRYPTOCAP:BTC will do so for first time under Trump administration or a the least I have heard this from a random but human source.
Anyway so since blockchains cannot access external data on its own, Chainlink acts as a bridge, enabling smart contracts to execute based on real-world events, such as price feeds, weather data, or even sports scores.
For users being solo or business, Chainlink enhances most (if not all) blockchain applications by providing reliable and tamper-proof data, ensuring decentralised finance (DeFi) platforms, NFT projects, and other Smart Contract-Based services function accurately and securely. This reduces reliance with any centralised data providers, increasing transparency and trust amongst the entire user base and anyone who chooses to look on the chainlink block explorer.
For big company’s Chainlink offers a secure way to integrate blockchain technology without overhauling existing digital infrastructure. Businesses can leverage its oracles to automate processes, improve efficiency, and access new blockchain-based financial products. It enables smart contracts to be used in insurance, gaming, supply chain management, and more.
The benefits of Chainlink include its decentralized nature, security, and widespread adoption across major blockchain projects. However, drawbacks include potential scalability concerns, reliance on node operators for data accuracy, and competition from other oracle solutions. Despite these challenges, Chainlink remains the dominant oracle provider in the crypto space, powering many DeFi applications.
Now that there wasn’t me that’s a disc rip took of Link. This is why I BELIEVE it’s a contender FOR 2025 Altcoin of the year or at minimum top 5…! Heck it is just following CRYPTOCAP:BTC little bit of CRYPTOCAP:ETH moves it. Depends.. I just think the MARKET NOW is about to go KAPUT AND BE TRIAL FOR THSOE WHO ARE HOLDERS AND WHO ARENT. This is one of my final warnings.
It will happen the market is way over priced. It may SEEM not but it is and mathematically as well. So we need to be careful with “MEMES” always another threat which is so stupid people still fall for the Twitter or telegram or Instagram image of some random LOGO animal and name with a $ ticker so it seem “Legit” cut so many new people don’t know it’s easy to make a meme coin and has been for years now. It’s that no one knew or no one wanted to know and didn’t learn it and it wasn’t idealised by the ”masses” to look at. I mean even the church or the royal family’s ITS NEW for them and this is the whole thing with cryptocurrency even JUST CRYPTOCAP:BTC AND that’s why we say “JUST Bitcoin” because anything else HAS YET TO BE ADVERTISED largely on a world wide scale like bitcoin on the Bitcoin network. Notice the lower b and upper B single word bitcoin is reference to the coin I or you own. Or can mine then the Bitcoin network or even Bitcoin references the Bitcoin network.
Just for any future reference if it’s a book or something you will get it ;)
Chainlink (LINK): Re-Testing EMAs / Possible Sellers OvertakeChainlink has a change to move 17% in both ways where we have shown few zones to keep your attention at. But to be honest, the movement to the lower support zone seems more logical for now so let's see!
More in-depth info is in the video—enjoy!
Swallow Team
LINK Fractal | ALTS | Chainlink can EASILY +90%Chainlink is one of those alts that haven't yet made a new ATH with the rest of larger alt market group.
This means that the bullish cycle is taking a detour and it could be extended to another multi-month cycle, as I've previously stated in my BTC updates.
If LINK follows the previous pattern of a multi-month extended patter, we could see a fractal playout that takes us beyond the current ATH over the next few months.
_________________________
BINANCE:LINKUSDT
LINK is bullish now and many Traders don't see it !!!You might wonder why altcoins haven't experienced significant growth compared to Bitcoin. The answer lies in meme coins, as they have caused substantial harm to the market. How many cryptocurrencies do we really need? So, focus on the primary cryptocurrencies in this market. In my opinion, everything is beautiful for the first time, so only pay attention to Dogecoin among the meme coins.
Technically, the cup and handle pattern has broken, which indicates a price increase. The price can easily reach the target . If we measure the AB range, which is $17.5 , we can say that the price will easily grow $37 equal to CD.
Give me some energy !!
✨We spend hours finding potential opportunities and writing useful ideas, we would be happy if you support us.
Best regards CobraVanguard.💚
_ _ _ _ __ _ _ _ _ _ _ _ _ _ _ _ _ _ _ _ _ _ _ _ _ _ _ _ _ _ _ _
✅Thank you, and for more ideas, hit ❤️Like❤️ and 🌟Follow🌟!
⚠️Things can change...
The markets are always changing and even with all these signals, the market changes tend to be strong and fast!!
LINK take profit targets Chainlink take profit targets
Possible Targets and explanation idea
➡️Over 530 days in a range around 27 fib zone
➡️A lot of recommendation close short position signals by Trade ON indicator
➡️Based on my money power indicator we got 2 bullish RSI div on Weekly
➡️Last bullish MACD div on weekly
➡️Take profit some % zones marked red block around 0.5 and 0.618 lvl
Hope you enjoyed the content I created, You can support with your likes and comments this idea so more people can watch!
✅Disclaimer: Please be aware of the risks involved in trading. This idea was made for educational purposes only not for financial Investment Purposes.
---
• Look at my ideas about interesting altcoins in the related section down below ↓
• For more ideas please hit "Like" and "Follow"!
Why I Like Chainlink: A Technical Perspective with 40$ targetAs I’ve mentioned before, one of the reasons I favor BINANCE:LINKUSDT is its strong adherence to technical patterns. This characteristic makes it a reliable asset for chart-based trading strategies.
Let’s break down the past:
• Accumulation Phase: From May 2022 to October 2023, LINK underwent a long, one-and-a-half-year accumulation phase. This created a solid foundation for future price action.
• Breakout and Corrections: After the accumulation ended, LINK experienced an upward move, followed by a correction that perfectly tested the resistance of the previous accumulation zone.
• New local Highs: A subsequent rally took the price to around $30, followed by another correction. This time, the correction confirmed a previously broken resistance level as new support, which acted as a springboard for another reversal upward.
The technical behavior of LINK stands out as methodical and predictable, with clear levels of support and resistance consistently respected.
Looking ahead, I anticipate that LINK will continue its upward trajectory, with a potential target of $40.
My strategy is buying dips.
However, a definitive break below recent support would force a reassessment of this outlook.
In conclusion, LINK’s well-structured price movements make it an excellent candidate for those who favor technical analysis in their trading approach.
LINK Bright Future. Price Perspective. Strong Fundamentals.I see the price of Chainlink (LINKUSDT) growing in the coming months, and I’ve got a few reasons for that.
Technical View: Cup & Handle Formation
From a technical perspective, I think LINK is in a long-term accumulation structure — a classic Cup & Handle pattern . Here’s what I’ve noticed:
The bottoms of both the Cup and the Handle show a clear Accumulation Range (AR) .
LINK has already broken out of the AR and the Cup & Handle resistance , which is a strong bullish signal.
If the price continues this momentum, it’s likely to reach its previous all-time high (ATH) at $52.00 .
Now, if LINK breaks above that ATH, something interesting might happen. There’s a pattern forming within the Handle — a downtrend curve that looks similar to the one seen in the pre-Cup phase. By using Fibonacci levels and comparing this to the Handle breakout structure, we can project a potential target that suggests significant upside.
Strong Fundamentals Backing LINK
LINK isn’t just about the charts — it’s got solid fundamentals too:
It’s the only token produced in the USA .
It’s included in the Coinbase 50 index .
It’s backed by a Grayscale Trust product .
And, it’s connected to World Liberty Financial (Trump ties).
These factors give LINK a strong foundation and make it one of the key projects to watch in the crypto space.
Alikze »» LINK| Bullish Wave 3 or C Scenario🔍 Technical analysis: Bullish Wave 3 or C Scenario - 1D
📣 BINANCE:LINKUSDT currency on the daily timeframe touched its targets in accordance with the analysis presented earlier, the scenario of the first of 3 bullish waves.
🟢 Chainlink touched its target after breaking out of the short-term descending channel.
🟢 It is currently in the supply zone on the daily and weekly timeframes.
💎Given the bullish momentum, this bullish leg, after breaking the supply zone, will have the ability to grow to the large supply zone of $60-$100.
💎In the first step after breaking the supply zone, the target will be $38 and $55.
»»»«««»»»«««»»»«««
Please support this idea 💡 with a LIKE 👍 and COMMENT 💬 if you find it useful and Click "Follow" on our profile if you'd like these trade ideas delivered straight to your email 📧 in the future.
Thanks for your continued support.🙏
Best Regards,❤️
Alikze.
»»»«««»»»«««»»»«««
LINK on the Verge Bullish Breakout Sparks Momentum !Pattern
The chart shows a descending wedge pattern. This is generally a bullish pattern, indicating potential price reversal or breakout to the upside.
Breakout
The price has broken above the upper trendline of the wedge. This breakout is a positive signal, suggesting that bullish momentum is building.
Volume Confirmation
Check if there’s an increase in volume during the breakout. A breakout with strong volume provides confirmation.
Retest
After a breakout, it's common for the price to retest the previous resistance (now turned support). Waiting for this retest can provide a safer entry point with reduced risk.
Targets
First target: The recent swing high near $24.50.
Second target: $28.50, where there’s visible resistance.
Risk Management
Place a stop-loss below the breakout level or the lower trendline of the wedge in case the breakout fails.
Phemex Analysis #52: How to Trade LINK like a ProIn the world of cryptocurrencies, every token has a story, and Chainlink ( PHEMEX:LINKUSDT.P ) is no exception. Since its launch in 2017, LINK has established itself as a leader in decentralized oracles, bridging the gap between blockchain technology and real-world data. But what truly captivates traders is LINK’s price journey—a rollercoaster ride filled with opportunities and challenges.
If you’ve been following our analysis, you might recall our deep dive into Cardano (ADA) last week. ADA had its own impressive run during the November 2024 bull market, but this week, we shift our focus to LINK. Like ADA, LINK also experienced a massive surge during the bull run, climbing from $10.245 on November 5th to an impressive $30.954 by December 13th—a staggering 302% rally that left investors euphoric. However, the tide turned, and LINK tumbled to $17.804, a 42% drop from its peak.
Now, with the price hovering in this range, the question on everyone’s mind is: What’s next for LINK? Is it time to buy the dip, or should traders prepare for more turbulence? Let’s explore three possible scenarios for LINK’s price movement and uncover some Pro Tips along the way.
Scenario 1: Continued Bearish Momentum
Picture this: The crypto market remains under pressure, weighed down by bearish sentiment. LINK struggles to reclaim higher levels and forms a lower high—failing to break above $24.79 in the coming days. Then, the unthinkable happens: LINK breaks below its crucial $17.5 support level with heavy selling volume. The price plunges further, testing key support zones at $16.1, $13, or even as low as $10.2.
For traders, this scenario might feel like walking through a storm, but opportunities often hide in chaos.
Pro Tips:
•If you’re daring and willing to take on higher risk, consider entering at $16.1 for potential upside—but be prepared for more downside.
•For those seeking balance between risk and reward, $13 might be your sweet spot.
•If you’re cautious and prefer minimizing risk, wait for $10.2—a level that offers a safer entry point but comes with the risk of missing out if the dip doesn’t go that deep.
•Want to play it smart? Use scaled orders to spread your entries between $16 and $13 (medium-high risk) or $13 and $10.2 (medium-low risk).
Scenario 2: A Period of Calm—Consolidation
After months of wild swings—first the November bull run and then January’s sharp drop—LINK might finally catch its breath. Imagine the price settling into a quiet rhythm, moving sideways with little fanfare. In this scenario, LINK forms a lower high (below $24.79) but drifts slowly toward the $17.5 support level with low trading volume.
For seasoned traders, this could be an opportunity to profit from the calm before the storm.
Pro Tips:
•Deploy grid trading bots to capitalize on small price fluctuations during this consolidation phase.
•If you expect prices to rebound from support levels, start long grid bots near $17.5.
•If you believe prices will struggle near resistance levels, start short grid bots near $24.79.
This period of consolidation may not be thrilling, but it offers a chance for traders to sharpen their skills and prepare for what’s next.
Scenario 3: The Bullish Breakout
Now imagine a scenario where LINK starts showing signs of life—a bullish breakout that reignites hope among traders. If this breakout happens in the next few days, it’s likely to be a quick pump-and-dump rally—a short-lived rise that fizzles out almost as quickly as it began. However, if the breakout occurs after a period of consolidation, it could signal something more meaningful: a sustained upward trend.
The key lies in timing and volume. A breakout above $24.79 with high trading volume would be the first signal that LINK is ready to climb higher. From there, traders can look toward resistance levels at $26 and $30.4 as potential profit-taking zones.
Pro Tips:
•If the breakout occurs after consolidation, it’s more likely to be sustained—watch for high volume as confirmation.
•Consider going long once LINK breaks above $24.79 and aim for profit targets around $26 and $30.4.
•Stay cautious if the breakout happens too quickly without consolidation—it could be a short-term pump with limited follow-through.
This scenario is all about patience and precision. Waiting for consolidation before entering can help traders avoid false breakouts and position themselves for a potentially rewarding move upward.
Conclusion
Trading LINK isn’t just about numbers; it’s about understanding its narrative within the broader market context—and learning from similar tokens like ADA can provide valuable insight into how markets behave under similar conditions.
Whether it’s navigating bearish waters like Scenario 1, profiting during periods of calm consolidation like Scenario 2, or riding bullish waves like Scenario 3—each scenario offers unique opportunities for those who are prepared.
As you chart your course with LINK (and keep an eye on ADA), remember that every trade tells a story—and yours can be one of success if you stay disciplined, manage your risks wisely, and adapt to changing market conditions. So gear up and trade LINK like a pro—because every great trader knows that fortune favors the bold but rewards the prepared!
Final Tips:
Take your trading to the next level with Coin-M perpetual contracts, where you can use your ADA or LINK as collateral to trade and accumulate more tokens along the way. Phemex will list Coin-M perpetual contracts for ADA, LINK, AVAX, and SUI on January 16th. Don’t miss it—check it out!
Disclaimer: This is NOT financial or investment advice. Please conduct your own research (DYOR). Phemex is not responsible, directly or indirectly, for any damage or loss incurred or claimed to be caused by or in association with the use of or reliance on any content, goods, or services mentioned in this article.